***Last / Change / Volume data in this table is the closing quote data***
Symbol/Exchange
Company Name
Industry Group |
PRICE |
CHANGE
(%Change) |
Day High |
Volume
(% DAV)
(% 50 day avg vol) |
52 Wk Hi
% From Hi |
Featured
Date |
Price
Featured |
Pivot Featured |
|
Max Buy |
ABV
-
NYSE
Comp De Bebidas Adr
FOOD and BEVERAGE - Beverages - Brewers
|
$144.32
|
+0.80
0.56% |
$145.36
|
550,403
85.31% of 50 DAV
50 DAV is 645,200
|
$144.29
0.02%
|
11/4/2010
|
$142.35
|
PP = $143.63
|
|
MB = $150.81
|
Most Recent Note - 11/4/2010 5:01:33 PM
Y - Gapped up today and finished at its second highest close ever. Its recent low ($133.38 on 10/27/10) defines initial chart support above its 50 DMA line ($125.70 now). Color code is changed to yellow after an advanced "3-weeks tight" type pattern, with new pivot point based on its 10/25/10 high plus ten cents. Disciplined investors may consider a powerful technical breakout and close above its pivot point with heavy volume to be a new (or add-on) buy signal.
>>> The latest Featured Stock Update with an annotated graph appeared on 10/11/2010. Click here.
View all notes |
Alert me of new notes |
CANSLIM.net Company Profile |
SEC |
Zacks Reports |
StockTalk |
News |
Chart |
Request a new note
C
A N
S L
I M


|
ARUN
-
NASDAQ
Aruba Networks Inc
COMPUTER HARDWARE - Networking andamp; Communication Dev
|
$23.15
|
+0.02
0.09% |
$23.37
|
812,430
30.99% of 50 DAV
50 DAV is 2,621,600
|
$23.85
-2.94%
|
8/30/2010
|
$18.12
|
PP = $18.51
|
|
MB = $19.44
|
 Most Recent Note - 11/8/2010 4:57:51 PM
G - Hovering near its 52-week and all-time highs today with volume totals cooling while it stubbornly holds its ground. Found great support near its 50 DMA line during its choppy 5-week consolidation near its 2007 all-time highs.
>>> The latest Featured Stock Update with an annotated graph appeared on 10/26/2010. Click here.
View all notes |
Alert me of new notes |
CANSLIM.net Company Profile |
SEC |
Zacks Reports |
StockTalk |
News |
Chart |
Request a new note
C
A N
S L
I M
|
BIDU
-
NASDAQ
Baidu Inc Ads
INTERNET - Internet Information Providers
|
$110.40
|
+1.60
1.47% |
$111.20
|
7,326,195
63.50% of 50 DAV
50 DAV is 11,536,900
|
$113.78
-2.97%
|
9/17/2010
|
$85.73
|
PP = $88.42
|
|
MB = $92.84
|
Most Recent Note - 11/8/2010 5:00:03 PM
G - Volume totals have been cooling while hovering near all-time highs, stubbornly holding its ground. Extended from a sound base pattern now, its 50 DMA line defines important support to watch.
>>> The latest Featured Stock Update with an annotated graph appeared on 10/7/2010. Click here.
View all notes |
Alert me of new notes |
CANSLIM.net Company Profile |
SEC |
Zacks Reports |
StockTalk |
News |
Chart |
Request a new note
C
A N
S L
I M
|
CACC
-
NASDAQ
Credit Acceptance Corp
FINANCIAL SERVICES - Credit Services
|
$60.55
|
-1.27
-2.05% |
$61.75
|
22,787
85.67% of 50 DAV
50 DAV is 26,600
|
$63.45
-4.57%
|
11/3/2010
|
$59.86
|
PP = $63.55
|
|
MB = $66.73
|
Most Recent Note - 11/4/2010 4:39:43 PM
Y - Solid gain today with above average volume after rising above its 50 DMA line on the prior session. A subsequent breakout above its pivot point on heavy volume could trigger a new (or add-on) buy signal, meanwhile it is ideal for investors' watchlists. It reported earnings +26% on +11% sales revenues for the quarter ended September 30, 2010. Its $55.07 low (on 10/04/10) defines the nearest chart support level to watch above its long ago chart highs ($53.97).
>>> The latest Featured Stock Update with an annotated graph appeared on 10/29/2010. Click here.
View all notes |
Alert me of new notes |
CANSLIM.net Company Profile |
SEC |
Zacks Reports |
StockTalk |
News |
Chart |
Request a new note
C
A N
S L
I M
|
CMG
-
NYSE
Chipotle Mexican Grill
LEISURE - Restaurants
|
$229.90
|
-0.66
-0.29% |
$232.00
|
707,757
89.37% of 50 DAV
50 DAV is 791,900
|
$232.33
-1.05%
|
9/1/2010
|
$158.31
|
PP = $155.52
|
|
MB = $163.30
|
Most Recent Note - 11/5/2010 11:20:24 PM
G - Considerable gain today with above average volume for a new all-time high. It is extended from a sound base. Its 50 DMA line defines chart support to watch.
>>> The latest Featured Stock Update with an annotated graph appeared on 10/28/2010. Click here.
View all notes |
Alert me of new notes |
CANSLIM.net Company Profile |
SEC |
Zacks Reports |
StockTalk |
News |
Chart |
Request a new note
C
A N
S L
I M
|
Symbol/Exchange
Company Name
Industry Group |
PRICE |
CHANGE
(%Change) |
Day High |
Volume
(% DAV)
(% 50 day avg vol) |
52 Wk Hi
% From Hi |
Featured
Date |
Price
Featured |
Pivot Featured |
|
Max Buy |
CTRP
-
NASDAQ
Ctrip.Com Intl Ltd Adr
LEISURE - Resorts and Casinos
|
$47.39
|
-0.13
-0.27% |
$48.52
|
2,833,288
149.33% of 50 DAV
50 DAV is 1,897,300
|
$53.16
-10.85%
|
9/24/2010
|
$46.75
|
PP = $47.11
|
|
MB = $49.47
|
Most Recent Note - 11/4/2010 5:27:17 PM
G - Small loss today on heavy volume after a considerable loss with heavy volume on the prior session. Reported earnings +68% on +52% sales revenues for the quarter ended September 30, 2010 versus the year ago period. Prior highs in the $47 area and its 50 DMA line define important chart support to watch.
>>> The latest Featured Stock Update with an annotated graph appeared on 9/28/2010. Click here.
View all notes |
Alert me of new notes |
CANSLIM.net Company Profile |
SEC |
Zacks Reports |
StockTalk |
News |
Chart |
Request a new note
C
A N
S L
I M
|
DECK
-
NASDAQ
Deckers Outdoor Corp
CONSUMER NON-DURABLES - Textile - Apparel Footwear
|
$62.66
|
+0.10
0.15% |
$63.22
|
1,121,125
104.55% of 50 DAV
50 DAV is 1,072,300
|
$62.66
-0.01%
|
10/27/2010
|
$54.16
|
PP = $54.86
|
|
MB = $57.60
|
Most Recent Note - 11/5/2010 10:33:19 AM
G - Gapped up today, hitting another new 52-week high and getting more extended from its latest sound base. Prior highs in the $54-56 area define important chart support to watch.
>>> The latest Featured Stock Update with an annotated graph appeared on 10/27/2010. Click here.
View all notes |
Alert me of new notes |
CANSLIM.net Company Profile |
SEC |
Zacks Reports |
StockTalk |
News |
Chart |
Request a new note
C
A N
S L
I M
|
EBIX
-
NASDAQ
Ebix Inc
COMPUTER SOFTWARE and SERVICES - Business Software and Services
|
$26.28
|
+1.10
4.37% |
$26.28
|
1,355,021
211.19% of 50 DAV
50 DAV is 641,600
|
$26.36
-0.30%
|
9/23/2010
|
$21.78
|
PP = $22.74
|
|
MB = $23.88
|
Most Recent Note - 11/8/2010 4:44:49 PM
G - Gapped up and closed at the session high today with its gain backed by twice average volume. It was mentioned in a "Ken's Mailbag" article today (read here). Recent low ($22.12 on 10/26/10) and its 50 DMA line define support, while losses leading to violations would raise concerns and trigger technical sell signals. Due to report earnings on Tuesday, November 9, 2010.
>>> The latest Featured Stock Update with an annotated graph appeared on 9/24/2010. Click here.
View all notes |
Alert me of new notes |
CANSLIM.net Company Profile |
SEC |
Zacks Reports |
StockTalk |
News |
Chart |
Request a new note
C
A N
S L
I M
|
EZPW
-
NASDAQ
Ezcorp Inc Cl A
SPECIALTY RETAIL - Specialty Retail, Other
|
$25.02
|
+0.55
2.25% |
$25.28
|
616,241
213.82% of 50 DAV
50 DAV is 288,200
|
$24.54
1.96%
|
11/5/2010
|
$24.02
|
PP = $23.85
|
|
MB = $25.04
|
Most Recent Note - 11/8/2010 4:54:48 PM
G - Color code was changed to green after it quickly rallied above its "max buy" level and hit another new high today with above average volume behind its 5th consecutive gain. Technically, it broke out from a 6-month cup shaped base without a proper handle last week.
>>> The latest Featured Stock Update with an annotated graph appeared on 11/6/2010. Click here.
View all notes |
Alert me of new notes |
CANSLIM.net Company Profile |
SEC |
Zacks Reports |
StockTalk |
News |
Chart |
Request a new note
C
A N
S L
I M
|
FFIV
-
NASDAQ
F 5 Networks Inc
INTERNET - Internet Software and Services
|
$122.82
|
-0.18
-0.15% |
$124.29
|
1,282,192
49.48% of 50 DAV
50 DAV is 2,591,400
|
$125.39
-2.05%
|
6/16/2010
|
$74.50
|
PP = $74.10
|
|
MB = $77.81
|
Most Recent Note - 11/3/2010 5:36:28 PM
G - Hit a new high today with a considerable gain on average volume after holding its ground stubbornly following its big 10/27/10 gap up. It may go on to produce more climactic gains, however it did not form a sound new base and may be considered "late stage" after its considerable rally this year.
>>> The latest Featured Stock Update with an annotated graph appeared on 9/13/2010. Click here.
View all notes |
Alert me of new notes |
CANSLIM.net Company Profile |
SEC |
Zacks Reports |
StockTalk |
News |
Chart |
Request a new note
C
A N
S L
I M
|
Symbol/Exchange
Company Name
Industry Group |
PRICE |
CHANGE
(%Change) |
Day High |
Volume
(% DAV)
(% 50 day avg vol) |
52 Wk Hi
% From Hi |
Featured
Date |
Price
Featured |
Pivot Featured |
|
Max Buy |
FOSL
-
NASDAQ
Fossil Inc
CONSUMER DURABLES - Recreational Goods, Other
|
$63.97
|
+1.75
2.81% |
$64.00
|
1,566,469
206.17% of 50 DAV
50 DAV is 759,800
|
$62.31
2.66%
|
10/20/2010
|
$54.12
|
PP = $55.61
|
|
MB = $58.39
|
Most Recent Note - 11/8/2010 4:49:50 PM
G - Solid gain today and strong close near the session high with twice average volume for another new high, getting more extended from a sound base. The nearby chart support level to watch is its 50 DMA line. Earnings news is due prior to the market open on Tuesday, November 9, 2010.
>>> The latest Featured Stock Update with an annotated graph appeared on 10/5/2010. Click here.
View all notes |
Alert me of new notes |
CANSLIM.net Company Profile |
SEC |
Zacks Reports |
StockTalk |
News |
Chart |
Request a new note
C
A N
S L
I M
|
HMSY
-
NASDAQ
H M S Holdings Corp
COMPUTER SOFTWARE and SERVICES - Healthcare Information Service
|
$60.93
|
-0.14
-0.23% |
$61.14
|
171,843
80.41% of 50 DAV
50 DAV is 213,700
|
$62.91
-3.15%
|
9/27/2010
|
$57.97
|
PP = $58.36
|
|
MB = $61.28
|
Most Recent Note - 11/5/2010 11:24:02 PM
Y - Solid gain today with above average volume. Prompt support showed up near its 50 DMA line following its latest earnings report.
>>> The latest Featured Stock Update with an annotated graph appeared on 9/27/2010. Click here.
View all notes |
Alert me of new notes |
CANSLIM.net Company Profile |
SEC |
Zacks Reports |
StockTalk |
News |
Chart |
Request a new note
C
A N
S L
I M
|
HS
-
NYSE
Healthspring Inc
HEALTH SERVICES - Health Care Plans
|
$27.95
|
+0.13
0.47% |
$28.13
|
460,586
58.52% of 50 DAV
50 DAV is 787,100
|
$29.80
-6.21%
|
8/27/2010
|
$19.91
|
PP = $19.75
|
|
MB = $20.74
|
Most Recent Note - 11/5/2010 11:33:06 PM
G - Finished the week -6.6% off its 52-week high, extended from any sound base. After recently dipping near its 50 DMA line it found prompt support.
>>> The latest Featured Stock Update with an annotated graph appeared on 10/22/2010. Click here.
View all notes |
Alert me of new notes |
CANSLIM.net Company Profile |
SEC |
Zacks Reports |
StockTalk |
News |
Chart |
Request a new note
C
A N
S L
I M
|
IGTE
-
NASDAQ
Igate Corp
COMPUTER SOFTWARE and SERVICES - Information Technology Service
|
$21.68
|
+0.82
3.93% |
$21.75
|
893,204
140.73% of 50 DAV
50 DAV is 634,700
|
$21.10
2.75%
|
10/26/2010
|
$17.29
|
PP = $19.55
|
|
MB = $20.53
|
Most Recent Note - 11/8/2010 4:46:32 PM
G - Gapped up today, rallying for a new high with above average volume. Extended from its latest base, its prior chart highs in the $19 area define initial chart support above its 50 DMA line.
>>> The latest Featured Stock Update with an annotated graph appeared on 9/10/2010. Click here.
View all notes |
Alert me of new notes |
CANSLIM.net Company Profile |
SEC |
Zacks Reports |
StockTalk |
News |
Chart |
Request a new note
C
A N
S L
I M
|
JOBS
-
NASDAQ
Fifty One Job Inc Ads
DIVERSIFIED SERVICES - Staffing and; Outsourcing Service
|
$49.33
|
+4.29
9.52% |
$49.49
|
400,978
219.71% of 50 DAV
50 DAV is 182,500
|
$47.48
3.90%
|
10/13/2010
|
$42.07
|
PP = $40.60
|
|
MB = $42.63
|
Most Recent Note - 11/8/2010 12:46:25 PM
G - Considerable gain with above average volume today for a new 52-week high after wedging higher without great volume conviction in the weeks since its big 10/13/10 gain on heavy volume. It has not formed a sound base and it is extended almost +100% above its 200 DMA line, prompting some caution. Reporting earnings after the market closes on Tuesday, November 9, 2010.
>>> The latest Featured Stock Update with an annotated graph appeared on 9/16/2010. Click here.
View all notes |
Alert me of new notes |
CANSLIM.net Company Profile |
SEC |
Zacks Reports |
StockTalk |
News |
Chart |
Request a new note
C
A N
S L
I M
|
Symbol/Exchange
Company Name
Industry Group |
PRICE |
CHANGE
(%Change) |
Day High |
Volume
(% DAV)
(% 50 day avg vol) |
52 Wk Hi
% From Hi |
Featured
Date |
Price
Featured |
Pivot Featured |
|
Max Buy |
LFT
-
NYSE
Longtop Financl Tech Ads
COMPUTER SOFTWARE and SERVICES - Business Software and Services
|
$41.98
|
+0.24
0.57% |
$42.59
|
403,490
79.60% of 50 DAV
50 DAV is 506,900
|
$42.28
-0.71%
|
11/5/2010
|
$41.83
|
PP = $40.96
|
|
MB = $43.01
|
Most Recent Note - 11/5/2010 11:22:29 PM
Y - Color code was changed to yellow with new pivot point cited in today's mid-day report based on its 10/14/10 high plus 10 cents. Its Relative Strength rank has improved to 83 based on its recent gains. A strong close with heavy volume confirmed a new technical buy signal.
>>> The latest Featured Stock Update with an annotated graph appeared on 10/14/2010. Click here.
View all notes |
Alert me of new notes |
CANSLIM.net Company Profile |
SEC |
Zacks Reports |
StockTalk |
News |
Chart |
Request a new note
C
A N
S L
I M
|
LULU
-
NASDAQ
Lululemon Athletica
MANUFACTURING - Textile Manufacturing
|
$49.55
|
+1.46
3.04% |
$49.74
|
1,741,238
136.51% of 50 DAV
50 DAV is 1,275,500
|
$48.45
2.27%
|
10/8/2010
|
$47.66
|
PP = $46.67
|
|
MB = $49.00
|
Most Recent Note - 11/8/2010 4:52:28 PM
G - Surged to a new 52-week high today, closing above its "max buy" level, so its color code is changed to green. Its strong close on Friday with a considerable gain on more that twice average volume provided a confirming sign of institutional accumulation. Recent lows in the $42 area define support to watch now coinciding near its 50 DMA line.
>>> The latest Featured Stock Update with an annotated graph appeared on 10/8/2010. Click here.
View all notes |
Alert me of new notes |
CANSLIM.net Company Profile |
SEC |
Zacks Reports |
StockTalk |
News |
Chart |
Request a new note
C
A N
S L
I M
|
MRX
-
NYSE
Medicis Pharmaceut Cl A
DRUGS - Biotechnology
|
$28.15
|
-0.62
-2.16% |
$28.84
|
1,192,100
108.85% of 50 DAV
50 DAV is 1,095,200
|
$30.94
-9.02%
|
8/12/2010
|
$26.88
|
PP = $26.71
|
|
MB = $28.05
|
Most Recent Note - 11/8/2010 4:40:46 PM
G - Down today on average volume, closing near the session low. It gapped down on 11/05/10, technically violating its 50 DMA line and recent chart lows, raising concerns and triggering a technical sell signal. Based on its deterioration it will be dropped from the Featured Stocks list tonight. Reported earnings +16% on +17% sales revenues for the quarter ended September 30, 2010 versus the year ago period, marking its weakest increases in 5 quarterly comparisons.
>>> The latest Featured Stock Update with an annotated graph appeared on 10/4/2010. Click here.
View all notes |
Alert me of new notes |
CANSLIM.net Company Profile |
SEC |
Zacks Reports |
StockTalk |
News |
Chart |
Request a new note
C
A N
S L
I M
|
MWIV
-
NASDAQ
M W I Veterinary Supply
HEALTH SERVICES - Medical Instruments and; Supplies
|
$58.41
|
-0.22
-0.38% |
$59.56
|
44,623
77.61% of 50 DAV
50 DAV is 57,500
|
$63.94
-8.65%
|
11/4/2010
|
$61.79
|
PP = $59.60
|
|
MB = $62.58
|
Most Recent Note - 11/5/2010 2:16:39 PM
Y - Slumping under its pivot point, enduring more distributional pressure today and raising concerns, as a weak finish could negate its latest breakout. Yesterday a new pivot point was cited based on its 52-week high plus 10 cents as its color code was changed to yellow following its latest strong earnings report.
>>> The latest Featured Stock Update with an annotated graph appeared on 11/2/2010. Click here.
View all notes |
Alert me of new notes |
CANSLIM.net Company Profile |
SEC |
Zacks Reports |
StockTalk |
News |
Chart |
Request a new note
C
A N
S L
I M
|
NEM
-
NYSE
Newmont Mining Corp
METALS and MINING - Gold
|
$62.63
|
+1.01
1.64% |
$62.83
|
6,690,339
100.08% of 50 DAV
50 DAV is 6,684,800
|
$65.50
-4.38%
|
8/31/2010
|
$61.32
|
PP = $63.48
|
|
MB = $66.65
|
Most Recent Note - 11/4/2010 4:35:46 PM
G - Gapped up today and closed -6% off its 52-week high, near its 50 DMA line. That important short-term average has recently acted as resistance.
>>> The latest Featured Stock Update with an annotated graph appeared on 9/14/2010. Click here.
View all notes |
Alert me of new notes |
CANSLIM.net Company Profile |
SEC |
Zacks Reports |
StockTalk |
News |
Chart |
Request a new note
C
A N
S L
I M
|
Symbol/Exchange
Company Name
Industry Group |
PRICE |
CHANGE
(%Change) |
Day High |
Volume
(% DAV)
(% 50 day avg vol) |
52 Wk Hi
% From Hi |
Featured
Date |
Price
Featured |
Pivot Featured |
|
Max Buy |
NEOG
-
NASDAQ
Neogen Corp
DRUGS - Diagnostic Substances
|
$36.41
|
-0.07
-0.19% |
$36.69
|
48,098
45.76% of 50 DAV
50 DAV is 105,100
|
$36.68
-0.74%
|
9/1/2010
|
$30.79
|
PP = $30.49
|
|
MB = $32.01
|
Most Recent Note - 11/4/2010 4:49:19 PM
Y - Considerable gain today with above average volume for a new 52-week high. Rallying up from its 10 week moving average, it may be considered buyable up to +5% above its recent high ($36.37 plus 5%) as a secondary buy point following its earlier technical breakout, however a new pivot point has not been cited because it did not form a sound new base pattern.
>>> The latest Featured Stock Update with an annotated graph appeared on 10/13/2010. Click here.
View all notes |
Alert me of new notes |
CANSLIM.net Company Profile |
SEC |
Zacks Reports |
StockTalk |
News |
Chart |
Request a new note
C
A N
S L
I M
|
NFLX
-
NASDAQ
Netflix Inc
SPECIALTY RETAIL - Music and Video Stores
|
$169.13
|
+1.03
0.61% |
$170.50
|
4,112,933
73.65% of 50 DAV
50 DAV is 5,584,700
|
$184.74
-8.45%
|
8/10/2010
|
$124.05
|
PP = $124.00
|
|
MB = $130.20
|
Most Recent Note - 11/4/2010 4:20:16 PM
G - Consolidating -9% off its 52-week high with volume cooling after volume-driven gains. It is extended from a sound base after a considerable rally this year.
>>> The latest Featured Stock Update with an annotated graph appeared on 10/1/2010. Click here.
View all notes |
Alert me of new notes |
CANSLIM.net Company Profile |
SEC |
Zacks Reports |
StockTalk |
News |
Chart |
Request a new note
C
A N
S L
I M
|
NTAP
-
NASDAQ
Netapp Inc
COMPUTER HARDWARE - Data Storage Devices
|
$55.97
|
+0.88
1.59% |
$56.00
|
4,132,633
56.92% of 50 DAV
50 DAV is 7,260,900
|
$55.76
0.38%
|
9/8/2010
|
$46.98
|
PP = $44.99
|
|
MB = $47.24
|
Most Recent Note - 11/3/2010 7:51:04 PM
G - Wedged higher for another small gain today with light volume and a new high close. Its recent lows near $47 define an initial chart support level to watch above its 50 DMA line.
>>> The latest Featured Stock Update with an annotated graph appeared on 11/3/2010. Click here.
View all notes |
Alert me of new notes |
CANSLIM.net Company Profile |
SEC |
Zacks Reports |
StockTalk |
News |
Chart |
Request a new note
C
A N
S L
I M
|
ORCL
-
NASDAQ
Oracle Corp
COMPUTER SOFTWARE and SERVICES - Application Software
|
$29.04
|
-0.21
-0.72% |
$29.17
|
27,172,989
66.48% of 50 DAV
50 DAV is 40,875,600
|
$29.82
-2.62%
|
9/20/2010
|
$27.32
|
PP = $26.73
|
|
MB = $28.07
|
Most Recent Note - 11/3/2010 6:13:06 PM
G - Recently wedging to new 52-week highs, getting extended beyond its "max buy" level, without great volume conviction behind gains in the past 2 weeks. It was barely changed on news it agreed to buy Art Technology Group (ARTG +45.12% yesterday) for $1 billion.
>>> The latest Featured Stock Update with an annotated graph appeared on 9/20/2010. Click here.
View all notes |
Alert me of new notes |
CANSLIM.net Company Profile |
SEC |
Zacks Reports |
StockTalk |
News |
Chart |
Request a new note
C
A N
S L
I M
|
PAY
-
NYSE
Verifone Systems Inc
COMPUTER HARDWARE - Transaction Automation Systems
|
$34.91
|
-0.24
-0.68% |
$35.00
|
913,432
65.79% of 50 DAV
50 DAV is 1,388,400
|
$35.94
-2.87%
|
8/25/2010
|
$24.30
|
PP = $23.74
|
|
MB = $24.93
|
Most Recent Note - 11/4/2010 4:45:03 PM
G - Small gap up gain today, hitting another new all-time high. Extended from a sound base pattern. A prior high ($31.40) defines initial chart support above its 50 DMA line.
>>> The latest Featured Stock Update with an annotated graph appeared on 10/25/2010. Click here.
View all notes |
Alert me of new notes |
CANSLIM.net Company Profile |
SEC |
Zacks Reports |
StockTalk |
News |
Chart |
Request a new note
C
A N
S L
I M
|
Symbol/Exchange
Company Name
Industry Group |
PRICE |
CHANGE
(%Change) |
Day High |
Volume
(% DAV)
(% 50 day avg vol) |
52 Wk Hi
% From Hi |
Featured
Date |
Price
Featured |
Pivot Featured |
|
Max Buy |
PRGO
-
NASDAQ
Perrigo Co
DRUGS - Drug Related Products
|
$64.03
|
+0.12
0.19% |
$64.15
|
478,271
58.18% of 50 DAV
50 DAV is 822,000
|
$68.38
-6.36%
|
9/15/2010
|
$63.73
|
PP = $64.76
|
|
MB = $68.00
|
Most Recent Note - 11/3/2010 5:34:43 PM
G - Sank near its 50 DMA line and prior lows with a second consecutive loss on heavy volume today following a worrisome negative reversal after it hit a new 52-week high on the prior session. Color code is changed to green based on disappointing technical action and weaker earnings growth in the latest quarter. Reported its smallest percentage earnings increase in 5 quarters, after +73%, +56%, +52%, +42%, in the Sept '09, Dec '09, Mar '10, and Jun '10 quarters respectively versus the year ago periods, its earnings were up just +23% for the latest quarter ended September 30, 2010.
>>> The latest Featured Stock Update with an annotated graph appeared on 9/15/2010. Click here.
View all notes |
Alert me of new notes |
CANSLIM.net Company Profile |
SEC |
Zacks Reports |
StockTalk |
News |
Chart |
Request a new note
C
A N
S L
I M
|
RAX
-
NYSE
Rackspace Hosting Inc
INTERNET - Internet Software and; Services
|
$26.29
|
-0.17
-0.64% |
$26.70
|
2,649,079
104.25% of 50 DAV
50 DAV is 2,541,100
|
$27.94
-5.91%
|
9/21/2010
|
$22.84
|
PP = $23.61
|
|
MB = $24.79
|
Most Recent Note - 11/3/2010 5:47:19 PM
G - Finished at a new high close today after a considerable rally to a new all-time high on the prior session with heavy volume. Strength in the Internet - Networking group has been reassuring, especially after a gap up gain last week from F5 Networks (FFIV) after earnings news. RAX is due to report earnings on Monday, November 8, 2010, after the close.
>>> The latest Featured Stock Update with an annotated graph appeared on 9/21/2010. Click here.
View all notes |
Alert me of new notes |
CANSLIM.net Company Profile |
SEC |
Zacks Reports |
StockTalk |
News |
Chart |
Request a new note
C
A N
S L
I M
|
ROVI
-
NASDAQ
Rovi Corp
COMPUTER SOFTWARE andamp; SERVICES - Security Software andamp; Services
|
$51.62
|
-0.54
-1.04% |
$52.22
|
888,531
55.59% of 50 DAV
50 DAV is 1,598,300
|
$53.26
-3.08%
|
10/29/2010
|
$49.99
|
PP = $53.10
|
|
MB = $55.76
|
Most Recent Note - 11/5/2010 11:27:42 PM
Y - Light volume marked today's 6th consecutive gain, finishing 15 cents of its best close of 2010. A convincing breakout above its pivot point with volume conviction would trigger a new (or add-on) technical buy signal. Meanwhile, support to watch is defined by its 50 DMA line.
>>> The latest Featured Stock Update with an annotated graph appeared on 10/20/2010. Click here.
View all notes |
Alert me of new notes |
CANSLIM.net Company Profile |
SEC |
Zacks Reports |
StockTalk |
News |
Chart |
Request a new note
C
A N
S L
I M
|
SHOO
-
NASDAQ
Steven Madden Limited
CONSUMER NON-DURABLES - Textile - Apparel Footwear
|
$41.20
|
+0.32
0.78% |
$41.25
|
231,242
66.22% of 50 DAV
50 DAV is 349,200
|
$44.85
-8.14%
|
9/15/2010
|
$38.94
|
PP = $40.27
|
|
MB = $42.28
|
Most Recent Note - 11/8/2010 5:02:33 PM
G - Recently finding support near its 50 DMA line and prior chart highs in the $40 area. More damaging losses leading to a close below its short-term average would raise concerns and trigger technical sell signals.
>>> The latest Featured Stock Update with an annotated graph appeared on 9/29/2010. Click here.
View all notes |
Alert me of new notes |
CANSLIM.net Company Profile |
SEC |
Zacks Reports |
StockTalk |
News |
Chart |
Request a new note
C
A N
S L
I M
|
SLW
-
NYSE
Silver Wheaton Corp
METALS and; MINING - Silver
|
$35.07
|
+2.12
6.43% |
$33.63
|
14,695,943
203.47% of 50 DAV
50 DAV is 7,222,600
|
$33.63
4.28%
|
8/25/2010
|
$21.40
|
PP = $21.99
|
|
MB = $23.09
|
Most Recent Note - 11/8/2010 10:11:40 AM
G - Hit another new all-time high today following another gap up gain. Very extended from any sound base, this high-ranked leader has been recently noted as "One of the strongest names in the Mining - Gold/Silver/Gems group currently included on the Featured Stocks list."
>>> The latest Featured Stock Update with an annotated graph appeared on 10/18/2010. Click here.
View all notes |
Alert me of new notes |
CANSLIM.net Company Profile |
SEC |
Zacks Reports |
StockTalk |
News |
Chart |
Request a new note
C
A N
S L
I M
|
Symbol/Exchange
Company Name
Industry Group |
PRICE |
CHANGE
(%Change) |
Day High |
Volume
(% DAV)
(% 50 day avg vol) |
52 Wk Hi
% From Hi |
Featured
Date |
Price
Featured |
Pivot Featured |
|
Max Buy |
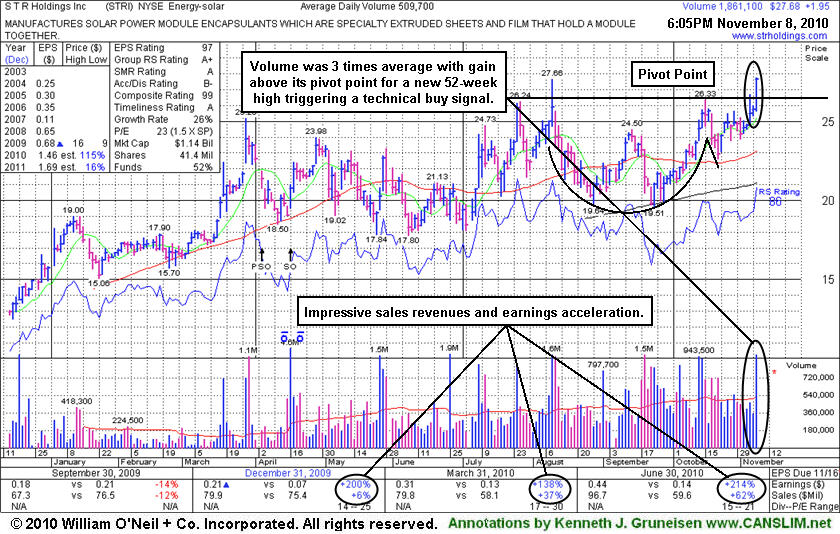
STRI
-
NYSE
S T R Holdings Inc
ELECTRONICS - Semiconductor - Specialized
|
$27.68
|
+1.95
7.58% |
$26.01
|
1,861,481
365.21% of 50 DAV
50 DAV is 509,700
|
$27.66
0.07%
|
11/8/2010
|
$26.52
|
PP = $26.43
|
|
MB = $27.75
|
Most Recent Note - 11/8/2010 1:26:55 PM
Y - Rising near its 52-week high with today's gain on above average volume. Color code is changed to yellow with pivot point based on its 10/15/10 high plus ten cents. It pulled back and found support at its 200 DMA line since the old high was hit when last noted in the 8/10/10 mid-day report. Recent quarters showed sales revenues and earnings accelerating impressively, and earnings news for the latest quarter ended September 30, 2010 is due this Friday. Limited history since public trading began on 11/06/09 is a concern, meanwhile it formed an orderly base since a Secondary Offering was completed on 4/16/10.
>>> The latest Featured Stock Update with an annotated graph appeared on 11/8/2010. Click here.
View all notes |
Alert me of new notes |
CANSLIM.net Company Profile |
SEC |
Zacks Reports |
StockTalk |
News |
Chart |
Request a new note
C
A N
S L
I M
|
UA
-
NYSE
Under Armour Inc Cl A
CONSUMER NON-DURABLES - Textile - Apparel Clothing
|
$51.76
|
+1.50
2.98% |
$50.90
|
863,165
109.97% of 50 DAV
50 DAV is 784,900
|
$50.90
1.69%
|
9/9/2010
|
$39.99
|
PP = $40.10
|
|
MB = $42.11
|
Most Recent Note - 11/8/2010 4:47:44 PM
G - Considerable gain today for yet another new high, getting more extended from any sound base. Quarterly and annual earnings track record has some fundamental flaws with respect to the fact-based investment system. See the latest FSU analysis for more important details.
>>> The latest Featured Stock Update with an annotated graph appeared on 11/4/2010. Click here.
View all notes |
Alert me of new notes |
CANSLIM.net Company Profile |
SEC |
Zacks Reports |
StockTalk |
News |
Chart |
Request a new note
C
A N
S L
I M
|
UFPT
-
NASDAQ
U F P Tech Inc
CONSUMER NON-DURABLES - Packaging and Containers
|
$10.93
|
-0.51
-4.46% |
$11.85
|
146,419
220.51% of 50 DAV
50 DAV is 66,400
|
$13.32
-17.94%
|
9/16/2010
|
$11.20
|
PP = $11.69
|
|
MB = $12.27
|
Most Recent Note - 11/8/2010 4:37:31 PM
G - Third consecutive loss today with above average and ever-increasing volume, raising greater concerns while closing in the lower half of its intra-day range and finishing -17.7% off its 52-week high. Color code was changed to green after damaging losses last week. Only a prompt rebound above its short-term average would help its outlook improve. I will be dropped from the Featured Stocks list tonight.
>>> The latest Featured Stock Update with an annotated graph appeared on 9/17/2010. Click here.
View all notes |
Alert me of new notes |
CANSLIM.net Company Profile |
SEC |
Zacks Reports |
StockTalk |
News |
Chart |
Request a new note
C
A N
S L
I M
|
ULTA
-
NASDAQ
Ulta Salon Cosm & Frag
SPECIALTY RETAIL - Specialty Retail, Other
|
$33.03
|
+0.73
2.26% |
$32.34
|
343,730
52.53% of 50 DAV
50 DAV is 654,300
|
$32.68
1.07%
|
9/3/2010
|
$26.36
|
PP = $25.89
|
|
MB = $27.18
|
Most Recent Note - 11/8/2010 4:51:09 PM
G - Wedged up to a new 52-week high with a 5th consecutive gain today on light volume. Its 50 DMA line defines support to watch above prior chart highs in the $26 area, meanwhile it is extended from a sound base pattern.
>>> The latest Featured Stock Update with an annotated graph appeared on 11/1/2010. Click here.
View all notes |
Alert me of new notes |
CANSLIM.net Company Profile |
SEC |
Zacks Reports |
StockTalk |
News |
Chart |
Request a new note
C
A N
S L
I M
|
VIT
-
NYSE
Vanceinfo Tech Inc Ads
COMPUTER SOFTWARE and SERVICES - Business Software and Services
|
$38.00
|
+0.66
1.77% |
$38.00
|
344,142
56.83% of 50 DAV
50 DAV is 605,600
|
$38.43
-1.12%
|
7/8/2010
|
$25.20
|
PP = $26.58
|
|
MB = $27.91
|
Most Recent Note - 11/5/2010 11:30:45 PM
G - Quietly hovering near all-time highs, extended from any sound base pattern. Meanwhile, its 50 DMA line and recent low ($30.55 on 10/08/10) define important chart support to watch.
>>> The latest Featured Stock Update with an annotated graph appeared on 10/21/2010. Click here.
View all notes |
Alert me of new notes |
CANSLIM.net Company Profile |
SEC |
Zacks Reports |
StockTalk |
News |
Chart |
Request a new note
C
A N
S L
I M
|
Symbol/Exchange
Company Name
Industry Group |
PRICE |
CHANGE
(%Change) |
Day High |
Volume
(% DAV)
(% 50 day avg vol) |
52 Wk Hi
% From Hi |
Featured
Date |
Price
Featured |
Pivot Featured |
|
Max Buy |
WCRX
-
NASDAQ
Warner Chilcott Plc
DRUGS - Drug Manufacturers - Other
|
$20.15
|
-3.19
-13.67% |
$23.84
|
20,604,328
772.04% of 50 DAV
50 DAV is 2,668,800
|
$25.32
-20.42%
|
8/23/2010
|
$21.04
|
PP = $20.84
|
|
MB = $21.88
|
Most Recent Note - 11/8/2010 10:01:51 AM
G - Gapped down today and violated its 50 DMA line following earnings news. The technical breach of near-term support raised concerns and triggered a technical sell signal. Old chart resistance in the $20 area and its 200 DMA line define the next important support levels to watch.
>>> The latest Featured Stock Update with an annotated graph appeared on 10/15/2010. Click here.
View all notes |
Alert me of new notes |
CANSLIM.net Company Profile |
SEC |
Zacks Reports |
StockTalk |
News |
Chart |
Request a new note
C
A N
S L
I M
|