***Last / Change / Volume data in this table is the closing quote data***
Symbol/Exchange
Company Name
Industry Group |
PRICE |
CHANGE
(%Change) |
Day High |
Volume
(% DAV)
(% 50 day avg vol) |
52 Wk Hi
% From Hi |
Featured
Date |
Price
Featured |
Pivot Featured |
|
Max Buy |
ASPS
-
NASDAQ
Altisource Ptf Sltns Sa
REAL ESTATE - Property Management/Developmen
|
$111.94
|
+5.34
5.01% |
$114.43
|
295,346
138.27% of 50 DAV
50 DAV is 213,600
|
$129.72
-13.71%
|
9/24/2012
|
$87.24
|
PP = $92.39
|
|
MB = $97.01
|
 Most Recent Note - 11/7/2012 1:23:24 PM
G - Rallying today with higher volume following a spurt of losses with above average volume. Important support to watch is at its 50 DMA line.
>>> The latest Featured Stock Update with an annotated graph appeared on 10/12/2012. Click here.
View all notes |
Alert me of new notes |
CANSLIM.net Company Profile |
SEC |
Zacks Reports |
StockTalk |
News |
Chart |
Request a new note
C
A N
S L
I M


|
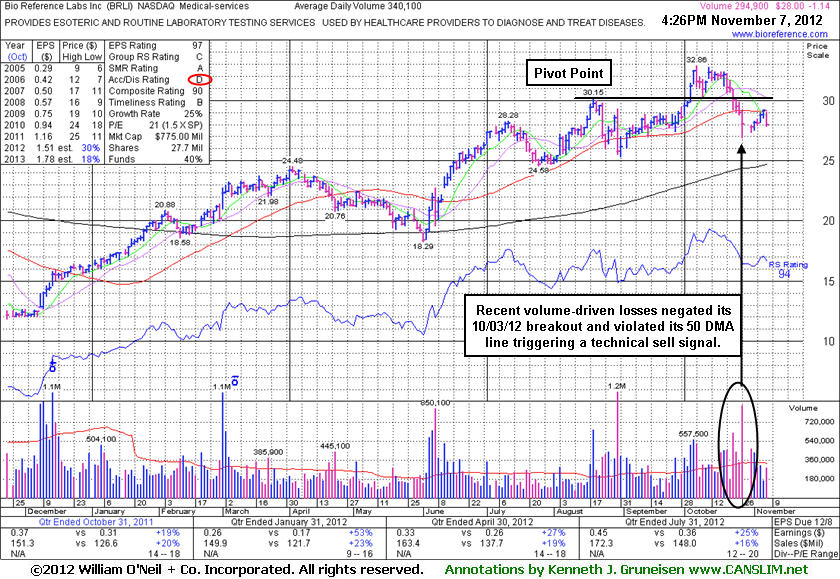
BRLI
-
NASDAQ
Bio Reference Labs Inc
HEALTH SERVICES - Medical Laboratories and Researc
|
$28.00
|
-1.14
-3.91% |
$29.03
|
300,135
88.25% of 50 DAV
50 DAV is 340,100
|
$32.86
-14.79%
|
10/3/2012
|
$30.90
|
PP = $30.25
|
|
MB = $31.76
|
Most Recent Note - 11/7/2012 4:53:48 PM
Retreated from its 50 DMA line today which may now act as a resistance level after damaging distributional action in recent weeks. Based on weakness it will be dropped from the Featured Stocks list tonight. See the latest FSU analysis for more details and a new annotated graph.
>>> The latest Featured Stock Update with an annotated graph appeared on 11/7/2012. Click here.
View all notes |
Alert me of new notes |
CANSLIM.net Company Profile |
SEC |
Zacks Reports |
StockTalk |
News |
Chart |
Request a new note
C
A N
S L
I M
|
CFNL
-
NASDAQ
Cardinal Financial Corp
BANKING - Regional - Southeast Banks
|
$15.80
|
-0.31
-1.92% |
$16.05
|
312,834
260.48% of 50 DAV
50 DAV is 120,100
|
$16.21
-2.53%
|
8/17/2012
|
$12.84
|
PP = $13.31
|
|
MB = $13.98
|
Most Recent Note - 11/7/2012 12:01:58 PM
G - Perched near its 52-week high today, holding its ground stubbornly after getting extended from its prior base. Prior high ($14.79 on 9/24/12) defines initial support to watch above its 50 DMA line on pullbacks.
>>> The latest Featured Stock Update with an annotated graph appeared on 10/25/2012. Click here.
View all notes |
Alert me of new notes |
CANSLIM.net Company Profile |
SEC |
Zacks Reports |
StockTalk |
News |
Chart |
Request a new note
C
A N
S L
I M
|
CMCSA
-
NASDAQ
Comcast Corp Cl A
MEDIA - CATV Systems
|
$36.58
|
-0.59
-1.59% |
$36.93
|
17,394,201
139.49% of 50 DAV
50 DAV is 12,469,600
|
$37.96
-3.64%
|
6/11/2012
|
$29.94
|
PP = $30.98
|
|
MB = $32.53
|
Most Recent Note - 11/7/2012 3:57:39 PM
G - Pulling back from its 52-week high today for a 3rd consecutive small loss with slightly above average volume. Reported earnings +39% on +15% sales revenues for the Sep '12 quarter, a reassuring follow-up to the previously noted sub par quarter. Upward trendline and 50 DMA line define near term support where violations would trigger technical sell signals.
>>> The latest Featured Stock Update with an annotated graph appeared on 10/24/2012. Click here.
View all notes |
Alert me of new notes |
CANSLIM.net Company Profile |
SEC |
Zacks Reports |
StockTalk |
News |
Chart |
Request a new note
C
A N
S L
I M
|
DVA
-
NYSE
Davita Healthcare Prtns
HEALTH SERVICES - Specialized Health Services
|
$112.82
|
-2.16
-1.88% |
$114.99
|
1,149,493
139.81% of 50 DAV
50 DAV is 822,200
|
$116.50
-3.16%
|
9/5/2012
|
$102.92
|
PP = $100.62
|
|
MB = $105.65
|
Most Recent Note - 11/6/2012 1:03:29 PM
G - Hitting another new 52-week high today with volume running at an above average pace while getting more extended from its latest sound base. Prior highs near $100 and its 50 DMA line define near-term support to watch on pullbacks where violations may trigger technical sell signals. Fundamental concerns were raised after it reported earnings +3% on +12% sales for the Sep '12 quarter, below the guidelines of the fact-based system.
>>> The latest Featured Stock Update with an annotated graph appeared on 10/10/2012. Click here.
View all notes |
Alert me of new notes |
CANSLIM.net Company Profile |
SEC |
Zacks Reports |
StockTalk |
News |
Chart |
Request a new note
C
A N
S L
I M
|
Symbol/Exchange
Company Name
Industry Group |
PRICE |
CHANGE
(%Change) |
Day High |
Volume
(% DAV)
(% 50 day avg vol) |
52 Wk Hi
% From Hi |
Featured
Date |
Price
Featured |
Pivot Featured |
|
Max Buy |
GPX
-
NYSE
G P Strategies Corp
DIVERSIFIED SERVICES - Education and Training Services
|
$20.47
|
-0.36
-1.73% |
$20.64
|
40,102
68.67% of 50 DAV
50 DAV is 58,400
|
$20.93
-2.20%
|
10/8/2012
|
$20.00
|
PP = $20.77
|
|
MB = $21.81
|
Most Recent Note - 11/6/2012 4:19:43 PM
G - Today's 4th consecutive gain with above average volume helped it hit a new 52-week high. Recently reported earnings +0% on +12% sales revenues for the Sep '12 quarter, below the +25% minimum earnings guideline, raising fundamental concerns.
>>> The latest Featured Stock Update with an annotated graph appeared on 10/16/2012. Click here.
View all notes |
Alert me of new notes |
CANSLIM.net Company Profile |
SEC |
Zacks Reports |
StockTalk |
News |
Chart |
Request a new note
C
A N
S L
I M
|
LKQ
-
NASDAQ
L K Q Corp
WHOLESALE - Auto Parts
|
$21.46
|
-0.36
-1.65% |
$21.69
|
1,437,554
90.88% of 50 DAV
50 DAV is 1,581,900
|
$21.95
-2.23%
|
8/9/2012
|
$18.97
|
PP = $18.72
|
|
MB = $19.66
|
Most Recent Note - 11/6/2012 4:21:45 PM
G - Rallied with near average volume today for best-ever close. No resistance remains due to overhead supply. Showed impressive resilience and strength after reporting earnings +6% on +30% sales revenues for the Sep '12 quarter. Results below the +25% minimum earnings guideline (C criteria) raised fundamental concerns.
>>> The latest Featured Stock Update with an annotated graph appeared on 10/19/2012. Click here.
View all notes |
Alert me of new notes |
CANSLIM.net Company Profile |
SEC |
Zacks Reports |
StockTalk |
News |
Chart |
Request a new note
C
A N
S L
I M
|
MIDD
-
NASDAQ
Middleby Corp
MANUFACTURING - Diversified Machinery
|
$124.65
|
+4.25
3.53% |
$126.50
|
161,203
202.52% of 50 DAV
50 DAV is 79,600
|
$127.89
-2.53%
|
10/8/2012
|
$118.46
|
PP = $122.67
|
|
MB = $128.80
|
Most Recent Note - 11/7/2012 4:01:04 PM
Y - Rallied near its 52-week high with above average volume behind today's 2nd consecutive gain, rising back above its pivot point after finding prompt support at its 50 DMA line. Reported earnings +23% on +18% sales for the Sep '12 quarter, below the +25% minimum earnings guideline (C criteria). The M criteria remains an overriding concern until a FTD confirms a new rally.
>>> The latest Featured Stock Update with an annotated graph appeared on 10/22/2012. Click here.
View all notes |
Alert me of new notes |
CANSLIM.net Company Profile |
SEC |
Zacks Reports |
StockTalk |
News |
Chart |
Request a new note
C
A N
S L
I M
|
N
-
NYSE
Netsuite Inc
DIVERSIFIED SERVICES - Business/Management Services
|
$61.34
|
-1.55
-2.46% |
$62.51
|
246,901
47.63% of 50 DAV
50 DAV is 518,400
|
$67.02
-8.48%
|
8/20/2012
|
$55.88
|
PP = $59.32
|
|
MB = $62.29
|
Most Recent Note - 11/6/2012 1:04:46 PM
G - Reported earnings +60% on +31% sales revenues for the Sep '12 quarter. Consolidating since a considerable 10/26/12 gap up and volume-driven gain from below its 50 DMA line for new 52-week and all-time highs. It did not form a sound new base pattern. Until the major averages are back in a confirmed rally the M criteria argues against any new buying efforts.
>>> The latest Featured Stock Update with an annotated graph appeared on 10/26/2012. Click here.
View all notes |
Alert me of new notes |
CANSLIM.net Company Profile |
SEC |
Zacks Reports |
StockTalk |
News |
Chart |
Request a new note
C
A N
S L
I M
|
OSIS
-
NASDAQ
O S I Systems Inc
ELECTRONICS - Semiconductor Equipment and Mate
|
$78.56
|
-1.94
-2.41% |
$79.46
|
83,351
73.44% of 50 DAV
50 DAV is 113,500
|
$81.23
-3.29%
|
9/5/2012
|
$74.39
|
PP = $75.10
|
|
MB = $78.86
|
Most Recent Note - 11/7/2012 1:21:13 PM
G - Pulling back from its 52-week high today with a loss on light volume. Recently found prompt support at its 50 DMA line, and it is still slightly extended from its prior base.
>>> The latest Featured Stock Update with an annotated graph appeared on 10/18/2012. Click here.
View all notes |
Alert me of new notes |
CANSLIM.net Company Profile |
SEC |
Zacks Reports |
StockTalk |
News |
Chart |
Request a new note
C
A N
S L
I M
|
Symbol/Exchange
Company Name
Industry Group |
PRICE |
CHANGE
(%Change) |
Day High |
Volume
(% DAV)
(% 50 day avg vol) |
52 Wk Hi
% From Hi |
Featured
Date |
Price
Featured |
Pivot Featured |
|
Max Buy |
RAX
-
NYSE
Rackspace Hosting Inc
INTERNET - Internet Software and; Services
|
$62.95
|
-3.13
-4.74% |
$65.63
|
4,172,714
251.29% of 50 DAV
50 DAV is 1,660,500
|
$69.81
-9.83%
|
11/6/2012
|
$65.44
|
PP = $69.91
|
|
MB = $73.41
|
Most Recent Note - 11/7/2012 1:16:41 PM
G - Color code is changed to green while slumping well below its 50 DMA line with a damaging volume-driven loss today raising concerns. Fundamentals (C and A criteria) remain strong. See the latest FSU analysis for more details and a new annotated graph. A recent streak of 10 consecutive weekly gains helped it rebound impressively from below its 200 DMA line following a deep consolidation since dropped from the Featured Stocks list on 5/14/12.
>>> The latest Featured Stock Update with an annotated graph appeared on 11/6/2012. Click here.
View all notes |
Alert me of new notes |
CANSLIM.net Company Profile |
SEC |
Zacks Reports |
StockTalk |
News |
Chart |
Request a new note
C
A N
S L
I M
|
RNF
-
NYSE
Rentech Nitrogen Ptnr Lp
CHEMICALS - Agricultural Chemicals
|
$38.15
|
-1.00
-2.55% |
$38.95
|
316,413
82.90% of 50 DAV
50 DAV is 381,700
|
$41.15
-7.29%
|
11/1/2012
|
$39.11
|
PP = $40.15
|
|
MB = $42.16
|
Most Recent Note - 11/7/2012 3:45:24 PM
Y - Pulling back today with higher volume, enduring distributional pressure amid a negative market (M criteria). After hitting a new 52-week high on 11/02/12 a "negative reversal" for a loss with above average volume broke a streak of 5 consecutive gains.
>>> The latest Featured Stock Update with an annotated graph appeared on 11/2/2012. Click here.
View all notes |
Alert me of new notes |
CANSLIM.net Company Profile |
SEC |
Zacks Reports |
StockTalk |
News |
Chart |
Request a new note
C
A N
S L
I M
|
TDG
-
NYSE
Transdigm Group Inc
AEROSPACE/DEFENSE - Aerospace/Defense Products and; Services
|
$138.00
|
-2.12
-1.51% |
$139.17
|
311,001
61.50% of 50 DAV
50 DAV is 505,700
|
$140.49
-1.77%
|
8/16/2012
|
$132.23
|
PP = $136.44
|
|
MB = $143.26
|
Most Recent Note - 11/6/2012 4:28:00 PM
G - Hit a new high (following a 10/23/12 special dividend) with today's gain on light volume. When noted on 10/23/12 it undercut its 50 DMA line, yet it promptly rebounded back above that important short-term average.
>>> The latest Featured Stock Update with an annotated graph appeared on 10/23/2012. Click here.
View all notes |
Alert me of new notes |
CANSLIM.net Company Profile |
SEC |
Zacks Reports |
StockTalk |
News |
Chart |
Request a new note
C
A N
S L
I M
|
ULTA
-
NASDAQ
Ulta Salon Cosm & Frag
SPECIALTY RETAIL - Specialty Retail, Other
|
$93.05
|
-1.01
-1.07% |
$94.42
|
459,068
63.74% of 50 DAV
50 DAV is 720,200
|
$103.52
-10.11%
|
9/4/2012
|
$93.17
|
PP = $98.52
|
|
MB = $103.45
|
Most Recent Note - 11/5/2012 4:55:59 PM
G - Its 200 DMA line defines near-term support to watch while its waning Relative Strength Rating has raised concerns. See the latest FSU analysis for more details and a new annotated graph.
>>> The latest Featured Stock Update with an annotated graph appeared on 11/5/2012. Click here.
View all notes |
Alert me of new notes |
CANSLIM.net Company Profile |
SEC |
Zacks Reports |
StockTalk |
News |
Chart |
Request a new note
C
A N
S L
I M
|
ULTI
-
NASDAQ
Ultimate Software Group
INTERNET - Internet Software and Services
|
$91.96
|
-2.54
-2.69% |
$93.53
|
195,514
122.43% of 50 DAV
50 DAV is 159,700
|
$106.40
-13.57%
|
10/31/2012
|
$101.36
|
PP = $105.00
|
|
MB = $110.25
|
Most Recent Note - 11/7/2012 3:50:20 PM
Gapped down today, slumping further below its 50 DMA line and undercutting prior lows raising more serious concerns. Reported earnings +61% on +22% sales revenues for the Sep '12 quarter. A rebound above its 50 DMA is needed to improve its technical stance. Based on weakness it will be dropped from the Featured Stocks list tonight.
>>> The latest Featured Stock Update with an annotated graph appeared on 10/31/2012. Click here.
View all notes |
Alert me of new notes |
CANSLIM.net Company Profile |
SEC |
Zacks Reports |
StockTalk |
News |
Chart |
Request a new note
C
A N
S L
I M
|
Symbol/Exchange
Company Name
Industry Group |
PRICE |
CHANGE
(%Change) |
Day High |
Volume
(% DAV)
(% 50 day avg vol) |
52 Wk Hi
% From Hi |
Featured
Date |
Price
Featured |
Pivot Featured |
|
Max Buy |
VSI
-
NYSE
Vitamin Shoppe Inc
SPECIALTY RETAIL - Specialty Retail, Other
|
$60.11
|
-1.56
-2.53% |
$60.88
|
485,963
172.94% of 50 DAV
50 DAV is 281,000
|
$61.89
-2.88%
|
10/15/2012
|
$57.82
|
PP = $60.08
|
|
MB = $63.08
|
Most Recent Note - 11/7/2012 1:19:53 PM
Y - Gapped down today. A considerable gap up and volume-driven gain on the prior session helped it rally back above its 50 DMA line after it released better than expected earnings +35% on +14% sales revenues for the Sep '12 quarter. Keep in mind the M criteria which argues against new buying efforts until the market is back in a confirmed rally.
>>> The latest Featured Stock Update with an annotated graph appeared on 10/15/2012. Click here.
View all notes |
Alert me of new notes |
CANSLIM.net Company Profile |
SEC |
Zacks Reports |
StockTalk |
News |
Chart |
Request a new note
C
A N
S L
I M
|
WPI
-
NYSE
Watson Pharmaceuticals
DRUGS - Drugs - Generic
|
$86.99
|
-0.45
-0.51% |
$89.07
|
748,689
80.93% of 50 DAV
50 DAV is 925,100
|
$90.00
-3.34%
|
8/24/2012
|
$82.90
|
PP = $81.10
|
|
MB = $85.16
|
Most Recent Note - 11/7/2012 3:55:28 PM
G - Consolidating just -2.9% off its 52-week high today after recently finding support at its 50 DMA line. Reported earnings +24% on +19% sales revenues for the Sep '12 quarter, a notch below the +25% minimum guideline (C criteria). It has not formed a sound base and it is extended from a proper buy point under the fact-based system's guidelines.
>>> The latest Featured Stock Update with an annotated graph appeared on 11/1/2012. Click here.
View all notes |
Alert me of new notes |
CANSLIM.net Company Profile |
SEC |
Zacks Reports |
StockTalk |
News |
Chart |
Request a new note
C
A N
S L
I M
|