You are not logged in.
This means you
CAN ONLY VIEW reports that were published prior to Monday, April 14, 2025.
You
MUST UPGRADE YOUR MEMBERSHIP if you want to see any current reports.
AFTER MARKET UPDATE - TUESDAY, NOVEMBER 6TH, 2012
Previous After Market Report Next After Market Report >>>
|
|
|
|
DOW |
+133.24 |
13,245.68 |
+1.02% |
|
Volume |
672,951,150 |
+12% |
|
Volume |
1,730,467,000 |
+20% |
|
NASDAQ |
+12.27 |
3,011.93 |
+0.41% |
|
Advancers |
2,138 |
68% |
|
Advancers |
1,590 |
62% |
|
S&P 500 |
+11.13 |
1,428.39 |
+0.79% |
|
Decliners |
872 |
28% |
|
Decliners |
853 |
34% |
|
Russell 2000 |
+6.10 |
825.64 |
+0.74% |
|
52 Wk Highs |
141 |
|
|
52 Wk Highs |
57 |
|
|
S&P 600 |
-2.41 |
461.28 |
-0.52% |
|
52 Wk Lows |
15 |
|
|
52 Wk Lows |
46 |
|
|
 |
Major Averages Finished Strong With Higher Volume Behind Gains
Kenneth J. Gruneisen - Passed the CAN SLIM® Master's Exam
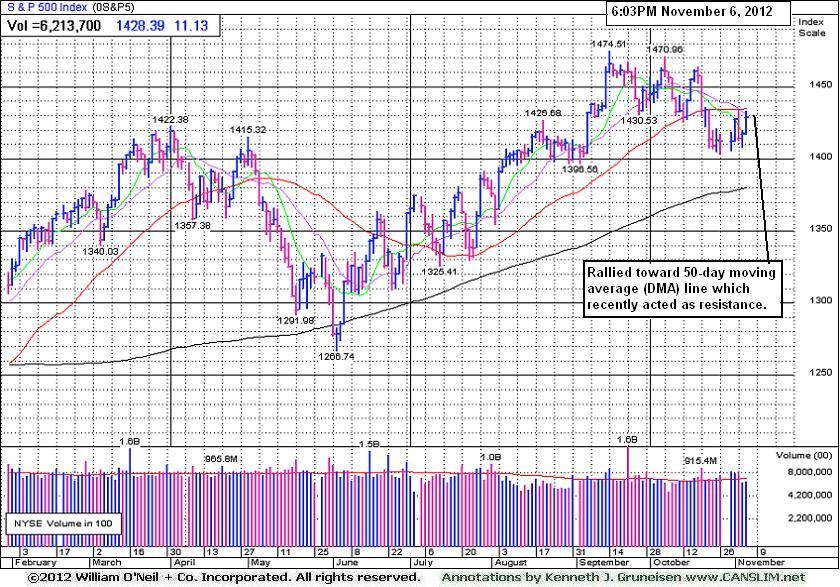
The major averages finished firmly in positive territory on Tuesday. The volume totals were reported higher on the NYSE and on the Nasdaq exchange versus the prior session's totals, hinting that institutional buying demand was on the rise behind the market's rally effort. Breadth was positive as advancers led decliners by more than a 2-1 margin on the NYSE and by nearly 2-1 on the Nasdaq exchange. The total number of stocks hitting new 52-week highs outnumbered new 52-week lows on the NYSE and on the Nasdaq exchange. There were 48 high-ranked companies from the CANSLIM.net Leaders List making new 52-week highs and appearing on the CANSLIM.net BreakOuts Page, up from the prior session total of 27 stocks. There were gains for 12 of the 18 high-ranked companies currently included on the Featured Stocks Page.
The major averages rose for a second straight day as investors awaited the results of the U.S. Presidential election. Energy was among the better performing sectors as the price of crude oil rose above $88 a barrel, and shares of Exxon Mobil Corp (XOM +1.08%) rose. Industrials also were outperforming with Dow component United Technologies Corp (UTX +2.66%) rising. Emerson Electric Co (EMR +1.90%) tallied a gain after posting better-than-expected quarterly results. Financials were higher with Citigroup Inc (C +3.08%) and The Goldman Sachs Group Inc (GS +1.75%) gaining ground.
Health care was an underperforming group, led by a decline in Express Scripts Holding Co (ESRX -12.29%), which was the worst performing stock in the S&P 500. The largest U.S pharmacy benefits manager posted lower-than-expected quarterly revenues and said analyst estimates for 2013 were too high.
Treasuries were lower with the 10-year note declining 9/16 to yield 1.75%.
Tuesday's session marked Day 6 for the Nasdaq Composite Index's rally attempt. The window remains open for an ideal follow-through day, provided that the recent low is not undercut. It was only Day 2 for the Dow's new rally attempt.
During market corrections the M criteria argues against new buying efforts and urges investors to take a defensive stance to protect precious capital. That stance can change back to a bullish stance where buying is encouraged when at least one of the three major averages produces a solid follow-through day (FTD). A FTD confirming a new rally requires substantial gains on higher (ideally above average) volume, coupled with healthy leadership and a respectable number of stocks hitting new 52-week highs. Historic studies have shown that a FTD occurring between Days 4-7 of a new rally effort has often signaled the beginning of the most substantial market rallies.
Investors should always limit losses if ever any stock falls more than -7% from their purchase price. Following strict sell rules is precisely how this fact-based investment system prompts investors to reduce exposure and protect cash during market downturns. Keep a watchlist of strong acting stocks with all-key criteria in anticipation of the next confirmed uptrend. See the noteworthy candidates included on the Featured Stocks Page.
Watch for an announcement via email concerning the next WEBCAST. The webcast will also be available via an updated link highlighted at the top of the Premium Member Homepage.
PICTURED: The S&P 500 Index rallied toward its 50-day moving average (DMA) line which recently acted as resistance. This was Day 5 for the S&P 500 Index's rally attempt. In this commentary we will continue to watch closely for confirming gains within the ideal window for a proper FTD, meanwhile caution and patience are required
|
 Kenneth J. Gruneisen started out as a licensed stockbroker in August 1987, a couple of months prior to the historic stock market crash that took the Dow Jones Industrial Average down -22.6% in a single day. He has published daily fact-based fundamental and technical analysis on high-ranked stocks online for two decades. Through FACTBASEDINVESTING.COM, Kenneth provides educational articles, news, market commentary, and other information regarding proven investment systems that work in good times and bad.
Comments contained in the body of this report are technical opinions only and are not necessarily those of Gruneisen Growth Corp. The material herein has been obtained from sources believed to be reliable and accurate, however, its accuracy and completeness cannot be guaranteed. Our firm, employees, and customers may effect transactions, including transactions contrary to any recommendation herein, or have positions in the securities mentioned herein or options with respect thereto. Any recommendation contained in this report may not be suitable for all investors and it is not to be deemed an offer or solicitation on our part with respect to the purchase or sale of any securities. |
|
 |
Retail, Financial, Tech, Energy, and Defensive Groups Rose
Kenneth J. Gruneisen - Passed the CAN SLIM® Master's Exam
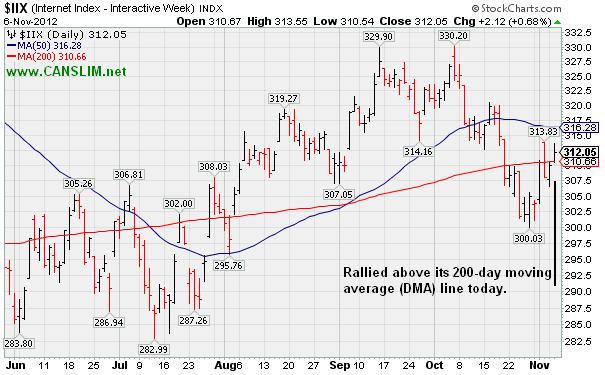
The Retail Index ($RLX +1.07%) rose, and financial shares were also a positive influence on the major averages as the Bank Index ($BKX +1.50%) and Broker/Dealer Index ($XBD +0.82%) ratcheted higher. The Semiconductor Index ($SOX +1.38%) led the tech sector higher while the Networking Index ($NWX +0.65%), Biotechnology Index ($BTK +0.66%), and the Internet Index ($IIX +0.68%) each tallied modest gains. Strength in energy-related shares boosted the Integrated Oil Index ($XOI +1.76%) and the Oil Services Index ($OSX +0.74%). Defensive groups also gained ground as the Gold & Silver Index ($XAU +1.72%) outpaced the Healthcare Index ($HMO +0.72%) group on the widely positive session.
Charts courtesy www.stockcharts.com
PICTURED: The
| Oil Services |
$OSX |
220.80 |
+1.63 |
+0.74% |
+2.09% |
| Healthcare |
$HMO |
2,526.19 |
+18.11 |
+0.72% |
+10.72% |
| Integrated Oil |
$XOI |
1,254.89 |
+21.75 |
+1.76% |
+2.10% |
| Semiconductor |
$SOX |
383.62 |
+5.24 |
+1.38% |
+5.26% |
| Networking |
$NWX |
201.05 |
+1.30 |
+0.65% |
-6.56% |
| Internet |
$IIX |
312.05 |
+2.12 |
+0.68% |
+10.76% |
| Broker/Dealer |
$XBD |
87.37 |
+0.71 |
+0.82% |
+4.93% |
| Retail |
$RLX |
656.79 |
+6.93 |
+1.07% |
+25.53% |
| Gold & Silver |
$XAU |
180.83 |
+3.05 |
+1.72% |
+0.11% |
| Bank |
$BKX |
50.70 |
+0.75 |
+1.50% |
+28.75% |
| Biotech |
$BTK |
1,464.33 |
+9.67 |
+0.66% |
+34.17% |
|
|
|
 |
Resilient Tech Firm Posted Good Earnings After Close
Kenneth J. Gruneisen - Passed the CAN SLIM® Master's Exam
Often, when a leading stock is setting up with a solid base it is highlighted in CANSLIM.net's Mid-Day Breakouts Report. The most relevant factors are noted in the report which alerts prudent CANSLIM oriented investors. After doing any necessary backup research, the investor is prepared to act after the stock triggers a technical buy signal (breaks above its pivot point on more than +50% average turnover) but before it gets too extended from a sound base. Disciplined investors know to buy as near as possible to the pivot point and avoid chasing stocks after they have rallied more than +5% above their pivot point. It is crucial to always limit losses whenever any stock heads the wrong direction, and disciplined investors sell if a struggling stock ever falls more than -7% from their purchase price. In the event the stock fails to trigger a technical buy signal no harm is done, and it would simply be dropped from investors' watchlists.
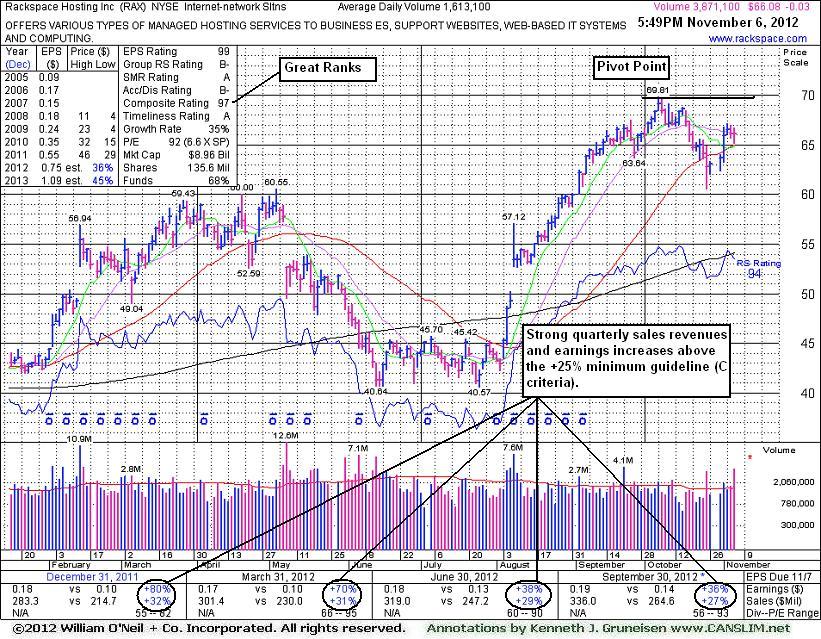
Rackspace Hosting Inc (RAX -$0.03 or -0.05% to $66.08) was highlighted in yellow with new pivot point cited based on its 10/05/12 high plus 10 cents in the mid-day report (read here) as it was noted - "A volume-driven gain above its pivot point may trigger a new technical buy signal. Found support near prior highs in the $60 area recently after briefly undercutting its 50 DMA line. Fundamentals (C and A criteria) remain strong. A recent streak of 10 consecutive weekly gains helped it rebound impressively from below its 200 DMA line following a deep consolidation since dropped from the Featured Stocks list on 5/14/12. " After the close it reported earnings +36% on +27% sales revenues for the quarter ended September 30, 2012 versus the year ago period. Volume and volatility often increase near earnings news.
Its last appearance in this FSU section was on 4/10/12 with an annotated graph under the headline, "Consolidating Above 50-Day Moving Average Line ". Damaging losses afterward had triggered technical sell signals, however it eventually rebounded and strength returned allowing it to rally back into new high territory. The past 11 quarterly earnings comparisons through September '12 have shown better than +25% increases. Its annual earnings history (A criteria) since trading began in 2008 has been good. Increasing institutional ownership (I criteria) is a reassuring sign, as the number of top-rated funds owning its shares rose from 408 in Dec '10 to 609 in Sep '12. Keep in mind that currently the M criteria is an overriding concern, until at least one of the major averages produces a solid follow-through day confirming a new rally for the broader market.
|
|
|
Color Codes Explained :
Y - Better candidates highlighted by our
staff of experts.
G - Previously featured
in past reports as yellow but may no longer be buyable under the
guidelines.
***Last / Change / Volume data in this table is the closing quote data***
Symbol/Exchange
Company Name
Industry Group |
PRICE |
CHANGE
(%Change) |
Day High |
Volume
(% DAV)
(% 50 day avg vol) |
52 Wk Hi
% From Hi |
Featured
Date |
Price
Featured |
Pivot Featured |
|
Max Buy |
ASPS
-
NASDAQ
Altisource Ptf Sltns Sa
REAL ESTATE - Property Management/Developmen
|
$106.60
|
-1.03
-0.96% |
$108.58
|
186,689
87.61% of 50 DAV
50 DAV is 213,100
|
$129.72
-17.82%
|
9/24/2012
|
$87.24
|
PP = $92.39
|
|
MB = $97.01
|
Most Recent Note - 11/5/2012 10:50:31 AM
G - Down considerably today with volume running at an above average pace while slumping near important support at its 50 DMA line.
>>> The latest Featured Stock Update with an annotated graph appeared on 10/12/2012. Click here.
View all notes |
Alert me of new notes |
CANSLIM.net Company Profile |
SEC |
Zacks Reports |
StockTalk |
News |
Chart |
Request a new note
C
A N
S L
I M


|
BRLI
-
NASDAQ
Bio Reference Labs Inc
HEALTH SERVICES - Medical Laboratories and Researc
|
$29.14
|
+0.32
1.11% |
$29.24
|
172,459
50.06% of 50 DAV
50 DAV is 344,500
|
$32.86
-11.32%
|
10/3/2012
|
$30.90
|
PP = $30.25
|
|
MB = $31.76
|
Most Recent Note - 11/5/2012 5:43:16 PM
G - Rose near its 50 DMA line today which may now act as a resistance level after damaging distributional action in recent weeks.
>>> The latest Featured Stock Update with an annotated graph appeared on 10/8/2012. Click here.
View all notes |
Alert me of new notes |
CANSLIM.net Company Profile |
SEC |
Zacks Reports |
StockTalk |
News |
Chart |
Request a new note
C
A N
S L
I M
|
CFNL
-
NASDAQ
Cardinal Financial Corp
BANKING - Regional - Southeast Banks
|
$16.11
|
+0.21
1.32% |
$16.21
|
242,443
209.00% of 50 DAV
50 DAV is 116,000
|
$16.09
0.12%
|
8/17/2012
|
$12.84
|
PP = $13.31
|
|
MB = $13.98
|
 Most Recent Note - 11/6/2012 11:57:20 AM
G - Touched a new 52-week high today. Recently held its ground stubbornly while enduring some distributional pressure after getting extended from its prior base. Prior high ($14.79 on 9/24/12) defines initial support to watch above its 50 DMA line on pullbacks.
>>> The latest Featured Stock Update with an annotated graph appeared on 10/25/2012. Click here.
View all notes |
Alert me of new notes |
CANSLIM.net Company Profile |
SEC |
Zacks Reports |
StockTalk |
News |
Chart |
Request a new note
C
A N
S L
I M
|
CMCSA
-
NASDAQ
Comcast Corp Cl A
MEDIA - CATV Systems
|
$37.17
|
-0.26
-0.69% |
$37.50
|
13,631,688
110.37% of 50 DAV
50 DAV is 12,350,900
|
$37.96
-2.08%
|
6/11/2012
|
$29.94
|
PP = $30.98
|
|
MB = $32.53
|
Most Recent Note - 11/1/2012 6:15:21 PM
G - Touched another new 52-week high today. Reported earnings +39% on +15% sales revenues for the Sep '12 quarter, a reassuring follow-up to the previously noted sub par quarter. Upward trendline and 50 DMA line define near term support where violations would trigger technical sell signals.
>>> The latest Featured Stock Update with an annotated graph appeared on 10/24/2012. Click here.
View all notes |
Alert me of new notes |
CANSLIM.net Company Profile |
SEC |
Zacks Reports |
StockTalk |
News |
Chart |
Request a new note
C
A N
S L
I M
|
DVA
-
NYSE
Davita Healthcare Prtns
HEALTH SERVICES - Specialized Health Services
|
$114.98
|
+3.36
3.01% |
$116.50
|
1,255,784
155.82% of 50 DAV
50 DAV is 805,900
|
$114.85
0.11%
|
9/5/2012
|
$102.92
|
PP = $100.62
|
|
MB = $105.65
|
Most Recent Note - 11/6/2012 1:03:29 PM
G - Hitting another new 52-week high today with volume running at an above average pace while getting more extended from its latest sound base. Prior highs near $100 and its 50 DMA line define near-term support to watch on pullbacks where violations may trigger technical sell signals. Fundamental concerns were raised after it reported earnings +3% on +12% sales for the Sep '12 quarter, below the guidelines of the fact-based system.
>>> The latest Featured Stock Update with an annotated graph appeared on 10/10/2012. Click here.
View all notes |
Alert me of new notes |
CANSLIM.net Company Profile |
SEC |
Zacks Reports |
StockTalk |
News |
Chart |
Request a new note
C
A N
S L
I M
|
Symbol/Exchange
Company Name
Industry Group |
PRICE |
CHANGE
(%Change) |
Day High |
Volume
(% DAV)
(% 50 day avg vol) |
52 Wk Hi
% From Hi |
Featured
Date |
Price
Featured |
Pivot Featured |
|
Max Buy |
GPX
-
NYSE
G P Strategies Corp
DIVERSIFIED SERVICES - Education and Training Services
|
$20.83
|
+1.12
5.68% |
$20.93
|
106,659
185.82% of 50 DAV
50 DAV is 57,400
|
$20.67
0.77%
|
10/8/2012
|
$20.00
|
PP = $20.77
|
|
MB = $21.81
|
Most Recent Note - 11/6/2012 4:19:43 PM
G - Today's 4th consecutive gain with above average volume helped it hit a new 52-week high. Recently reported earnings +0% on +12% sales revenues for the Sep '12 quarter, below the +25% minimum earnings guideline, raising fundamental concerns.
>>> The latest Featured Stock Update with an annotated graph appeared on 10/16/2012. Click here.
View all notes |
Alert me of new notes |
CANSLIM.net Company Profile |
SEC |
Zacks Reports |
StockTalk |
News |
Chart |
Request a new note
C
A N
S L
I M
|
LKQ
-
NASDAQ
L K Q Corp
WHOLESALE - Auto Parts
|
$21.82
|
+0.55
2.59% |
$21.85
|
1,566,842
98.69% of 50 DAV
50 DAV is 1,587,700
|
$21.95
-0.59%
|
8/9/2012
|
$18.97
|
PP = $18.72
|
|
MB = $19.66
|
Most Recent Note - 11/6/2012 4:21:45 PM
G - Rallied with near average volume today for best-ever close. No resistance remains due to overhead supply. Showed impressive resilience and strength after reporting earnings +6% on +30% sales revenues for the Sep '12 quarter. Results below the +25% minimum earnings guideline (C criteria) raised fundamental concerns.
>>> The latest Featured Stock Update with an annotated graph appeared on 10/19/2012. Click here.
View all notes |
Alert me of new notes |
CANSLIM.net Company Profile |
SEC |
Zacks Reports |
StockTalk |
News |
Chart |
Request a new note
C
A N
S L
I M
|
MIDD
-
NASDAQ
Middleby Corp
MANUFACTURING - Diversified Machinery
|
$120.40
|
+0.67
0.56% |
$123.70
|
142,072
182.61% of 50 DAV
50 DAV is 77,800
|
$127.89
-5.86%
|
10/8/2012
|
$118.46
|
PP = $122.67
|
|
MB = $128.80
|
Most Recent Note - 11/5/2012 5:36:45 PM
Y - Retreating abruptly from its 52-week high with above average volume behind today's damaging loss as it sank below its pivot point toward its 50 DMA line raising concerns. The M criteria remains an overriding concern until a FTD confirms a new rally. Company will release 2012 third quarter earnings on Tuesday, November 6 after the market closes.
>>> The latest Featured Stock Update with an annotated graph appeared on 10/22/2012. Click here.
View all notes |
Alert me of new notes |
CANSLIM.net Company Profile |
SEC |
Zacks Reports |
StockTalk |
News |
Chart |
Request a new note
C
A N
S L
I M
|
N
-
NYSE
Netsuite Inc
DIVERSIFIED SERVICES - Business/Management Services
|
$62.89
|
-0.05
-0.08% |
$63.98
|
332,863
64.38% of 50 DAV
50 DAV is 517,000
|
$67.02
-6.16%
|
8/20/2012
|
$55.88
|
PP = $59.32
|
|
MB = $62.29
|
Most Recent Note - 11/6/2012 1:04:46 PM
G - Reported earnings +60% on +31% sales revenues for the Sep '12 quarter. Consolidating since a considerable 10/26/12 gap up and volume-driven gain from below its 50 DMA line for new 52-week and all-time highs. It did not form a sound new base pattern. Until the major averages are back in a confirmed rally the M criteria argues against any new buying efforts.
>>> The latest Featured Stock Update with an annotated graph appeared on 10/26/2012. Click here.
View all notes |
Alert me of new notes |
CANSLIM.net Company Profile |
SEC |
Zacks Reports |
StockTalk |
News |
Chart |
Request a new note
C
A N
S L
I M
|
NSM
-
NYSE
Nationstar Mtg Hldgs Inc
FINANCIAL SERVICES - Credit Services
|
$27.11
|
-3.09
-10.23% |
$29.57
|
4,768,928
295.14% of 50 DAV
50 DAV is 1,615,800
|
$37.20
-27.12%
|
8/29/2012
|
$27.96
|
PP = $28.85
|
|
MB = $30.29
|
Most Recent Note - 11/6/2012 10:21:54 AM
It faces overhead supply up through the $37 area that may now act as resistance, and based on weak action it will be dropped from the Featured Stocks list tonight. It gapped down today following a violation of its 50 DMA line with a damaging loss on the prior session noted as - "Worrisome action indicative of more distributional pressure."
>>> The latest Featured Stock Update with an annotated graph appeared on 10/11/2012. Click here.
View all notes |
Alert me of new notes |
CANSLIM.net Company Profile |
SEC |
Zacks Reports |
StockTalk |
News |
Chart |
Request a new note
C
A N
S L
I M
|
Symbol/Exchange
Company Name
Industry Group |
PRICE |
CHANGE
(%Change) |
Day High |
Volume
(% DAV)
(% 50 day avg vol) |
52 Wk Hi
% From Hi |
Featured
Date |
Price
Featured |
Pivot Featured |
|
Max Buy |
OSIS
-
NASDAQ
O S I Systems Inc
ELECTRONICS - Semiconductor Equipment and Mate
|
$80.50
|
+1.02
1.28% |
$80.94
|
54,276
47.86% of 50 DAV
50 DAV is 113,400
|
$81.23
-0.90%
|
9/5/2012
|
$74.39
|
PP = $75.10
|
|
MB = $78.86
|
Most Recent Note - 11/5/2012 4:32:10 PM
G - Posted a gain today on light volume. Recently found prompt support at its 50 DMA line, and it is still slightly extended from its prior base.
>>> The latest Featured Stock Update with an annotated graph appeared on 10/18/2012. Click here.
View all notes |
Alert me of new notes |
CANSLIM.net Company Profile |
SEC |
Zacks Reports |
StockTalk |
News |
Chart |
Request a new note
C
A N
S L
I M
|
RAX
-
NYSE
Rackspace Hosting Inc
INTERNET - Internet Software and; Services
|
$66.08
|
-0.03
-0.05% |
$66.75
|
3,936,756
244.05% of 50 DAV
50 DAV is 1,613,100
|
$69.81
-5.34%
|
11/6/2012
|
$65.44
|
PP = $69.91
|
|
MB = $73.41
|
Most Recent Note - 11/6/2012 12:42:01 PM
Y - Due to report earnings after the close today. Volume and volatility often increase near earnings news. Color code is changed to yellow with new pivot point cited based on its 10/05/12 high plus 10 cents. A volume-driven gain above its pivot point may trigger a new technical buy signal. Found support near prior highs in the $60 area recently after briefly undercutting its 50 DMA line. Fundamentals (C and A criteria) remain strong. A recent streak of 10 consecutive weekly gains helped it rebound impressively from below its 200 DMA line following a deep consolidation since dropped from the Featured Stocks list on 5/14/12.
>>> The latest Featured Stock Update with an annotated graph appeared on 11/6/2012. Click here.
View all notes |
Alert me of new notes |
CANSLIM.net Company Profile |
SEC |
Zacks Reports |
StockTalk |
News |
Chart |
Request a new note
C
A N
S L
I M
|
RNF
-
NYSE
Rentech Nitrogen Ptnr Lp
CHEMICALS - Agricultural Chemicals
|
$39.15
|
+0.55
1.42% |
$39.63
|
265,950
69.66% of 50 DAV
50 DAV is 381,800
|
$41.15
-4.86%
|
11/1/2012
|
$39.11
|
PP = $40.15
|
|
MB = $42.16
|
Most Recent Note - 11/2/2012 5:48:08 PM
Y - Touched a new 52-week high today, but a "negative reversal" led to a loss with above average volume which broke a streak of 5 consecutive gains. See the latest FSU analysis for more details and a new annotated graph.
>>> The latest Featured Stock Update with an annotated graph appeared on 11/2/2012. Click here.
View all notes |
Alert me of new notes |
CANSLIM.net Company Profile |
SEC |
Zacks Reports |
StockTalk |
News |
Chart |
Request a new note
C
A N
S L
I M
|
TDG
-
NYSE
Transdigm Group Inc
AEROSPACE/DEFENSE - Aerospace/Defense Products and; Services
|
$140.12
|
+3.30
2.41% |
$140.49
|
251,321
49.47% of 50 DAV
50 DAV is 508,000
|
$139.31
0.58%
|
8/16/2012
|
$132.23
|
PP = $136.44
|
|
MB = $143.26
|
Most Recent Note - 11/6/2012 4:28:00 PM
G - Hit a new high (following a 10/23/12 special dividend) with today's gain on light volume. When noted on 10/23/12 it undercut its 50 DMA line, yet it promptly rebounded back above that important short-term average.
>>> The latest Featured Stock Update with an annotated graph appeared on 10/23/2012. Click here.
View all notes |
Alert me of new notes |
CANSLIM.net Company Profile |
SEC |
Zacks Reports |
StockTalk |
News |
Chart |
Request a new note
C
A N
S L
I M
|
ULTA
-
NASDAQ
Ulta Salon Cosm & Frag
SPECIALTY RETAIL - Specialty Retail, Other
|
$94.06
|
+1.38
1.49% |
$94.11
|
557,840
77.65% of 50 DAV
50 DAV is 718,400
|
$103.52
-9.14%
|
9/4/2012
|
$93.17
|
PP = $98.52
|
|
MB = $103.45
|
Most Recent Note - 11/5/2012 4:55:59 PM
G - Its 200 DMA line defines near-term support to watch while its waning Relative Strength Rating has raised concerns. See the latest FSU analysis for more details and a new annotated graph.
>>> The latest Featured Stock Update with an annotated graph appeared on 11/5/2012. Click here.
View all notes |
Alert me of new notes |
CANSLIM.net Company Profile |
SEC |
Zacks Reports |
StockTalk |
News |
Chart |
Request a new note
C
A N
S L
I M
|
Symbol/Exchange
Company Name
Industry Group |
PRICE |
CHANGE
(%Change) |
Day High |
Volume
(% DAV)
(% 50 day avg vol) |
52 Wk Hi
% From Hi |
Featured
Date |
Price
Featured |
Pivot Featured |
|
Max Buy |
ULTI
-
NASDAQ
Ultimate Software Group
INTERNET - Internet Software and Services
|
$94.50
|
-1.23
-1.28% |
$96.50
|
100,803
63.20% of 50 DAV
50 DAV is 159,500
|
$106.40
-11.18%
|
10/31/2012
|
$101.36
|
PP = $105.00
|
|
MB = $110.25
|
Most Recent Note - 11/1/2012 6:00:55 PM
G - Gapped down today and erased the prior session's gain, raising concerns while violating its 50 DMA line with a damaging loss on above average volume. Reported earnings +61% on +22% sales revenues for the Sep '12 quarter. Color code is changed to green, and a rebound above its 50 DMA is needed to improve its technical stance. Still building on a 9-week "double bottom" base pattern. See latest FSU analysis for more details and a new annotated graph.
>>> The latest Featured Stock Update with an annotated graph appeared on 10/31/2012. Click here.
View all notes |
Alert me of new notes |
CANSLIM.net Company Profile |
SEC |
Zacks Reports |
StockTalk |
News |
Chart |
Request a new note
C
A N
S L
I M
|
VSI
-
NYSE
Vitamin Shoppe Inc
SPECIALTY RETAIL - Specialty Retail, Other
|
$61.67
|
+8.37
15.70% |
$61.89
|
1,291,792
490.06% of 50 DAV
50 DAV is 263,600
|
$61.83
-0.25%
|
10/15/2012
|
$57.82
|
PP = $60.08
|
|
MB = $63.08
|
Most Recent Note - 11/6/2012 12:57:49 PM
Y - Released better than expected earnings +35% on +14% sales revenues for the Sep '12 quarter before the market open. Gapped up for a considerable gain, rallying back above its 50 DMA line. Color code was changed to yellow while challenging the previously cited pivot point. Keep in mind the M criteria which argues against new buying efforts until the market is back in a confirmed rally.
>>> The latest Featured Stock Update with an annotated graph appeared on 10/15/2012. Click here.
View all notes |
Alert me of new notes |
CANSLIM.net Company Profile |
SEC |
Zacks Reports |
StockTalk |
News |
Chart |
Request a new note
C
A N
S L
I M
|
WPI
-
NYSE
Watson Pharmaceuticals
DRUGS - Drugs - Generic
|
$87.44
|
+0.93
1.08% |
$87.70
|
595,067
64.49% of 50 DAV
50 DAV is 922,700
|
$90.00
-2.84%
|
8/24/2012
|
$82.90
|
PP = $81.10
|
|
MB = $85.16
|
Most Recent Note - 11/1/2012 6:04:27 PM
G - Touched a new 52-week high today, rallying with above average volume after testing support at its 50 DMA line. It has not formed a sound base and it is extended from a proper buy point under the fact-based system's guidelines. See the latest FSU analysis for more details and a new annotated graph.
>>> The latest Featured Stock Update with an annotated graph appeared on 11/1/2012. Click here.
View all notes |
Alert me of new notes |
CANSLIM.net Company Profile |
SEC |
Zacks Reports |
StockTalk |
News |
Chart |
Request a new note
C
A N
S L
I M
|
|
|
|
THESE ARE NOT BUY RECOMMENDATIONS!
Comments contained in the body of this report are technical
opinions only. The material herein has been obtained
from sources believed to be reliable and accurate, however,
its accuracy and completeness cannot be guaranteed.
This site is not an investment advisor, hence it does
not endorse or recommend any securities or other investments.
Any recommendation contained in this report may not
be suitable for all investors and it is not to be deemed
an offer or solicitation on our part with respect to
the purchase or sale of any securities. All trademarks,
service marks and trade names appearing in this report
are the property of their respective owners, and are
likewise used for identification purposes only.
This report is a service available
only to active Paid Premium Members.
You may opt-out of receiving report notifications
at any time. Questions or comments may be submitted
by writing to Premium Membership Services 665 S.E. 10 Street, Suite 201 Deerfield Beach, FL 33441-5634 or by calling 1-800-965-8307
or 954-785-1121.
|
|
|

