You are not logged in.
This means you
CAN ONLY VIEW reports that were published prior to Monday, April 14, 2025.
You
MUST UPGRADE YOUR MEMBERSHIP if you want to see any current reports.
AFTER MARKET UPDATE - FRIDAY, NOVEMBER 6TH, 2009
Previous After Market Report Next After Market Report >>>
|
|
|
|
DOW |
+17.31 |
10,023.27 |
+0.17% |
|
Volume |
1,062,602,550 |
-18% |
|
Volume |
1,856,679,500 |
-18% |
|
NASDAQ |
+7.12 |
2,112.44 |
+0.34% |
|
Advancers |
1,528 |
49% |
|
Advancers |
1,265 |
45% |
|
S&P 500 |
+2.68 |
1,069.31 |
+0.25% |
|
Decliners |
1,455 |
47% |
|
Decliners |
1,444 |
51% |
|
Russell 2000 |
-0.90 |
580.25 |
-0.15% |
|
52 Wk Highs |
93 |
|
|
52 Wk Highs |
69 |
|
|
S&P 600 |
-0.71 |
307.05 |
-0.23% |
|
52 Wk Lows |
7 |
|
|
52 Wk Lows |
16 |
|
|
 |
Light Volume Totals Underscore Market's Half-Hearted New Rally Attempt
Adam Sarhan, Contributing Writer,
The market ended higher on Friday and higher for the week as investors digested the latest round of economic and earnings data. The market remains in a correction which began on October 28, 2009, having just completed Day 5 of its new rally attempt. Advancers narrowly led decliners on the NYSE while the opposite was true on the Nasdaq exchange. There were 30 high-ranked companies from the CANSLIM.net Leaders List making a new 52-week high and appearing on the CANSLIM.net BreakOuts Page, higher than the 20 issue that appeared on the prior session. In terms of new leadership, the recent action has yielded little worth noting, however new 52-week highs are still outnumbering new 52-week lows on the NYSE and Nasdaq exchange.
Stocks closed higher on Monday which marked Day 1 of a new rally attempt. In other news, C I T Group filed for Chapter 11 bankruptcy protection and the ISM factory index rose to 55.7 in October which was the fastest growth rate for that index in 3 years! Elsewhere, the Commerce Department said construction spending unexpectedly rose +0.8% in September which suggested an uptick in spending. The National Association of Realtors said signed purchase agreements for homes grew by +6.1% as the housing market continues to make its way out of the worst housing collapse in several generations!
The market ended mixed on Tuesday which marked day 2 of the current rally attempt. Before Tuesday's open, Warren Buffett announced his plans to buy Burlington Northern Santa Fe Corp. (BNI +0.26%) for a $44 billion cash and stock deal which is his largest buy-out ever. Meanwhile, Stanley Works (SWK -0.87%) said it will take over Black & Decker Corp. (BDK -0.70%) which sent both stocks higher. Buffett said his acquisition was an “all-in wager” on the nation’s economic future. Buffett also said that his purchase was a bet on the US economy and that he was optimistic about the future. In other news, the International Monetary Fund (IMF) reported that it sold 200 metric tons of gold to the Bank of India. This alleviated a major amount of overhead supply and helped send gold futures surging to a fresh all-time high.
Before Wednesday's opening bell, ADP released its monthly employment report and said that US employers slashed -203,000 jobs in October, which was lower than the Street's estimate of a -227,000 decline. Then, at 10:00AM ET, the ISM released its service sector index which at 50.6 signaled growth and was in line with the Street's average forecast. Readings above 50 signal growth and readings below 50 signal contraction. A few hours later, at 2:15PM ET, the Federal Reserve surprised no one when they decided to keep rates steady near historic lows as the economy continues to "recover."
Stocks surged on Thursday well above the critical +1.7% threshold which is needed to produce a proper FTD, but volume, a critical component of institutional demand, was lower than Wednesday's levels which technically prevented the market from producing a proper FTD. Remember, that a proper FTD can occur anytime after Day 3 of a new rally attempt and needs the following three factors to occur: 1.) At least one of the major averages to rally +1.7% or more 2.) Volume needs to be heavier than the prior session and 3.) a new batch of high ranked leaders need to breakout of sound bases. Looking forward, a new FTD could emerge anytime in the next few days or weeks as long as Monday's lows are not breached.
Before Friday's opening bell, the Labor Department said US employers slashed -190,000 jobs in October which was higher than the -175,000 the Street had expected. Meanwhile, the unemployment rate soared to a 26-year high of -10.2% in October which exceeded the average estimate for a 9.9% rate. This was the first time the unemployment rate topped 10% since September of 1983. In addition, Friday's jobs report reiterated the Fed's thoughts that interest rates will remain low until the labor market recovers. The market remains in a technical "correction" until a proper FTD emerges, so the investment system's M criteria argues against new buying efforts.
PICTURED: The S&P 500 Index climbed above its near-term resistance line this week but remains in a "correction" until a new FTD emerges.Looking forward, we will continue to count the days of this rally attempt and wait for one of two events to occur: a.) a proper follow-through day (FTD) will emerge which will change the status of this rally attempt to a "confirmed rally" or b.) Monday's lows will be taken out which means the day count will be reset and this rally attempt will be over.
|
|
|
 |
Retail and Defensive Groups Rise Amid Mixed Action
Kenneth J. Gruneisen - Passed the CAN SLIM® Master's Exam
Group action on Friday was mixed. The Networking Index ($NWX -0.43%) and Semiconductor Index ($SOX -0.40%) ended with small losses while the Internet Index ($IIX +0.27%) and Biotechnology Index ($BTK +0.84%) posted small gains. The Bank Index ($BKX -0.23%) inched lower while the Broker/Dealer Index ($XBD +0.40%) posted a small gain. The Retail Index ($RLX +1.70%) was among the better gainers, and some defensive posturing continued to lift the Healthcare Index ($HMO +1.37%) and the Gold & Silver Index ($XAU +1.83%). Meanwhile, modest weakness in the energy group led to small losses for the Integrated Oil Index ($XOI -0.67%) and Oil Services Index ($OSX -0.58%).
Charts courtesy www.stockcharts.com
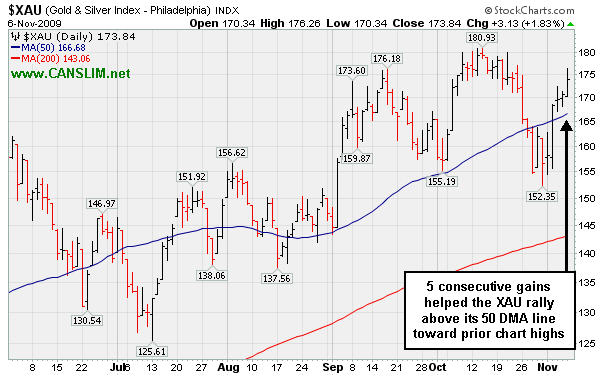
PICTURED: The Gold & Silver Index ($XAU +1.83%) has posted 5 consecutive gains, rallying above its 50-day moving average (DMA) line toward prior chart highs.
| Oil Services |
$OSX |
194.50 |
-1.14 |
-0.58% |
+60.23% |
| Healthcare |
$HMO |
1,275.53 |
+17.23 |
+1.37% |
+32.84% |
| Integrated Oil |
$XOI |
1,082.92 |
-7.30 |
-0.67% |
+10.54% |
| Semiconductor |
$SOX |
301.76 |
-1.20 |
-0.40% |
+42.23% |
| Networking |
$NWX |
224.89 |
-0.98 |
-0.43% |
+56.29% |
| Internet |
$IIX |
219.54 |
+0.60 |
+0.27% |
+64.12% |
| Broker/Dealer |
$XBD |
114.76 |
+0.46 |
+0.40% |
+48.13% |
| Retail |
$RLX |
395.34 |
+6.59 |
+1.70% |
+41.57% |
| Gold & Silver |
$XAU |
173.84 |
+3.13 |
+1.83% |
+40.36% |
| Bank |
$BKX |
42.84 |
-0.10 |
-0.23% |
-3.34% |
| Biotech |
$BTK |
890.55 |
+7.41 |
+0.84% |
+37.61% |
|
|
|
 |
Gain With Higher Volume Brings New All-Time Highs
Kenneth J. Gruneisen - Passed the CAN SLIM® Master's Exam
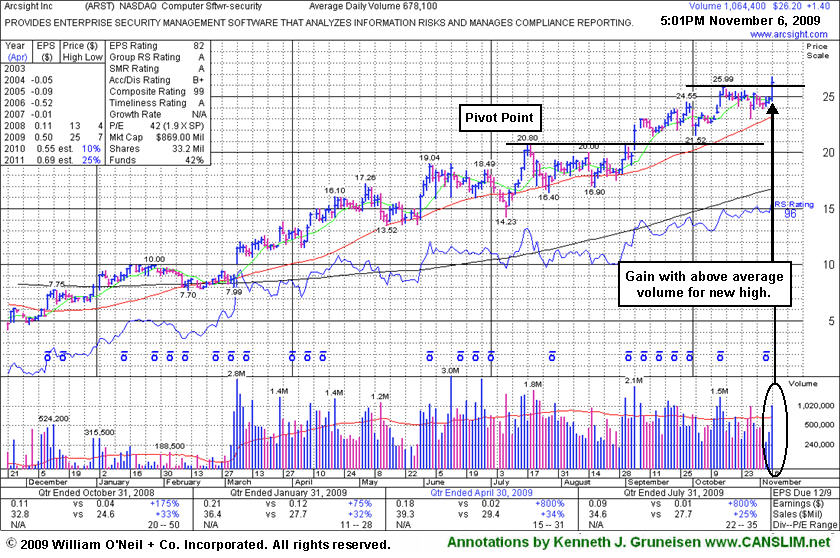
ArcSight, Inc. (ARST +$1.43 or +5.77% to $26.23) rallied today with above average volume to a new all-time high from a short consolidation in a very tight trading range above its 50-day moving average (DMA) line. Its color code remains green while dismissing its 10/15/09 high as a new pivot point, with concern that it is now a later stage breakout without a recent base of substantial length. ARST stubbornly held its ground and it has encountered very little distributional pressure since its 9/04/09 breakout. Its 50 DMA line is an important technical support level to watch on pullbacks.
Keep in mind that ARST was considered a "late-stage" breakout possibility when featured after it had already made a considerable 5-fold rally from its November '08 low. ARST was first featured in yellow at $19.91 in the 9/01/09 mid-day report with an annotated daily graph (read here) and it was also featured with more detailed analysis in the September 2009 CANSLIM.net News with an annotated weekly graph (read here).
|
|
|
Color Codes Explained :
Y - Better candidates highlighted by our
staff of experts.
G - Previously featured
in past reports as yellow but may no longer be buyable under the
guidelines.
***Last / Change / Volume quote data in this table corresponds with the timestamp on the note***
Symbol/Exchange
Company Name
Industry Group |
Last |
Chg. |
Vol
% DAV |
Date Featured |
Price Featured |
Latest Pivot Point
Featured |
Status |
| Latest Max Buy Price |
ARST
-
|
$26.23
|
+1.43
|
1,082,556
161% DAV
670,900
|
9/1/2009
(Date
Featured) |
$19.91
(Price
Featured) |
PP = $20.90 |
G |
| MB = $21.95 |
Most Recent Note - 11/6/2009 4:52:29 PM
G - Rallied today with above average volume to a new 52-week and all-time high from a short consolidation in a very tight trading range above its 50 DMA line. Color code remains green while dismissing its 10/15/09 high as a new pivot point, with concern it is now a late stage breakout without a recent base of substantial length. ARST was first featured in yellow at $19.91 in the 9/01/09 mid-day report with an annotated daily graph (read here).
>>> The latest Featured Stock Update with an annotated graph appeared on 11/6/2009. click here.
|
|
C
A
S
I |
News |
Chart |
SEC
View all notes Alert
me of new notes
Company
Profile
|
ASIA
-
|
$23.43
|
-0.03
|
1,180,900
147% DAV
805,700
|
10/14/2009
(Date
Featured) |
$23.05
(Price
Featured) |
PP = $22.19 |
Y |
| MB = $23.30 |
Most Recent Note - 11/6/2009 4:54:20 PM
Y - Gains earlier today helped it touch new high territory, but it reversed to close in then lower half of its intra-day range with a small loss. Still consolidating after a big 10/29/09 gap up on solid earnings and raised guidance. It found prompt support near its 50 DMA line (a textbook chart support level) after a 7 session losing streak with losses on high volume briefly negated its latest breakout. Market conditions (M criteria) are a concern until a new follow-through-day occurs with more leadership. Featured 10/14/09 in the mid-day report (read here) as it gapped up for a new 52-week high with 5 times average volume, triggering a technical buy signal by blasting above its pivot point. First featured in the August 2009 CANSLIM.net News (read here).
>>> The latest Featured Stock Update with an annotated graph appeared on 10/30/2009. click here.
|
|
C
A
S
I |
News |
Chart |
SEC
View all notes Alert
me of new notes
Company
Profile
|
BIDU
- NASDAQ
Baidu Inc Ads
INTERNET - Internet Information Providers
|
$409.74
|
+13.51
|
2,591,294
134% DAV
1,932,400
|
9/8/2009
(Date
Featured) |
$351.80
(Price
Featured) |
PP = $368.59 |
G |
| MB = $387.02 |
Most Recent Note - 11/6/2009 4:55:54 PM
G - Four consecutive gains on ever-increasing but mostly light volume helped it quietly rise back above its 50 DMA line this week. Volume spiked to 5 times normal on 10/27/09 as it gapped down for a considerable loss following its latest earnings report. As recently noted, "Choppy action has not allowed it to form a sound base in recent weeks." BIDU traded up as much as +23% from its price when featured in yellow in the 9/08/09 Mid-Day BreakOuts Report (read here).
>>> The latest Featured Stock Update with an annotated graph appeared on 10/28/2009. click here.
|
|
C
A
S
I |
News |
Chart |
SEC
View all notes Alert
me of new notes
Company
Profile
|
CACC
- NASDAQ
Credit Acceptance Corp
FINANCIAL SERVICES - Credit Services
|
$34.13
|
+0.13
|
11,344
30% DAV
38,200
|
9/29/2009
(Date
Featured) |
$33.48
(Price
Featured) |
PP = $32.60 |
G |
| MB = $34.23 |
Most Recent Note - 11/6/2009 4:57:36 PM
G - Consolidating in an orderly fashion above prior chart highs and its 50 DMA line in the $32 area, an important level to watch on pullbacks. The Finance - Consumer/Commercial Loans firm has maintained a great track record of annual and quarterly sales revenues and earnings increases. It was featured on 9/29/09 in yellow in the mid-day report (read here).
>>> The latest Featured Stock Update with an annotated graph appeared on 11/5/2009. click here.
|
|
C
A
S
I |
News |
Chart |
SEC
View all notes Alert
me of new notes
Company
Profile
|
CRM
- NYSE
Salesforce.com Inc
INTERNET - Internet Software & Services
|
$61.01
|
+0.38
|
1,085,701
54% DAV
2,012,800
|
8/16/2009
(Date
Featured) |
$47.12
(Price
Featured) |
PP = $45.59 |
G |
| MB = $47.87 |
Most Recent Note - 11/6/2009 4:59:27 PM
G - Gains each day this week on quiet volume helped it find support and rally up from its 50 DMA line. Deterioration last week led to technical sell signals as it briefly violated its 50 DMA line, prior chart highs in the $59 area, and an upward trendline. Deterioration under its recent chart lows in the $56 area would raise more serious concerns and trigger more worrisome technical sell signals.
>>> The latest Featured Stock Update with an annotated graph appeared on 10/27/2009. click here.
|
|
C
A
S
I |
News |
Chart |
SEC
View all notes Alert
me of new notes
Company
Profile
|
GMCR
- NASDAQ
Green Mtn Coffee Roastrs
FOOD & BEVERAGE - Processed & Packaged Goods
|
$67.61
|
-0.43
|
623,443
51% DAV
1,213,500
|
10/5/2009
(Date
Featured) |
$71.11
(Price
Featured) |
PP = $75.89 |
G |
| MB = $79.68 |
Most Recent Note - 11/6/2009 5:00:46 PM
G - Quietly hovering all week near its 50 DMA line ($67.50) which was previously noted as an important support level to watch. Technically, it has also been hovering the past few sessions near an upward trendline connecting its March-September lows. Further deterioration under recent lows near $65 would raise more serious concerns that its previously strong uptrend has gone cold.
>>> The latest Featured Stock Update with an annotated graph appeared on 10/29/2009. click here.
|
|
C
A
S
I |
News |
Chart |
SEC
View all notes Alert
me of new notes
Company
Profile
|
|
|
|
THESE ARE NOT BUY RECOMMENDATIONS!
Comments contained in the body of this report are technical
opinions only. The material herein has been obtained
from sources believed to be reliable and accurate, however,
its accuracy and completeness cannot be guaranteed.
This site is not an investment advisor, hence it does
not endorse or recommend any securities or other investments.
Any recommendation contained in this report may not
be suitable for all investors and it is not to be deemed
an offer or solicitation on our part with respect to
the purchase or sale of any securities. All trademarks,
service marks and trade names appearing in this report
are the property of their respective owners, and are
likewise used for identification purposes only.
This report is a service available
only to active Paid Premium Members.
You may opt-out of receiving report notifications
at any time. Questions or comments may be submitted
by writing to Premium Membership Services 665 S.E. 10 Street, Suite 201 Deerfield Beach, FL 33441-5634 or by calling 1-800-965-8307
or 954-785-1121.
|
|
|


