You are not logged in.
This means you
CAN ONLY VIEW reports that were published prior to Monday, February 26, 2024.
You
MUST UPGRADE YOUR MEMBERSHIP if you want to see any current reports.
AFTER MARKET UPDATE - THURSDAY, NOVEMBER 5TH, 2020
Previous After Market Report Next After Market Report >>>
|
|
|
|
DOW |
+542.52 |
28,390.18 |
+1.95% |
|
Volume |
927,770,411 |
-7% |
|
Volume |
3,803,140,100 |
+6% |
|
NASDAQ |
+304.03 |
11,894.81 |
+2.62% |
|
Advancers |
2,424 |
80% |
|
Advancers |
2,610 |
76% |
|
S&P 500 |
-28.79 |
3,467.31 |
-0.82% |
|
Decliners |
593 |
20% |
|
Decliners |
803 |
24% |
|
Russell 2000 |
+44.96 |
1,660.05 |
+2.78% |
|
52 Wk Highs |
160 |
|
|
52 Wk Highs |
238 |
|
|
S&P 600 |
+25.40 |
934.94 |
+2.79% |
|
52 Wk Lows |
17 |
|
|
52 Wk Lows |
26 |
|
|
 |
Major Indices Rally With Even Greater Leadership
Kenneth J. Gruneisen - Passed the CAN SLIM® Master's Exam
The S&P 500’s nearly 2% advance puts the index on pace for its best weekly performance since April. The Dow added 542 points, while the Nasdaq Composite rallied 2.6%. The reported volume totals were mixed, lighter than the prior session on the NYSE and higher on the Nasdaq exchange. Breadth was clearly positive as advancers led decliners by a 4-1 margin on the NYSE and more than 3-1 on the Nasdaq exchange. There were 117 high-ranked companies from the Leaders List that hit new 52-week highs and were listed on the BreakOuts Page, versus the total of 78 on the prior session. The new 52-week highs totals expanded and outnumbered new 52-week lows on the NYSE and on the Nasdaq exchange. The major indices have confirmed a new uptrend (M criteria) with a solid follow-through day of gains backed by higher volume and more leadership. Investors are reminded to always make buying and selling decisions based based on the strict criteria and rules of the fact-based investment system. 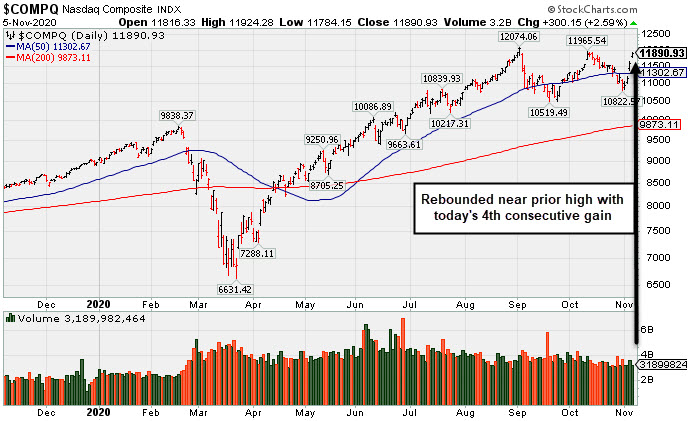 PICTURED: The Nasdaq Composite Index has rebounded above its 50-day moving average (DMA) line and near the prior high after finding support above the September low.
Stocks ended firmly higher on Thursday, with all three U.S. equity benchmarks extending their post-Election Day rally. Investors continued to monitor incoming vote tallies from key battleground states, as the outcome of the presidential election still hung in a balance. Analysts attributed much of today’s optimism to projections that showed Congress would remain split, since a divided legislature would increase the likelihood of leaving a favorable corporate tax and regulatory environment in place.
Ten of 11 S&P 500 sectors finished in positive territory, with Materials pacing the gains. Technology stocks also outperformed, with Qualcomm’s (QCOM +12.75%) surge following an earnings beat providing a tailwind to chipmakers. In other earnings, General Motors (GM +5.39%) rose after more than doubling Wall Street’s earnings expectations and topping revenue estimates amid better-than-anticipated demand for its trucks. Expedia (EXPE +4.67%) after reporting a smaller-than-expected quarterly loss.
On the data front, initial jobless claims declined less than expected to 751,000 in the latest week from the prior upwardly revised 758,000 reading. In central bank news, the conclusion of the Federal Open Market Committee came largely as expected with committee members not making any changes to the Fed’s rate policy and forward guidance. During the post-meeting conference, Fed Chair Jerome Powell noted that the rise in coronavirus cases remains concerning, and called on Washington to provide fiscal stimulus. Treasuries were little changed, with the yield on the 10-year note holding steady at 0.77%. |
 Kenneth J. Gruneisen started out as a licensed stockbroker in August 1987, a couple of months prior to the historic stock market crash that took the Dow Jones Industrial Average down -22.6% in a single day. He has published daily fact-based fundamental and technical analysis on high-ranked stocks online for two decades. Through FACTBASEDINVESTING.COM, Kenneth provides educational articles, news, market commentary, and other information regarding proven investment systems that work in good times and bad.
Comments contained in the body of this report are technical opinions only and are not necessarily those of Gruneisen Growth Corp. The material herein has been obtained from sources believed to be reliable and accurate, however, its accuracy and completeness cannot be guaranteed. Our firm, employees, and customers may effect transactions, including transactions contrary to any recommendation herein, or have positions in the securities mentioned herein or options with respect thereto. Any recommendation contained in this report may not be suitable for all investors and it is not to be deemed an offer or solicitation on our part with respect to the purchase or sale of any securities. |
|
 |
Financial, Retail, Semi, Networking, and Gold & Silver Indexes Rose
Kenneth J. Gruneisen - Passed the CAN SLIM® Master's Exam
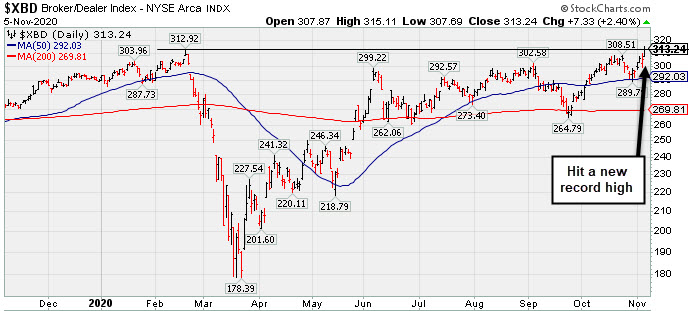
The Bank Index ($BKX +4.12%), Broker/Dealer Index ($XBD +2.40%), and Retail Index ($RLX +2.07%) notched big gains that had a positive influence on the major indices. The Semiconductor Index ($SOX +4.44%) and Networking Index ($NWX +3.66%) posted solid gains while the Biotech Index ($BTK -0.59%) edged lower. The Gold & Silver Index ($XAU +7.50%) posted a standout gain while the Oil Services Index ($OSX +0.66%) inched higher and the Integrated Oil Index ($XOI +0.04%) finished flat.
PICTURED: The Broker/Dealer Index ($XBD +2.40%) has rallied to a new record high. It found support at its 200-day moving average (DMA) line in September and tested its 50 DMA line during its consolidation in October.
| Oil Services |
$OSX |
29.55 |
+0.19 |
+0.66% |
-62.25% |
| Integrated Oil |
$XOI |
587.68 |
+0.23 |
+0.04% |
-53.75% |
| Semiconductor |
$SOX |
2,490.13 |
+105.91 |
+4.44% |
+34.63% |
| Networking |
$NWX |
574.80 |
+20.31 |
+3.66% |
-1.48% |
| Broker/Dealer |
$XBD |
313.24 |
+7.33 |
+2.40% |
+7.87% |
| Retail |
$RLX |
3,550.43 |
+71.91 |
+2.07% |
+44.96% |
| Gold & Silver |
$XAU |
154.16 |
+10.75 |
+7.50% |
+44.18% |
| Bank |
$BKX |
80.17 |
+3.17 |
+4.12% |
-29.28% |
| Biotech |
$BTK |
5,586.72 |
-33.34 |
-0.59% |
+10.25% |
|
|
|
 |
Finished Strong After Breakout Gain Was Noted in Mid-Day Report
Kenneth J. Gruneisen - Passed the CAN SLIM® Master's Exam
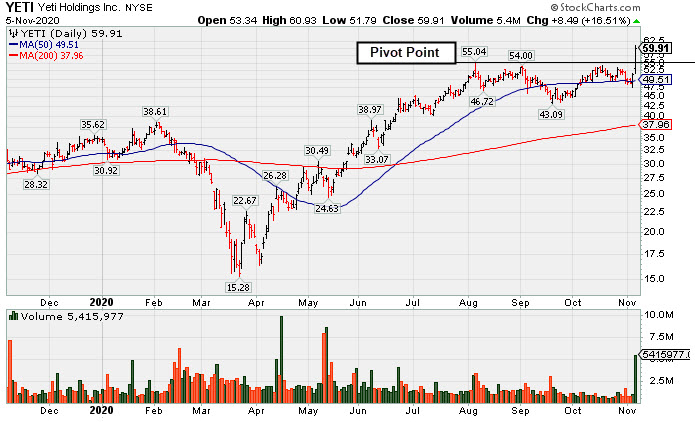
Yeti Holdings Inc (YETI +$8.49 or +16.51% to $59.91) finished strong after highlighted in yellow with pivot point cited based on its 8/06/20 high plus 10 cents in the earlier mid-day report (read here). It powered to a new all-time high (N criteria) with today's big volume-driven gain clearing an orderly base and triggering a technical buy signal. Volume was +390% above average behind he gain, indicative of heavy institutional buying demand, but it quickly got extended from the prior high. Disciplined investors avoid chasing stocks more than +5% above their pivot point.
Bullish action came after it reported earnings +126% on +29% sales revenues for the Sep '20 quarter versus the year ago period, its 5th consecutive quarterly earnings increase above the +25% minimum earnings guideline (C criteria) of the fact-based investment system. Its limited annual earnings (A criteria) history was previously noted as a concern.
It hails from the Leisure-Products group which currently has an A (90) Group Relative Strength rating (L criteria). There is a small supply of only 87 million shares outstanding (S criteria). The number of top-rated funds owning its shares rose from 310 in Dec '19 to 480 in Sep '20, a reassuring sign concerning the I criteria. Completed Secondary Offerings on 5/12/20, 2/20/20, 11/08/19 and 5/08/19 after its $18 IPO on 10/25/18.
|
|
|
Color Codes Explained :
Y - Better candidates highlighted by our
staff of experts.
G - Previously featured
in past reports as yellow but may no longer be buyable under the
guidelines.
***Last / Change / Volume data in this table is the closing quote data***
Symbol/Exchange
Company Name
Industry Group |
PRICE |
CHANGE
(%Change) |
Day High |
Volume
(% DAV)
(% 50 day avg vol) |
52 Wk Hi
% From Hi |
Featured
Date |
Price
Featured |
Pivot Featured |
|
Max Buy |
 CRL
-
NYSE
CRL
-
NYSE
Charles River Labs Intl
DRUGS - Biotechnology
|
$251.58
|
+2.31
0.93% |
$254.45
|
370,385
111.23% of 50 DAV
50 DAV is 333,000
|
$250.29
0.52%
|
7/15/2020
|
$192.66
|
PP = $189.95
|
|
MB = $199.45
|
Most Recent Note - 11/4/2020 5:16:38 PM
G - Hit a new all-time high with today's big volume-driven gain. Found prompt support near its 50 DMA line ($226). Reported Sep '20 quarterly earnings +38% on +11% sales revenues versus the year ago period, above the +25% minimum earnings guideline (C criteria).
>>> FEATURED STOCK ARTICLE : Earnings Due; Consolidating Near Prior High and Above 50 DMA Line - 10/27/2020 |
View all notes |
Set NEW NOTE alert |
Company Profile |
SEC
News |
Chart |
Request a new note
C
A
S
I |
AMD
-
NASDAQ
Advanced Micro Devices
ELECTRONICS - Semiconductor - Broad Line
|
$83.00
|
+1.65
2.03% |
$83.50
|
46,225,916
85.39% of 50 DAV
50 DAV is 54,137,000
|
$94.28
-11.96%
|
8/31/2020
|
$90.42
|
PP = $87.39
|
|
MB = $91.76
|
Most Recent Note - 11/4/2020 5:15:29 PM
G - Gapped up and rebounded near its 50 DMA line ($81.26) with today's volume-driven gain. Subsequent losses and deterioration below the recent low would raise greater concerns and trigger a more worrisome technical sell signal. Faces near-term resistance due to overhead supply up to the $94 level. See the latest FSU analysis for more details and an annotated graph.
>>> FEATURED STOCK ARTICLE : Weak Action Raised Concern While Testing Recent Low - 11/3/2020 |
View all notes |
Set NEW NOTE alert |
Company Profile |
SEC
News |
Chart |
Request a new note
C
A
S
I |
TER
-
NASDAQ
Teradyne Inc
ELECTRONICS - Semiconductor Equipment and Mate
|
$99.32
|
+3.47
3.62% |
$100.35
|
1,906,210
80.84% of 50 DAV
50 DAV is 2,358,000
|
$93.44
6.29%
|
10/21/2020
|
$92.22
|
PP = $93.54
|
|
MB = $98.22
|
 Most Recent Note - 11/5/2020 5:49:24 PM
G - Hit another new all-time high and rose above its "max buy" level with 4th consecutive gain backed by below average volume and its color code is changed to green. Gains above a stock's pivot point must be backed by at least +40% above average volume to trigger a proper technical buy signal. Reported earnings +53% on +41% sales revenues for the Sep '20 quarter versus the year ago period, its 4th consecutive quarterly comparison with earnings above the +25% minimum earnings guideline (C criteria). Sequential comparisons show encouraging acceleration in its sales revenues growth rate. Its annual earnings (A criteria) history has been strong.
>>> FEATURED STOCK ARTICLE : Challenging All-Time High With Volume-Drive Gain - 10/21/2020 |
View all notes |
Set NEW NOTE alert |
Company Profile |
SEC
News |
Chart |
Request a new note
C
A
S
I |
TREX
-
NYSE
Trex Company Inc
MATERIALS and CONSTRUCTION - General Building Materials
|
$77.34
|
+2.02
2.68% |
$78.60
|
588,883
74.07% of 50 DAV
50 DAV is 795,000
|
$81.23
-4.79%
|
6/26/2020
|
$54.53
|
PP = $66.47
|
|
MB = $69.79
|
Most Recent Note - 11/4/2020 5:12:21 PM
G - Rebounded above its 50 DMA line ($72.86) with today's volume-driven gain. Prior low ($63.32 on 9/21/20) defines the next near-term support. Reported Sep '20 quarterly earnings +14% on +19% sales revenues versus the year ago period, below the +25% minimum guideline (C criteria) raising fundamental concerns. See the latest FSU analysis for more details and a new annotated graph.
>>> FEATURED STOCK ARTICLE : Rebound Above 50-Day Moving Average Helped Technical Stance - 11/4/2020 |
View all notes |
Set NEW NOTE alert |
Company Profile |
SEC
News |
Chart |
Request a new note
C
A
S
I |
LGIH
-
NASDAQ
L G I Homes Inc
Bldg-Resident/Comml
|
$123.19
|
+2.21
1.83% |
$125.09
|
252,958
96.92% of 50 DAV
50 DAV is 261,000
|
$132.98
-7.36%
|
10/1/2020
|
$123.17
|
PP = $124.04
|
|
MB = $130.24
|
Most Recent Note - 11/4/2020 5:18:32 PM
G - Reported Sep '20 quarterly earnings +27% on +11% sales revenues versus the year ago period. Posted a 3rd consecutive gain today with above average volume, rising and closing back above the 50 DMA line ($116.35) helping its outlook to improve. Members were cautioned with recent notes - "Recent gains above the new pivot point lacked the +40% above average volume needed to clinch a proper new (or add-on) technical buy signal."
>>> FEATURED STOCK ARTICLE : Hovering Near High But Recent Gains Lacked Great Volume - 10/19/2020 |
View all notes |
Set NEW NOTE alert |
Company Profile |
SEC
News |
Chart |
Request a new note
C
A
S
I |
Symbol/Exchange
Company Name
Industry Group |
PRICE |
CHANGE
(%Change) |
Day High |
Volume
(% DAV)
(% 50 day avg vol) |
52 Wk Hi
% From Hi |
Featured
Date |
Price
Featured |
Pivot Featured |
|
Max Buy |
NOW
-
NYSE
Servicenow Inc
Computer Sftwr-Enterprse
|
$531.08
|
+17.50
3.41% |
$533.84
|
1,184,779
90.03% of 50 DAV
50 DAV is 1,316,000
|
$533.37
-0.43%
|
8/20/2020
|
$453.34
|
PP = $454.79
|
|
MB = $477.53
|
Most Recent Note - 11/4/2020 12:40:00 PM
G - Gapped up today finding prompt support and rebounding above its 50 DMA line ($487) with today's volume-driven gain helping its outlook improve. Prior low ($432.85 on 9/08/20) defines the next important support where any violation would raise greater concerns. Recently reported Sep '20 quarterly earnings +22% on +30% sales revenues versus the year ago period, below the +25% minimum guideline (C criteria) of the fact-based investment system.
>>> FEATURED STOCK ARTICLE : Found Prompt Support at 50 DMA Line After Earnings News - 10/29/2020 |
View all notes |
Set NEW NOTE alert |
Company Profile |
SEC
News |
Chart |
Request a new note
C
A
S
I |
VEEV
-
NYSE
Veeva Systems Inc Cl A
Computer Sftwr-Medical
|
$297.17
|
+12.77
4.49% |
$298.19
|
893,970
106.68% of 50 DAV
50 DAV is 838,000
|
$313.99
-5.36%
|
10/6/2020
|
$287.71
|
PP = $298.86
|
|
MB = $313.80
|
Most Recent Note - 11/5/2020 5:50:43 PM
G - Gapped up for a 2nd consecutive session, rebounding well above its 50 DMA line ($283) helping its outlook improve after damaging losses triggered a technical sell signal. Fundamentals remain strong.
>>> FEATURED STOCK ARTICLE : Recently Slumped Back Below Prior Highs - 10/26/2020 |
View all notes |
Set NEW NOTE alert |
Company Profile |
SEC
News |
Chart |
Request a new note
C
A
S
I |
TEAM
-
NASDAQ
Atlassian Corp Plc Cl A
Comp Sftwr-Spec Enterprs
|
$199.99
|
+11.17
5.92% |
$203.18
|
2,258,892
131.18% of 50 DAV
50 DAV is 1,722,000
|
$216.30
-7.54%
|
10/12/2020
|
$193.77
|
PP = $199.60
|
|
MB = $209.58
|
Most Recent Note - 11/5/2020 5:47:21 PM
G - Gapped up for a 2nd consecutive session today, rebounding well above its 50 DMA line ($188) and finding prompt support after damaging losses on higher volume triggered a technical sell signal. Reported earnings +7% on +26% sales revenues for the Sep '20 quarter versus the year ago period, well below the +25% minimum earnings guideline (C criteria), raising concerns.
>>> FEATURED STOCK ARTICLE : Weak Technical Action Followed Disappointing Fundamental News - 11/2/2020 |
View all notes |
Set NEW NOTE alert |
Company Profile |
SEC
News |
Chart |
Request a new note
C
A
S
I |
YETI
-
NYSE
Yeti Holdings Inc
Leisure-Products
|
$59.91
|
+8.49
16.51% |
$60.93
|
5,362,860
487.09% of 50 DAV
50 DAV is 1,101,000
|
$55.04
8.85%
|
11/5/2020
|
$57.25
|
PP = $55.14
|
|
MB = $57.90
|
Most Recent Note - 11/5/2020 5:45:14 PM
Y - Finished strong after highlighted in yellow with pivot point cited based on its 8/06/20 high plus 10 cents in the earlier mid-day report. It powered to a new all-time high with today's big gain backed by +390% above average volume, clearing an orderly base and triggering a technical buy signal. Bullish action came after it reported earnings +126% on +29% sales revenues for the Sep '20 quarter versus the year ago period, its 5th consecutive quarterly earnings increase above the +25% minimum earnings guideline (C criteria) of the fact-based investment system. Limited annual earnings (A criteria) history was previously noted as a concern. The number of top-rated funds owning its shares rose from 310 in Dec '19 to 480 in Sep '20, a reassuring sign concerning the I criteria. Completed Secondary Offerings on 5/12/20, 2/20/20, 11/08/19 and 5/08/19 after its $18 IPO on 10/25/18. See the latest FSU analysis for more details and a new annotated graph.
>>> FEATURED STOCK ARTICLE : Finished Strong After Breakout Gain Was Noted in Mid-Day Report - 11/5/2020 |
View all notes |
Set NEW NOTE alert |
Company Profile |
SEC
News |
Chart |
Request a new note
C
A
S
I |
|
|
|
THESE ARE NOT BUY RECOMMENDATIONS!
Comments contained in the body of this report are technical
opinions only. The material herein has been obtained
from sources believed to be reliable and accurate, however,
its accuracy and completeness cannot be guaranteed.
This site is not an investment advisor, hence it does
not endorse or recommend any securities or other investments.
Any recommendation contained in this report may not
be suitable for all investors and it is not to be deemed
an offer or solicitation on our part with respect to
the purchase or sale of any securities. All trademarks,
service marks and trade names appearing in this report
are the property of their respective owners, and are
likewise used for identification purposes only.
This report is a service available
only to active Paid Premium Members.
You may opt-out of receiving report notifications
at any time. Questions or comments may be submitted
by writing to Premium Membership Services 665 S.E. 10 Street, Suite 201 Deerfield Beach, FL 33441-5634 or by calling 1-800-965-8307
or 954-785-1121.
|
|
|