You are not logged in.
This means you
CAN ONLY VIEW reports that were published prior to Monday, April 14, 2025.
You
MUST UPGRADE YOUR MEMBERSHIP if you want to see any current reports.
AFTER MARKET UPDATE - MONDAY, NOVEMBER 5TH, 2012
Previous After Market Report Next After Market Report >>>
|
|
|
|
DOW |
+19.28 |
13,112.44 |
+0.15% |
|
Volume |
600,712,310 |
-24% |
|
Volume |
1,443,883,950 |
-18% |
|
NASDAQ |
+17.53 |
2,999.66 |
+0.59% |
|
Advancers |
1,538 |
49% |
|
Advancers |
1,481 |
58% |
|
S&P 500 |
+3.06 |
1,417.26 |
+0.22% |
|
Decliners |
1,448 |
46% |
|
Decliners |
973 |
38% |
|
Russell 2000 |
+5.17 |
819.54 |
+0.63% |
|
52 Wk Highs |
70 |
|
|
52 Wk Highs |
32 |
|
|
S&P 600 |
-2.41 |
461.28 |
-0.52% |
|
52 Wk Lows |
37 |
|
|
52 Wk Lows |
42 |
|
|
 |
Major Averages Rise on Light Volume
Kenneth J. Gruneisen - Passed the CAN SLIM® Master's Exam
On Monday's session the major averages posted small gains. The volume totals were reported lower on the NYSE and on the Nasdaq exchange versus the prior session's totals, hinting that institutional buying demand was not behind the market's rally effort. Breadth was positive as advancers led decliners by a 3-2 margin on the Nasdaq exchange, but on the NYSE the bias was only slightly positive. The total number of stocks hitting new 52-week highs outnumbered new 52-week lows on the NYSE, but new lows outnumbered new highs on the Nasdaq exchange. There were 27 high-ranked companies from the CANSLIM.net Leaders List making new 52-week highs and appearing on the CANSLIM.net BreakOuts Page, down from the prior session total of 63 stocks. There were gains for 8 of the 17 high-ranked companies currently included on the Featured Stocks Page.
Stocks traded in a narrow range throughout the session as investors prepared for the presidential elections. Early economic data was modestly negative with the ISM non-manufacturing index falling more than expected in October.
Six of the 10 sectors on the S&P ended higher, led by gains in materials. Steel producers led the space with U.S. Steel Corp (X +1.39%) and Nucor Corp (NUE +0.76%) ending higher by 31 cents at $40.95 per share. On the earnings front, Transocean (RIG +5.60%) rose following the company's better-than-expected third-quarter profit tally. Also among earnings, Time Warner Cable Inc (TWC -6.36%) fell after the company missed analysts estimates in the quarter. In other news, shares of Apple Inc (AAPL +1.36%) rallied on reports that the company sold over 3 million iPad minis over the weekend.
Turning to fixed income, Treasuries are higher along the curve. The benchmark 10-year note was up 5/16 of a point to yield 1.69% and the 30-year bond advanced 23/32 to yield 2.87%.
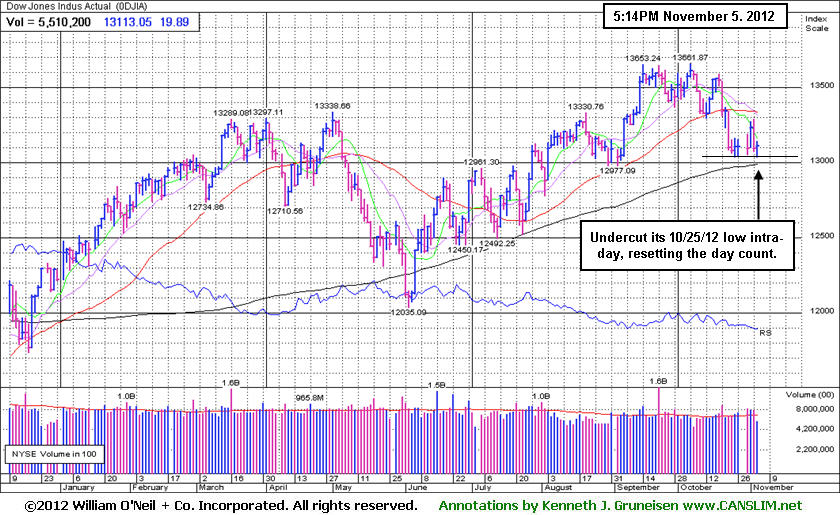
The session marked Day 5 for the Nasdaq Composite Index's rally attempt and Day 4 for the S&P 500 Index, so the window still remains open for an ideal follow-through day, provided that the indices' recent lows are not undercut.
During market corrections the M criteria argues against new buying efforts and urges investors to take a defensive stance to protect precious capital. That stance can change back to a bullish stance where buying is encouraged when at least one of the three major averages produces a solid follow-through day (FTD). A FTD confirming a new rally requires substantial gains on higher (ideally above average) volume, coupled with healthy leadership and a respectable number of stocks hitting new 52-week highs. Historic studies have shown that a FTD occurring between Days 4-7 of a new rally effort has often signaled the beginning of the most substantial market rallies.
Investors should always limit losses if ever any stock falls more than -7% from their purchase price. Following strict sell rules is precisely how this fact-based investment system prompts investors to reduce exposure and protect cash during market downturns. Keep a watchlist of strong acting stocks with all-key criteria in anticipation of the next confirmed uptrend. See the noteworthy candidates included on the Featured Stocks Page.
Watch for an announcement via email concerning the next WEBCAST. The webcast will also be available via an updated link highlighted at the top of the Premium Member Homepage.
PICTURED: The Dow Jones Industrial Average undercut its 10/25/12 low, resetting the day count for the Blue Chip Index before finishing with a gain for a new Day 1. In this commentary we will continue to watch closely for confirming gains within the ideal window for a proper FTD, meanwhile caution and patience are required.
|
 Kenneth J. Gruneisen started out as a licensed stockbroker in August 1987, a couple of months prior to the historic stock market crash that took the Dow Jones Industrial Average down -22.6% in a single day. He has published daily fact-based fundamental and technical analysis on high-ranked stocks online for two decades. Through FACTBASEDINVESTING.COM, Kenneth provides educational articles, news, market commentary, and other information regarding proven investment systems that work in good times and bad.
Comments contained in the body of this report are technical opinions only and are not necessarily those of Gruneisen Growth Corp. The material herein has been obtained from sources believed to be reliable and accurate, however, its accuracy and completeness cannot be guaranteed. Our firm, employees, and customers may effect transactions, including transactions contrary to any recommendation herein, or have positions in the securities mentioned herein or options with respect thereto. Any recommendation contained in this report may not be suitable for all investors and it is not to be deemed an offer or solicitation on our part with respect to the purchase or sale of any securities. |
|
 |
Retail, Tech, Energy, and Healthcare Groups Rose
Kenneth J. Gruneisen - Passed the CAN SLIM® Master's Exam
The Retail Index ($RLX +1.07%) was a positive influence on the major averages while the Broker/Dealer Index ($XBD +0.78%) also rallied but the Bank Index ($BKX -0.28%) edged lower. The Biotechnology Index ($BTK +2.97%) led the tech sector's gains while the Semiconductor Index ($SOX +1.63%), Networking Index ($NWX +1.32%), and the Internet Index ($IIX +0.62%) posted unanimous gains. The Gold & Silver Index ($XAU -0.66%) edged lower while the Oil Services Index ($OSX +1.70%) and the Integrated Oil Index ($XOI +0.65%) posted gains. The Healthcare Index ($HMO +1.42%) rounded out Monday's mostly positive session.
Charts courtesy www.stockcharts.com
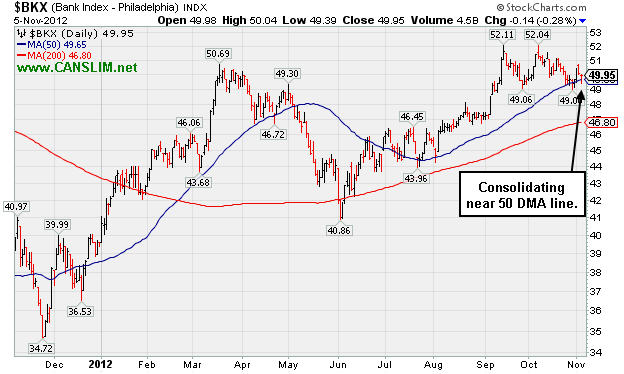
PICTURED: The Bank Index ($BKX -0.28%) is consolidating near its 50-day moving average line.
| Oil Services |
$OSX |
219.17 |
+3.66 |
+1.70% |
+1.34% |
| Healthcare |
$HMO |
2,508.08 |
+35.03 |
+1.42% |
+9.93% |
| Integrated Oil |
$XOI |
1,233.14 |
+7.91 |
+0.65% |
+0.33% |
| Semiconductor |
$SOX |
378.38 |
+6.07 |
+1.63% |
+3.83% |
| Networking |
$NWX |
199.75 |
+2.60 |
+1.32% |
-7.16% |
| Internet |
$IIX |
309.93 |
+1.92 |
+0.62% |
+10.01% |
| Broker/Dealer |
$XBD |
86.66 |
+0.67 |
+0.78% |
+4.07% |
| Retail |
$RLX |
656.79 |
+6.93 |
+1.07% |
+25.53% |
| Gold & Silver |
$XAU |
177.78 |
-1.18 |
-0.66% |
-1.58% |
| Bank |
$BKX |
49.95 |
-0.14 |
-0.28% |
+26.84% |
| Biotech |
$BTK |
1,454.66 |
+41.99 |
+2.97% |
+33.28% |
|
|
|
 |
Relative Strength Rating Has Slipped Under Minimum Guideline
Kenneth J. Gruneisen - Passed the CAN SLIM® Master's Exam
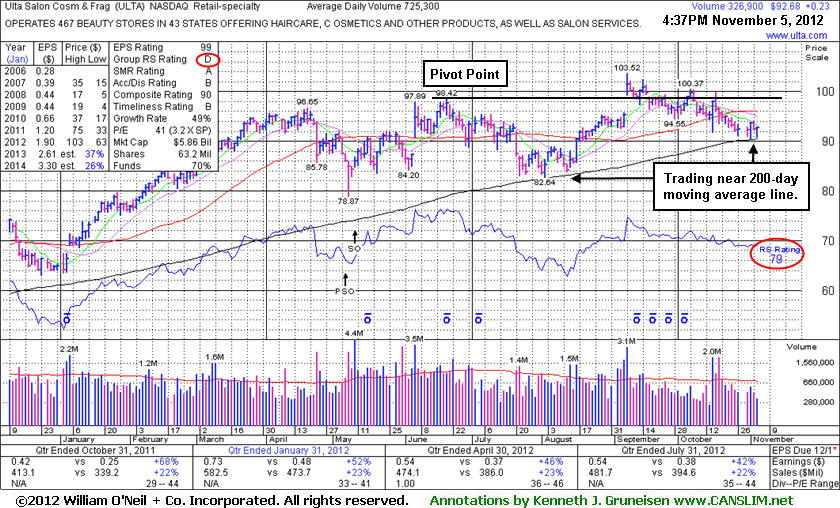
Ulta Salon Cosmetics & Fragrance, Inc. (ULTA +$0.23 or +0.25% to $92.68) is still sputtering below its 50-day moving average (DMA) line, and a rebound above that important short-term average is needed for its outlook to improve. Its 200 DMA line ($90.46 now) defines near-term support to watch. Meanwhile, its Relative Strength Rating (see red circles) has slumped to 79, just below the 80+ minimum guideline for buy candidates under the fact-based investment system, and the Group RS Rating fell from C to a D since it was last shown in this FSU section on 10/05/12 with an annotated graph under the headline, "Relative Strength Line Did Not Provide Confirmation". That review illustrated how its RS line (the jagged blue line) was plotted higher earlier this year while we observed - "Big market winners the fact-based investment system has identified in the past more often saw their Relative Strength lines lead the way into new high territory first, before the stock's price technically broke into new high territory. In this case, it is fair to say that the stock's RS line did not confirm the move into new high territory. For now, that gives investors a reason to be cautious until more convincing signs of fresh institutional accumulation emerge. Disciplined investors always limit losses if ever any stock falls -7% or more from their purchase price."
Following its bullish gap up on 9/07/12 it stalled. It reported earnings +42% on +22% sales revenues for the quarter ended July 30, 2012 versus the year ago period. Its strong quarterly earnings increases above the +25% guideline in the 9 latest comparisons satisfies the C criteria, and its solid annual earnings (A criteria) history is also very reassuring. The number of top-rated funds with an ownership interest has grown from 376 funds in Dec '10 to 587 funds as of Sep '12, which is a very encouraging sign of increasing institutional interest (the I criteria).
|
|
|
Color Codes Explained :
Y - Better candidates highlighted by our
staff of experts.
G - Previously featured
in past reports as yellow but may no longer be buyable under the
guidelines.
***Last / Change / Volume data in this table is the closing quote data***
Symbol/Exchange
Company Name
Industry Group |
PRICE |
CHANGE
(%Change) |
Day High |
Volume
(% DAV)
(% 50 day avg vol) |
52 Wk Hi
% From Hi |
Featured
Date |
Price
Featured |
Pivot Featured |
|
Max Buy |
ASPS
-
NASDAQ
Altisource Ptf Sltns Sa
REAL ESTATE - Property Management/Developmen
|
$107.63
|
-3.37
-3.04% |
$112.54
|
484,023
232.59% of 50 DAV
50 DAV is 208,100
|
$129.72
-17.03%
|
9/24/2012
|
$87.24
|
PP = $92.39
|
|
MB = $97.01
|
 Most Recent Note - 11/5/2012 10:50:31 AM
G - Down considerably today with volume running at an above average pace while slumping near important support at its 50 DMA line.
>>> The latest Featured Stock Update with an annotated graph appeared on 10/12/2012. Click here.
View all notes |
Alert me of new notes |
CANSLIM.net Company Profile |
SEC |
Zacks Reports |
StockTalk |
News |
Chart |
Request a new note
C
A N
S L
I M


|
BRLI
-
NASDAQ
Bio Reference Labs Inc
HEALTH SERVICES - Medical Laboratories and Researc
|
$28.82
|
+0.69
2.45% |
$28.95
|
313,832
91.58% of 50 DAV
50 DAV is 342,700
|
$32.86
-12.29%
|
10/3/2012
|
$30.90
|
PP = $30.25
|
|
MB = $31.76
|
Most Recent Note - 11/5/2012 5:43:16 PM
G - Rose near its 50 DMA line today which may now act as a resistance level after damaging distributional action in recent weeks.
>>> The latest Featured Stock Update with an annotated graph appeared on 10/8/2012. Click here.
View all notes |
Alert me of new notes |
CANSLIM.net Company Profile |
SEC |
Zacks Reports |
StockTalk |
News |
Chart |
Request a new note
C
A N
S L
I M
|
CFNL
-
NASDAQ
Cardinal Financial Corp
BANKING - Regional - Southeast Banks
|
$15.90
|
+0.24
1.53% |
$16.09
|
239,304
213.66% of 50 DAV
50 DAV is 112,000
|
$16.07
-1.06%
|
8/17/2012
|
$12.84
|
PP = $13.31
|
|
MB = $13.98
|
Most Recent Note - 11/5/2012 11:59:11 AM
G - Hovering near its 52-week high today, holding its ground while enduring some distributional pressure after getting extended from its prior base. Found support at its 50 DMA line in recent months.
>>> The latest Featured Stock Update with an annotated graph appeared on 10/25/2012. Click here.
View all notes |
Alert me of new notes |
CANSLIM.net Company Profile |
SEC |
Zacks Reports |
StockTalk |
News |
Chart |
Request a new note
C
A N
S L
I M
|
CMCSA
-
NASDAQ
Comcast Corp Cl A
MEDIA - CATV Systems
|
$37.43
|
-0.18
-0.48% |
$37.50
|
13,215,617
107.34% of 50 DAV
50 DAV is 12,311,800
|
$37.96
-1.40%
|
6/11/2012
|
$29.94
|
PP = $30.98
|
|
MB = $32.53
|
Most Recent Note - 11/1/2012 6:15:21 PM
G - Touched another new 52-week high today. Reported earnings +39% on +15% sales revenues for the Sep '12 quarter, a reassuring follow-up to the previously noted sub par quarter. Upward trendline and 50 DMA line define near term support where violations would trigger technical sell signals.
>>> The latest Featured Stock Update with an annotated graph appeared on 10/24/2012. Click here.
View all notes |
Alert me of new notes |
CANSLIM.net Company Profile |
SEC |
Zacks Reports |
StockTalk |
News |
Chart |
Request a new note
C
A N
S L
I M
|
DVA
-
NYSE
Davita Inc
HEALTH SERVICES - Specialized Health Services
|
$111.62
|
+0.12
0.11% |
$112.38
|
788,342
98.35% of 50 DAV
50 DAV is 801,600
|
$114.85
-2.81%
|
9/5/2012
|
$102.92
|
PP = $100.62
|
|
MB = $105.65
|
Most Recent Note - 10/31/2012 4:32:17 PM
G - Reported earnings +3% on +12% sales for the Sep '12 quarter, below the guidelines of the fact-based system. Hit a new 52-week high today with a gain backed by above average volume, getting more extended from its latest sound base. Prior highs near $100 and its 50 DMA line define near-term support to watch on pullbacks where violations may trigger technical sell signals.
>>> The latest Featured Stock Update with an annotated graph appeared on 10/10/2012. Click here.
View all notes |
Alert me of new notes |
CANSLIM.net Company Profile |
SEC |
Zacks Reports |
StockTalk |
News |
Chart |
Request a new note
C
A N
S L
I M
|
Symbol/Exchange
Company Name
Industry Group |
PRICE |
CHANGE
(%Change) |
Day High |
Volume
(% DAV)
(% 50 day avg vol) |
52 Wk Hi
% From Hi |
Featured
Date |
Price
Featured |
Pivot Featured |
|
Max Buy |
GPX
-
NYSE
G P Strategies Corp
DIVERSIFIED SERVICES - Education and Training Services
|
$19.71
|
+0.25
1.28% |
$20.21
|
131,284
231.95% of 50 DAV
50 DAV is 56,600
|
$20.67
-4.64%
|
10/8/2012
|
$20.00
|
PP = $20.77
|
|
MB = $21.81
|
Most Recent Note - 11/5/2012 5:45:43 PM
G - Gain today with above average volume helped it claw its way above its 50 DMA line. Recently reported earnings +0% on +12% sales revenues for the Sep '12 quarter, below the +25% minimum earnings guideline, raising fundamental concerns.
>>> The latest Featured Stock Update with an annotated graph appeared on 10/16/2012. Click here.
View all notes |
Alert me of new notes |
CANSLIM.net Company Profile |
SEC |
Zacks Reports |
StockTalk |
News |
Chart |
Request a new note
C
A N
S L
I M
|
LKQ
-
NASDAQ
L K Q Corp
WHOLESALE - Auto Parts
|
$21.27
|
+0.23
1.09% |
$21.35
|
1,407,063
88.61% of 50 DAV
50 DAV is 1,588,000
|
$21.95
-3.10%
|
8/9/2012
|
$18.97
|
PP = $18.72
|
|
MB = $19.66
|
Most Recent Note - 11/1/2012 6:09:21 PM
G - Rallied with above average volume today for a new 52-week high, and no resistance remains due to overhead supply. Showed impressive resilience and strength after reporting earnings +6% on +30% sales revenues for the Sep '12 quarter. Results below the +25% minimum earnings guideline (C criteria) raised fundamental concerns.
>>> The latest Featured Stock Update with an annotated graph appeared on 10/19/2012. Click here.
View all notes |
Alert me of new notes |
CANSLIM.net Company Profile |
SEC |
Zacks Reports |
StockTalk |
News |
Chart |
Request a new note
C
A N
S L
I M
|
MIDD
-
NASDAQ
Middleby Corp
MANUFACTURING - Diversified Machinery
|
$119.73
|
-3.67
-2.97% |
$125.99
|
179,627
235.42% of 50 DAV
50 DAV is 76,300
|
$127.89
-6.38%
|
10/8/2012
|
$118.46
|
PP = $122.67
|
|
MB = $128.80
|
Most Recent Note - 11/5/2012 5:36:45 PM
Y - Retreating abruptly from its 52-week high with above average volume behind today's damaging loss as it sank below its pivot point toward its 50 DMA line raising concerns. The M criteria remains an overriding concern until a FTD confirms a new rally. Company will release 2012 third quarter earnings on Tuesday, November 6 after the market closes.
>>> The latest Featured Stock Update with an annotated graph appeared on 10/22/2012. Click here.
View all notes |
Alert me of new notes |
CANSLIM.net Company Profile |
SEC |
Zacks Reports |
StockTalk |
News |
Chart |
Request a new note
C
A N
S L
I M
|
N
-
NYSE
Netsuite Inc
DIVERSIFIED SERVICES - Business/Management Services
|
$62.94
|
-0.02
-0.03% |
$63.25
|
362,340
70.02% of 50 DAV
50 DAV is 517,500
|
$67.02
-6.09%
|
8/20/2012
|
$55.88
|
PP = $59.32
|
|
MB = $62.29
|
Most Recent Note - 10/31/2012 12:53:04 PM
G - Reported earnings +60% on +31% sales revenues for the Sep '12 quarter. Pulling back today following a considerable 10/26/12 gap up and volume-driven gain from below its 50 DMA line for new 52-week and all-time highs. It did not form a sound new base pattern. Until the major averages are back in a confirmed rally the M criteria argues against any new buying efforts.
>>> The latest Featured Stock Update with an annotated graph appeared on 10/26/2012. Click here.
View all notes |
Alert me of new notes |
CANSLIM.net Company Profile |
SEC |
Zacks Reports |
StockTalk |
News |
Chart |
Request a new note
C
A N
S L
I M
|
NSM
-
NYSE
Nationstar Mtg Hldgs Inc
FINANCIAL SERVICES - Credit Services
|
$30.20
|
-2.91
-8.79% |
$33.00
|
4,463,571
289.92% of 50 DAV
50 DAV is 1,539,600
|
$37.20
-18.82%
|
8/29/2012
|
$27.96
|
PP = $28.85
|
|
MB = $30.29
|
Most Recent Note - 11/5/2012 10:46:24 AM
G - Violated its 50 DMA line with a damaging loss today with volume running at an above average pace, worrisome action indicative of more distributional pressure.
>>> The latest Featured Stock Update with an annotated graph appeared on 10/11/2012. Click here.
View all notes |
Alert me of new notes |
CANSLIM.net Company Profile |
SEC |
Zacks Reports |
StockTalk |
News |
Chart |
Request a new note
C
A N
S L
I M
|
Symbol/Exchange
Company Name
Industry Group |
PRICE |
CHANGE
(%Change) |
Day High |
Volume
(% DAV)
(% 50 day avg vol) |
52 Wk Hi
% From Hi |
Featured
Date |
Price
Featured |
Pivot Featured |
|
Max Buy |
OSIS
-
NASDAQ
O S I Systems Inc
ELECTRONICS - Semiconductor Equipment and Mate
|
$79.48
|
+1.13
1.44% |
$80.00
|
51,148
45.02% of 50 DAV
50 DAV is 113,600
|
$81.23
-2.15%
|
9/5/2012
|
$74.39
|
PP = $75.10
|
|
MB = $78.86
|
Most Recent Note - 11/5/2012 4:32:10 PM
G - Posted a gain today on light volume. Recently found prompt support at its 50 DMA line, and it is still slightly extended from its prior base.
>>> The latest Featured Stock Update with an annotated graph appeared on 10/18/2012. Click here.
View all notes |
Alert me of new notes |
CANSLIM.net Company Profile |
SEC |
Zacks Reports |
StockTalk |
News |
Chart |
Request a new note
C
A N
S L
I M
|
RNF
-
NYSE
Rentech Nitrogen Ptnr Lp
CHEMICALS - Agricultural Chemicals
|
$38.60
|
-0.23
-0.59% |
$39.25
|
392,297
103.15% of 50 DAV
50 DAV is 380,300
|
$41.15
-6.20%
|
11/1/2012
|
$39.11
|
PP = $40.15
|
|
MB = $42.16
|
Most Recent Note - 11/2/2012 5:48:08 PM
Y - Touched a new 52-week high today, but a "negative reversal" led to a loss with above average volume which broke a streak of 5 consecutive gains. See the latest FSU analysis for more details and a new annotated graph.
>>> The latest Featured Stock Update with an annotated graph appeared on 11/2/2012. Click here.
View all notes |
Alert me of new notes |
CANSLIM.net Company Profile |
SEC |
Zacks Reports |
StockTalk |
News |
Chart |
Request a new note
C
A N
S L
I M
|
TDG
-
NYSE
Transdigm Group Inc
AEROSPACE/DEFENSE - Aerospace/Defense Products and; Services
|
$136.82
|
-0.06
-0.04% |
$137.66
|
487,132
96.75% of 50 DAV
50 DAV is 503,500
|
$139.31
-1.79%
|
8/16/2012
|
$132.23
|
PP = $136.44
|
|
MB = $143.26
|
Most Recent Note - 11/1/2012 6:16:31 PM
G - Posted a gain today with below average volume. When noted on 10/23/12 it undercut its 50 DMA line following a special dividend, yet it promptly rebounded back above that important short-term average.
>>> The latest Featured Stock Update with an annotated graph appeared on 10/23/2012. Click here.
View all notes |
Alert me of new notes |
CANSLIM.net Company Profile |
SEC |
Zacks Reports |
StockTalk |
News |
Chart |
Request a new note
C
A N
S L
I M
|
ULTA
-
NASDAQ
Ulta Salon Cosm & Frag
SPECIALTY RETAIL - Specialty Retail, Other
|
$92.68
|
+0.23
0.25% |
$92.88
|
338,865
46.72% of 50 DAV
50 DAV is 725,300
|
$103.52
-10.47%
|
9/4/2012
|
$93.17
|
PP = $98.52
|
|
MB = $103.45
|
Most Recent Note - 11/5/2012 4:55:59 PM
G - Its 200 DMA line defines near-term support to watch while its waning Relative Strength Rating has raised concerns. See the latest FSU analysis for more details and a new annotated graph.
>>> The latest Featured Stock Update with an annotated graph appeared on 11/5/2012. Click here.
View all notes |
Alert me of new notes |
CANSLIM.net Company Profile |
SEC |
Zacks Reports |
StockTalk |
News |
Chart |
Request a new note
C
A N
S L
I M
|
ULTI
-
NASDAQ
Ultimate Software Group
INTERNET - Internet Software and Services
|
$95.73
|
+0.57
0.60% |
$95.81
|
63,791
39.84% of 50 DAV
50 DAV is 160,100
|
$106.40
-10.03%
|
10/31/2012
|
$101.36
|
PP = $105.00
|
|
MB = $110.25
|
Most Recent Note - 11/1/2012 6:00:55 PM
G - Gapped down today and erased the prior session's gain, raising concerns while violating its 50 DMA line with a damaging loss on above average volume. Reported earnings +61% on +22% sales revenues for the Sep '12 quarter. Color code is changed to green, and a rebound above its 50 DMA is needed to improve its technical stance. Still building on a 9-week "double bottom" base pattern. See latest FSU analysis for more details and a new annotated graph.
>>> The latest Featured Stock Update with an annotated graph appeared on 10/31/2012. Click here.
View all notes |
Alert me of new notes |
CANSLIM.net Company Profile |
SEC |
Zacks Reports |
StockTalk |
News |
Chart |
Request a new note
C
A N
S L
I M
|
Symbol/Exchange
Company Name
Industry Group |
PRICE |
CHANGE
(%Change) |
Day High |
Volume
(% DAV)
(% 50 day avg vol) |
52 Wk Hi
% From Hi |
Featured
Date |
Price
Featured |
Pivot Featured |
|
Max Buy |
VSI
-
NYSE
Vitamin Shoppe Inc
SPECIALTY RETAIL - Specialty Retail, Other
|
$53.30
|
-1.68
-3.06% |
$55.47
|
450,200
172.82% of 50 DAV
50 DAV is 260,500
|
$61.83
-13.79%
|
10/15/2012
|
$57.82
|
PP = $60.08
|
|
MB = $63.08
|
Most Recent Note - 11/5/2012 5:39:33 PM
G - Slumped further below its 50 DMA line today with a damaging volume-driven loss raising more concerns. It will release earnings on Tuesday, November 6 before the market opens.
>>> The latest Featured Stock Update with an annotated graph appeared on 10/15/2012. Click here.
View all notes |
Alert me of new notes |
CANSLIM.net Company Profile |
SEC |
Zacks Reports |
StockTalk |
News |
Chart |
Request a new note
C
A N
S L
I M
|
WPI
-
NYSE
Watson Pharmaceuticals
DRUGS - Drugs - Generic
|
$86.51
|
-0.22
-0.25% |
$87.03
|
628,021
67.84% of 50 DAV
50 DAV is 925,700
|
$90.00
-3.88%
|
8/24/2012
|
$82.90
|
PP = $81.10
|
|
MB = $85.16
|
Most Recent Note - 11/1/2012 6:04:27 PM
G - Touched a new 52-week high today, rallying with above average volume after testing support at its 50 DMA line. It has not formed a sound base and it is extended from a proper buy point under the fact-based system's guidelines. See the latest FSU analysis for more details and a new annotated graph.
>>> The latest Featured Stock Update with an annotated graph appeared on 11/1/2012. Click here.
View all notes |
Alert me of new notes |
CANSLIM.net Company Profile |
SEC |
Zacks Reports |
StockTalk |
News |
Chart |
Request a new note
C
A N
S L
I M
|
|
|
|
THESE ARE NOT BUY RECOMMENDATIONS!
Comments contained in the body of this report are technical
opinions only. The material herein has been obtained
from sources believed to be reliable and accurate, however,
its accuracy and completeness cannot be guaranteed.
This site is not an investment advisor, hence it does
not endorse or recommend any securities or other investments.
Any recommendation contained in this report may not
be suitable for all investors and it is not to be deemed
an offer or solicitation on our part with respect to
the purchase or sale of any securities. All trademarks,
service marks and trade names appearing in this report
are the property of their respective owners, and are
likewise used for identification purposes only.
This report is a service available
only to active Paid Premium Members.
You may opt-out of receiving report notifications
at any time. Questions or comments may be submitted
by writing to Premium Membership Services 665 S.E. 10 Street, Suite 201 Deerfield Beach, FL 33441-5634 or by calling 1-800-965-8307
or 954-785-1121.
|
|
|

