You are not logged in.
This means you
CAN ONLY VIEW reports that were published prior to Monday, April 14, 2025.
You
MUST UPGRADE YOUR MEMBERSHIP if you want to see any current reports.
AFTER MARKET UPDATE - THURSDAY, NOVEMBER 5TH, 2009
Previous After Market Report Next After Market Report >>>
|
|
|
|
DOW |
+203.82 |
10,005.96 |
+2.08% |
|
Volume |
1,302,830,710 |
-3% |
|
Volume |
2,255,207,190 |
-1% |
|
NASDAQ |
+49.80 |
2,105.32 |
+2.42% |
|
Advancers |
2,495 |
80% |
|
Advancers |
2,161 |
76% |
|
S&P 500 |
+20.13 |
1,066.63 |
+1.92% |
|
Decliners |
540 |
17% |
|
Decliners |
602 |
21% |
|
Russell 2000 |
+18.03 |
581.15 |
+3.20% |
|
52 Wk Highs |
90 |
|
|
52 Wk Highs |
47 |
|
|
S&P 600 |
+8.82 |
307.76 |
+2.95% |
|
52 Wk Lows |
3 |
|
|
52 Wk Lows |
21 |
|
|
 |
Gains Without Great Volume Make New Rally Attempt Questionable
Adam Sarhan, Contributing Writer,
The major averages did not produce a sound follow-through day (FTD) because volume totals behind Thursday's gains were reported slightly lower than the prior session on both major exchanges. This marked Day 4 of the current rally attempt, which means as long as Monday's lows are not breached a new FTD could emerge if one or more of the major averages rallies at least 1.7% on heavier volume than the prior session. The market remains in a technical "correction" until a proper FTD emerges, so the investment system's M criteria argues against new buying efforts. Advancers easily trumped decliners by a 4-to-1 ratio on the NYSE and by over a 3-to-1 ratio on the Nasdaq exchange. There were 20 high-ranked companies from the CANSLIM.net Leaders List making a new 52-week high and appearing on the CANSLIM.net BreakOuts Page, higher than the 16 issue that appeared on the prior session. In terms of new leadership the recent action has yielded little worth noting, however new 52-week highs are still outnumbering new 52-week lows on the NYSE and Nasdaq exchange.
Two primary catalysts which sent stocks charging higher on Thursday were a stronger than expected Q3 earnings report from Cisco Systems (CSCO +2.75%) and a drop in unemployment claims. After Wednesday's closing bell, Cisco surprised the Street when they released their Q3 earnings. The stock gapped up as volume surged to its highest level this quarter. Meanwhile, the Labor Department said jobless (laid-off employees seeking unemployment benefits) claims fell to 512,000 last week which was the lowest level since January and fewer than expected. The stronger than expected jobless claims coupled with Wednesday's stronger than expected ADP report bodes well for Friday's official unemployment report. At this point, the consensus is that employers slashed -175,000 jobs in October which will be the smallest decline since August 2008 while the unemployment rate probably rose to +9.9%, up from September's reading of +9.8%. So far, the US economy has shed -7.2 million jobs since the recession began in December 2007.
Worker productivity jumped to the fastest pace in six years as labor costs fell according to the latest report from the Labor Department. Worker productivity measures each output per hour for each employee, rose at a +9.5% annual rate in the third quarter which topped the highest forecast on Wall Street. It was very interesting to see productivity jump in the third quarter because this followed a revised +6.9% increase in the second quarter and marked the largest consecutive quarterly gain in productivity since 1961. The productivity report showed hours worked declined at a -5% rate while worker output rose at a +4% clip. Hourly compensation rose at a +3.8% annual pace which is up from a +0.3% rate in the second quarter. Elsewhere, Bloomberg.com reported that the US Senate approved a $45 billion plan to expand a tax credit for first-time home buyers, extend jobless benefits and provide tax refunds for companies that lose money.
PICTURED: The Nasdaq Comoposite Index rallied +2.42% but failed to produce a proper FTD because volume was lighter than Wednesday's already light levels.
|
|
|
 |
Widespread Gains Help Every Group Get A Boost
Kenneth J. Gruneisen - Passed the CAN SLIM® Master's Exam
The tech sector posted solid gains across the board as the Networking Index ($NWX +2.13%), Semiconductor Index ($SOX +2.59%), Internet Index ($IIX +2.71%), and Biotechnology Index ($BTK +2.77%) each gained more than +2%on Thursday. The Retail Index ($RLX +1.83%) rose from its 50-day moving average line, and larger gains in the financial sector lifted the Bank Index ($BKX +2.95%) and Broker/Dealer Index ($XBD +2.15%) while still leaving them trading below their respective short-term averages. The Gold & Silver Index ($XAU +0.61%) posted a modest gain, and energy-related shares fared even better as the Integrated Oil Index ($XOI +1.58%) and Oil Services Index ($OSX +2.02%) rose. The Healthcare Index ($HMO +2.63%) also posted another healthy gain after the prior session's rally above its 50 DMA line.
Charts courtesy www.stockcharts.com
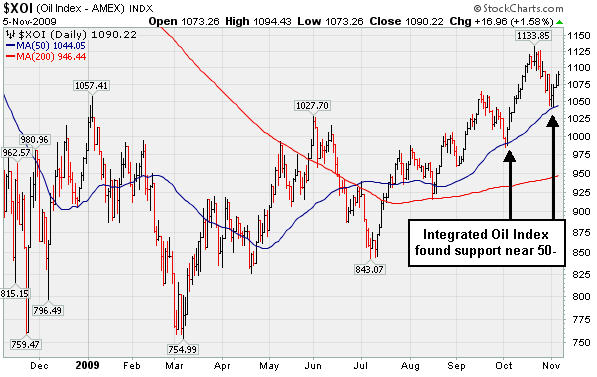
PICTURED: The Integrated Oil Index found support near 50-day moving average line during recent consolidations.
| Oil Services |
$OSX |
195.64 |
+3.88 |
+2.02% |
+61.17% |
| Healthcare |
$HMO |
1,258.30 |
+32.29 |
+2.63% |
+31.05% |
| Integrated Oil |
$XOI |
1,090.22 |
+16.96 |
+1.58% |
+11.28% |
| Semiconductor |
$SOX |
302.96 |
+7.65 |
+2.59% |
+42.79% |
| Networking |
$NWX |
225.87 |
+4.72 |
+2.13% |
+56.97% |
| Internet |
$IIX |
218.94 |
+5.78 |
+2.71% |
+63.67% |
| Broker/Dealer |
$XBD |
114.30 |
+2.41 |
+2.15% |
+47.54% |
| Retail |
$RLX |
388.75 |
+6.99 |
+1.83% |
+39.21% |
| Gold & Silver |
$XAU |
170.71 |
+1.04 |
+0.61% |
+37.84% |
| Bank |
$BKX |
42.94 |
+1.23 |
+2.95% |
-3.11% |
| Biotech |
$BTK |
883.14 |
+23.83 |
+2.77% |
+36.46% |
|
|
|
 |
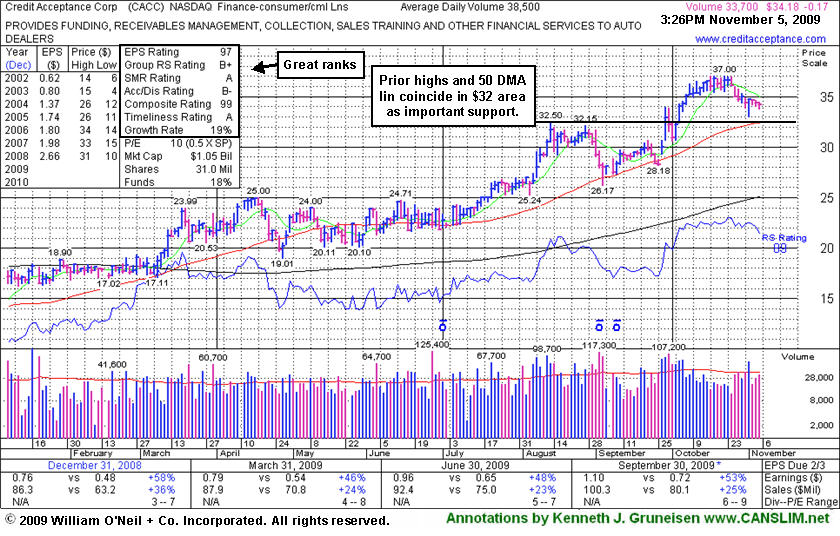
Healthy Consolidation Above Prior Highs And 50-Day Average
Kenneth J. Gruneisen - Passed the CAN SLIM® Master's Exam
Credit Acceptance Corp (CACC -$0.35 or -1.02% to $34.00) has been quietly consolidating since its impressive positive reversal was noted on 11/02/09. Prior chart highs and its 50-day moving average (DMA) line coincide in the $32 area, an important level to watch on pullbacks. It had posted 10 consecutive gain for a new high close well above its "max buy" level when it last appeared in this Featured Stock Update section on 10/15/09 with an annotated graph under the headline, "Finance Firm Extended After 10-Day Winning Streak." The high-ranked Finance-Consumer/Commercial Loans firm's 9/29/09 breakout gain was backed by more than 2 times average volume. Since featured it has also risen above its 2006-2007 highs ($33-34) to new all-time highs, which is a very reassuring sign of strength. CACC was featured in yellow in the 9/29/09 mid-day report (read here).
Investors might consider a light volume pullback to offer an opportunity to accumulate shares without chasing them more than +5% above its prior chart highs. However, market conditions (M criteria) have recently been noted as an overriding concern suggesting that investors hold off on any new buying efforts. The lighter NYSE volume total reported today left the new rally effort still in need of a confirming follow-through-day, and there remains a clear lack of new leadership. For any sustainable rally, the market needs a healthy crop of stocks rising for new highs on heavier that normal volume.
|
|
|
Color Codes Explained :
Y - Better candidates highlighted by our
staff of experts.
G - Previously featured
in past reports as yellow but may no longer be buyable under the
guidelines.
***Last / Change / Volume quote data in this table corresponds with the timestamp on the note***
Symbol/Exchange
Company Name
Industry Group |
Last |
Chg. |
Vol
% DAV |
Date Featured |
Price Featured |
Latest Pivot Point
Featured |
Status |
| Latest Max Buy Price |
ARO
- NYSE
Aeropostale Inc
RETAIL - Apparel Stores
|
$33.47
|
-4.56
|
13,928,341
N/A
|
8/21/2009
(Date
Featured) |
$39.21
(Price
Featured) |
PP = $44.95 |
|
| MB = $47.20 |
Most Recent Note - 11/5/2009
Gapped down today and closed at its 200 DMA line with a considerable loss on 5 times average volume after reporting disappointing quarterly results. Concerns were recently noted by its technical deterioration under under its July 20th high close. Based on the weak action it will be dropped from the Featured Stocks list tonight. Last week's previously noted technical sell signals and deterioration negated its 8/21/09 technical breakout with a close below July's highest close (its highest pre-breakout close).
>>> The latest Featured Stock Update with an annotated graph appeared on 11/3/2009. click here.
|
|
C
A
S
I |
News |
Chart |
SEC
View all notes Alert
me of new notes
Company
Profile
|
ARST
-
|
$24.80
|
+0.33
|
391,585
58% DAV
670,900
|
9/1/2009
(Date
Featured) |
$19.91
(Price
Featured) |
PP = $20.90 |
G |
| MB = $21.95 |
Most Recent Note - 11/5/2009 5:05:05 PM
G - Still consolidating quietly in a very tight trading range above its 50 DMA line and very near all-time highs. ARST traded up more than +30% since it was first featured in yellow at $19.91 in the 9/01/09 mid-day report with an annotated daily graph (read here).
>>> The latest Featured Stock Update with an annotated graph appeared on 10/21/2009. click here.
|
|
C
A
S
I |
News |
Chart |
SEC
View all notes Alert
me of new notes
Company
Profile
|
ASIA
-
|
$23.46
|
+0.70
|
668,933
83% DAV
805,700
|
10/14/2009
(Date
Featured) |
$23.05
(Price
Featured) |
PP = $22.19 |
Y |
| MB = $23.30 |
Most Recent Note - 11/5/2009 5:08:17 PM
Y - Gain today on light volume while consolidating since its big 10/29/09 gap up on solid earnings and raised guidance. It found prompt support near its 50 DMA line (a textbook chart support level) after a 7 session losing streak with losses on high volume briefly negated its latest breakout. Market conditions (M criteria) are a concern until a new follow-through-day occurs with more leadership. Featured 10/14/09 in the mid-day report (read here) as it gapped up for a new 52-week high with 5 times average volume, triggering a technical buy signal by blasting above its pivot point. First featured in the August 2009 CANSLIM.net News (read here).
>>> The latest Featured Stock Update with an annotated graph appeared on 10/30/2009. click here.
|
|
C
A
S
I |
News |
Chart |
SEC
View all notes Alert
me of new notes
Company
Profile
|
BIDU
- NASDAQ
Baidu Inc Ads
INTERNET - Internet Information Providers
|
$396.23
|
+9.86
|
1,843,436
95% DAV
1,932,400
|
9/8/2009
(Date
Featured) |
$351.80
(Price
Featured) |
PP = $368.59 |
G |
| MB = $387.02 |
Most Recent Note - 11/5/2009 5:09:45 PM
G - Third consecutive gain today on light volume, quietly rising above its 50 DMA line this week. Volume spiked to 5 times normal on 10/27/09 as it gapped down for a considerable loss following its latest earnings report. As recently noted, "Choppy action has not allowed it to form a sound base in recent weeks." BIDU traded up as much as +23% from its price when featured in yellow in the 9/08/09 Mid-Day BreakOuts Report (read here).
>>> The latest Featured Stock Update with an annotated graph appeared on 10/28/2009. click here.
|
|
C
A
S
I |
News |
Chart |
SEC
View all notes Alert
me of new notes
Company
Profile
|
CACC
- NASDAQ
Credit Acceptance Corp
FINANCIAL SERVICES - Credit Services
|
$34.00
|
-0.35
|
50,422
132% DAV
38,200
|
9/29/2009
(Date
Featured) |
$33.48
(Price
Featured) |
PP = $32.60 |
G |
| MB = $34.23 |
Most Recent Note - 11/5/2009 5:13:26 PM
G - Loss today on slightly higher volume indicated distributional pressure while consolidating since its impressive positive reversal was noted on 11/02/09. Market conditions (M criteria) are an overriding concern suggesting that investors hold off on any new buying efforts until a new rally with follow through day occurs. Prior chart highs and its 50 DMA line coincide in the $32 area, an important level to watch on pullbacks. The Finance - Consumer/Commercial Loans firm has maintained a great track record of annual and quarterly sales revenues and earnings increases. It was featured on 9/29/09 in yellow in the mid-day report (read here).
>>> The latest Featured Stock Update with an annotated graph appeared on 11/5/2009. click here.
|
|
C
A
S
I |
News |
Chart |
SEC
View all notes Alert
me of new notes
Company
Profile
|
CRM
- NYSE
Salesforce.com Inc
INTERNET - Internet Software & Services
|
$60.63
|
+1.87
|
1,237,417
61% DAV
2,012,800
|
8/16/2009
(Date
Featured) |
$47.12
(Price
Featured) |
PP = $45.59 |
G |
| MB = $47.87 |
Most Recent Note - 11/5/2009 5:17:22 PM
G - Quiet gains this week helped it find support at its 50 DMA line. Deterioration last week led to technical sell signals as it briefly violated its 50 DMA line, prior chart highs in the $59 area, and an upward trendline. Deterioration under its recent chart lows in the $56 area would raise more serious concerns and trigger more worrisome technical sell signals.
>>> The latest Featured Stock Update with an annotated graph appeared on 10/27/2009. click here.
|
|
C
A
S
I |
News |
Chart |
SEC
View all notes Alert
me of new notes
Company
Profile
|
EBIX
- NASDAQ
Ebix Inc
COMPUTER SOFTWARE & SERVICES - Business Software & Services
|
$53.65
|
-2.79
|
710,474
N/A
|
8/28/2009
(Date
Featured) |
$45.86
(Price
Featured) |
PP = $45.35 |
|
| MB = $47.62 |
Most Recent Note - 11/5/2009
It will be dropped from the Featured Stocks list tonight after a considerable loss today raised more serious concerns. Technically, it violated important support levels identified in the 11/02/09 analysis with an annotated graph in the Featured Stock Update section of the After Market Update. Fundamentally, results for the recently reported quarter ended Sept 30, 2009 showed sales revenues up only +15% and earnings +23% over the year ago period, continuing a worrisome pattern of decelerating growth and raised concerns by falling under the +25% guideline. Previously noted its negative reversal from all-time highs on 10/26/09, followed by more worrisome distributional pressure.
>>> The latest Featured Stock Update with an annotated graph appeared on 11/2/2009. click here.
|
|
C
A
S
I |
News |
Chart |
SEC
View all notes Alert
me of new notes
Company
Profile
|
GMCR
- NASDAQ
Green Mtn Coffee Roastrs
FOOD & BEVERAGE - Processed & Packaged Goods
|
$68.04
|
+1.22
|
931,238
77% DAV
1,213,500
|
10/5/2009
(Date
Featured) |
$71.11
(Price
Featured) |
PP = $75.89 |
G |
| MB = $79.68 |
Most Recent Note - 11/5/2009 5:22:06 PM
G - Small gain on lighter than average volume today, closing just above its 50 DMA line ($67.50) which was previously noted as an important support level to watch. Technically, it has also been hovering the past few sessions near an upward trendline connecting its March-September lows. Further deterioration under recent lows near $65 would raise more serious concerns that its previously strong uptrend has gone cold.
>>> The latest Featured Stock Update with an annotated graph appeared on 10/29/2009. click here.
|
|
C
A
S
I |
News |
Chart |
SEC
View all notes Alert
me of new notes
Company
Profile
|
PEGA
- NASDAQ
Pegasystems Inc
COMPUTER SOFTWARE & SERVICES - Business Software & Services
|
$29.39
|
+1.64
|
469,915
N/A
|
9/9/2009
(Date
Featured) |
$31.14
(Price
Featured) |
PP = $33.35 |
|
| MB = $35.02 |
Most Recent Note - 11/5/2009
Posted a solid gain today with above average volume. Based on weak action it will be dropped from the Featured Stocks list tonight. A steep decline on 11/04/09 after reporting results for the quarter ended Sept 30, 2009 led to it briefly undercutting its June-July highs. Prior resistance in the $27 area has been noted as an important chart support level. It would need to rally back above its 50 DMA line for its outlook to improve.
>>> The latest Featured Stock Update with an annotated graph appeared on 11/4/2009. click here.
|
|
C
A
S
I |
News |
Chart |
SEC
View all notes Alert
me of new notes
Company
Profile
|
|
|
|
THESE ARE NOT BUY RECOMMENDATIONS!
Comments contained in the body of this report are technical
opinions only. The material herein has been obtained
from sources believed to be reliable and accurate, however,
its accuracy and completeness cannot be guaranteed.
This site is not an investment advisor, hence it does
not endorse or recommend any securities or other investments.
Any recommendation contained in this report may not
be suitable for all investors and it is not to be deemed
an offer or solicitation on our part with respect to
the purchase or sale of any securities. All trademarks,
service marks and trade names appearing in this report
are the property of their respective owners, and are
likewise used for identification purposes only.
This report is a service available
only to active Paid Premium Members.
You may opt-out of receiving report notifications
at any time. Questions or comments may be submitted
by writing to Premium Membership Services 665 S.E. 10 Street, Suite 201 Deerfield Beach, FL 33441-5634 or by calling 1-800-965-8307
or 954-785-1121.
|
|
|


