You are not logged in.
This means you
CAN ONLY VIEW reports that were published prior to Monday, April 14, 2025.
You
MUST UPGRADE YOUR MEMBERSHIP if you want to see any current reports.
AFTER MARKET UPDATE - WEDNESDAY, NOVEMBER 4TH, 2009
Previous After Market Report Next After Market Report >>>
|
|
|
|
DOW |
+30.23 |
9,802.14 |
+0.31% |
|
Volume |
1,350,077,700 |
-2% |
|
Volume |
2,266,940,510 |
+3% |
|
NASDAQ |
-1.80 |
2,055.52 |
-0.09% |
|
Advancers |
1,622 |
52% |
|
Advancers |
1,088 |
38% |
|
S&P 500 |
+1.09 |
1,046.50 |
+0.10% |
|
Decliners |
1,400 |
45% |
|
Decliners |
1,642 |
58% |
|
Russell 2000 |
-7.50 |
563.12 |
-1.31% |
|
52 Wk Highs |
57 |
|
|
52 Wk Highs |
44 |
|
|
S&P 600 |
-3.73 |
298.94 |
-1.23% |
|
52 Wk Lows |
5 |
|
|
52 Wk Lows |
29 |
|
|
 |
Investors Defensive While New Rally Attempt Awaits Follow-Through
Adam Sarhan, Contributing Writer,
The major averages experienced another see-saw session after the latest round of economic data was released and the Federal Reserve decided to keep rates near historic lows. Volume picked up in the final hour and was reported higher on the Nasdaq exchange while NYSE volume was reported near but just under the prior session total. Advancers led decliners by an 8-to-7 ratio on the NYSE, but decliners outnumbered advancers by a 3-to-2 ratio on the Nasdaq exchange. There were 16 high-ranked companies from the CANSLIM.net Leaders List making a new 52-week high and appearing on the CANSLIM.net BreakOuts Page, higher than the 10 issue that appeared on the prior session. In terms of new leadership, the recent action has yielded very little, however new 52-week highs are still outnumbering new 52-week lows on the NYSE and Nasdaq exchange.
At 8:30AM ET, ADP released its monthly employment report which is used as a good proxy for how the jobs market fared each month and closely mirrors the Labor Department's official nonfarm payrolls report released on the first Friday of each month. ADP said US employers slashed -203,000 jobs in October, which was lower than the Street's estimate of a -227,000 decline. They also upwardly revised September's reading to a decline of -254,000. The stronger than expected report led many to believe that Friday's official report will err on the side of fewer, rather than more, job cuts. Then, at 10:00AM ET, the ISM released its service sector index which at 50.6 signaled growth and was in line with the Street's average forecast. Readings above 50 signal growth and readings below 50 signal contraction.
A few hours later, at 2:15PM ET, the Federal Reserve surprised no one when they decided to keep rates steady near historic lows as the economy continues to "recover." In their after meeting commentary the Fed signaled that the economy continues to "pick up" and that the housing market continues to improve which is a key ingredient to a sustained recovery. The Fed warned that rising unemployment and hard-to-get-credit for many people and companies could curb the rebound in the near future. Bloomberg.com reported that the "Fed has now entered into a new phase -- managing the recovery rather than fighting the worst recession and financial crisis to hit the country since the Great Depression." Last week, the government reported that the economy grew last quarter, which was the first sign of growth in more than a year! Unemployment remains a primary concern as it hovers near a 26-year high of +9.8% and will probably tick higher to +9.9% when the government releases October's official results on Friday.
Wednesday marked Day 3 of the current rally attempt which opens the window for a new follow-through day (FTD) to occur. We have received a lot of questions about what exactly is needed in order for a new FTD to occur. Going forward, as long as Monday's (Day 1) lows are not taken out then this rally-attempt remains intact and a proper FTD could emerge. A FTD occurs anytime after Day 3 of a new rally attempt and requires that at least one of the major averages advances by at least +1.7% on higher volume than the prior session. Preferably, one would like to see a concurrent new batch of high-ranked leadership trigger fresh technical buy signals on or shortly after a new FTD. Assuming these criteria are met, then a new rally is confirmed which means that 3 out of 4 stocks will probably rally higher.
PICTURED: The NYSE Composite Index may be forming a bearish head-and-shoulders topping pattern. Losses undercutting the neckline could send a more worrisome message as to the market's deteriorating health, prompting investors into a more defensive posture.
|
|
|
 |
Healthcare Group Posts Standout Gain With Rally Above 50-Day Average
Kenneth J. Gruneisen - Passed the CAN SLIM® Master's Exam
Financial shares were among Wednesday's laggards as the Bank Index ($BKX -2.14%) and Broker/Dealer Index ($XBD -0.69%) continued sputtering, as previously noted, well below their respective 50-day moving average (DMA) lines. The Biotechnology Index ($BTK -1.71%) gave back about half of the prior session's solid gain and the Internet Index ($IIX -0.07%) edged lower, meanwhile the Networking Index ($NWX +0.26%) and the Semiconductor Index ($SOX +0.62%) posted modest gains. Commodity-linked areas were mixed as the Gold & Silver Index ($XAU +0.79%) added modestly to the prior session's big gain, yet the Integrated Oil Index ($XOI +0.31%) posted a small gain and the Oil Services Index ($OSX -1.20%) lost ground.
Charts courtesy www.stockcharts.com
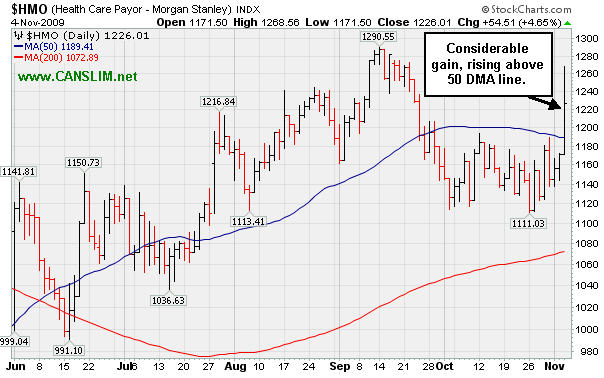
PICTURED 1: The Healthcare Index ($HMO +4.65%) was a standout gainer as it posted a large gain and rallied back above its 50-day moving average (DMA) line.
Charts courtesy www.stockcharts.com
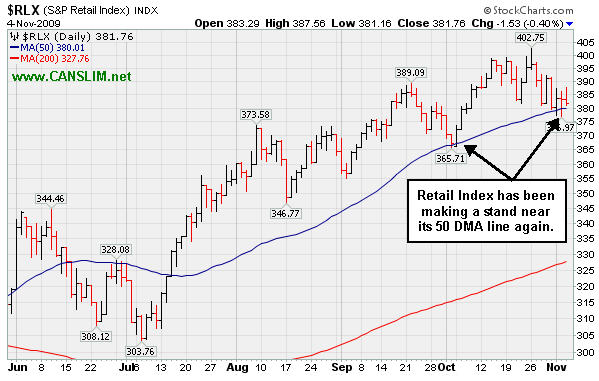
PICTURED 2: The Retail Index ($RLX -0.40%) has been making a stand at its 50 DMA line again. It held up at that important short-term average in early October.
| Oil Services |
$OSX |
191.74 |
-2.32 |
-1.20% |
+57.95% |
| Healthcare |
$HMO |
1,226.01 |
+54.51 |
+4.65% |
+27.69% |
| Integrated Oil |
$XOI |
1,073.26 |
+3.31 |
+0.31% |
+9.55% |
| Semiconductor |
$SOX |
295.31 |
+1.83 |
+0.62% |
+39.19% |
| Networking |
$NWX |
221.15 |
+0.69 |
+0.31% |
+53.61% |
| Internet |
$IIX |
213.16 |
-0.14 |
-0.07% |
+59.35% |
| Broker/Dealer |
$XBD |
111.89 |
-0.78 |
-0.69% |
+44.43% |
| Retail |
$RLX |
381.76 |
-1.53 |
-0.40% |
+36.70% |
| Gold & Silver |
$XAU |
169.67 |
+1.33 |
+0.79% |
+37.00% |
| Bank |
$BKX |
41.71 |
-0.91 |
-2.14% |
-5.89% |
| Biotech |
$BTK |
859.31 |
-14.96 |
-1.71% |
+32.78% |
|
|
|
 |
Latest Earnings News Fails To Help Slumping Software Stock
Kenneth J. Gruneisen - Passed the CAN SLIM® Master's Exam
Pegasystems Inc (PEGA -$0.87 or -3.14% to $27.75) suffered a loss today with almost 6 times average volume after opening the session with a steep decline following its results for the period ended Sept 30, 2009, yet it rebounded considerably from its early lows after briefly undercutting its June-July highs. It flashed worrisome technical sell signals last week while violating its 50-day moving average (DMA) line and sinking below an upward trendline connecting its July-October lows. Since its 10/23/09 appearance in this FSU section under the headline "Quiet Consolidation Near Important Support Level" its subsequent losses on above average volume have been noted as signs of distribution. Prior resistance in the $27 area is an important chart support level for it to find prompt support. Additional damaging losses would hurt its outlook. It would need to rally back above its 50 DMA for its outlook to improve.
This high-ranked Computer Software - Financial firm attracted an increasing number of institutional investors, as the number of top-rated funds owning its shares rose from 43 in Sep '08 to 80 in Jun '09, which is a solid reassurance concerning the investment system's I criteria. PEGA has shown good sales revenues increases and its earnings increases were well above the +25% guideline in the 4 last quarterly comparisons versus the year ago period. The previously noted downturn in annual earnings (the A criteria) from 2003 to 2006 has been followed by a solid turn around and big earnings increases in '07 and '08, and Street expectations for '09 are calling for well above +25% growth.

|
|
|
Color Codes Explained :
Y - Better candidates highlighted by our
staff of experts.
G - Previously featured
in past reports as yellow but may no longer be buyable under the
guidelines.
***Last / Change / Volume quote data in this table corresponds with the timestamp on the note***
Symbol/Exchange
Company Name
Industry Group |
Last |
Chg. |
Vol
% DAV |
Date Featured |
Price Featured |
Latest Pivot Point
Featured |
Status |
| Latest Max Buy Price |
ARO
- NYSE
Aeropostale Inc
RETAIL - Apparel Stores
|
$38.03
|
-0.22
|
2,882,071
110% DAV
2,609,200
|
8/21/2009
(Date
Featured) |
$39.21
(Price
Featured) |
PP = $44.95 |
G |
| MB = $47.20 |
Most Recent Note - 11/4/2009 4:52:12 PM
G - Reversed early gains for a small loss today on near average but slightly higher volume, finishing the session back under its July 20th high close. Last week's previously noted technical sell signals and deterioration negated its 8/21/09 technical breakout with a close below July's highest close (its highest pre-breakout close).
>>> The latest Featured Stock Update with an annotated graph appeared on 11/3/2009. click here.
|
|
C
A
S
I |
News |
Chart |
SEC
View all notes Alert
me of new notes
Company
Profile
|
ARST
-
|
$24.47
|
+0.18
|
270,434
40% DAV
670,900
|
9/1/2009
(Date
Featured) |
$19.91
(Price
Featured) |
PP = $20.90 |
G |
| MB = $21.95 |
Most Recent Note - 11/4/2009 4:53:18 PM
G - On very light volume for the past week it has continued consolidating in a tight trading range above its 50 DMA line and very near all-time highs. ARST traded up more than +30% since it was first featured in yellow at $19.91 in the 9/01/09 mid-day report with an annotated daily graph (read here).
>>> The latest Featured Stock Update with an annotated graph appeared on 10/21/2009. click here.
|
|
C
A
S
I |
News |
Chart |
SEC
View all notes Alert
me of new notes
Company
Profile
|
ASIA
-
|
$22.76
|
+0.63
|
1,090,630
135% DAV
805,700
|
10/14/2009
(Date
Featured) |
$23.05
(Price
Featured) |
PP = $22.19 |
Y |
| MB = $23.30 |
Most Recent Note - 11/4/2009 4:54:03 PM
Y - Gain today on slightly above average volume while consolidating since its big 10/29/09 gap up on solid earnings and raised guidance. It found prompt support near its 50 DMA line (a textbook chart support level) after a 7 session losing streak with losses on high volume briefly negated its latest breakout. Color code was changed to yellow based on impressive fundamentals and technical strength, however market conditions (M criteria) are a concern until a new follow-through-day occurs. Featured 10/14/09 in the mid-day report (read here) as it gapped up for a new 52-week high with 5 times average volume, triggering a technical buy signal by blasting above its pivot point. First featured in the August 2009 CANSLIM.net News (read here).
>>> The latest Featured Stock Update with an annotated graph appeared on 10/30/2009. click here.
|
|
C
A
S
I |
News |
Chart |
SEC
View all notes Alert
me of new notes
Company
Profile
|
BIDU
- NASDAQ
Baidu Inc Ads
INTERNET - Internet Information Providers
|
$386.37
|
+3.33
|
1,582,350
82% DAV
1,932,400
|
9/8/2009
(Date
Featured) |
$351.80
(Price
Featured) |
PP = $368.59 |
G |
| MB = $387.02 |
Most Recent Note - 11/4/2009 5:02:22 PM
G - Second consecutive gain today on light volume, quietly hovering near its 50 DMA line. Volume spiked to 5 times normal on 10/27/09 as it gapped down for a considerable loss following its latest earnings report. As recently noted, "Choppy action has not allowed it to form a sound base in recent weeks." BIDU traded up as much as +23% from its price when featured in yellow in the 9/08/09 Mid-Day BreakOuts Report (read here).
>>> The latest Featured Stock Update with an annotated graph appeared on 10/28/2009. click here.
|
|
C
A
S
I |
News |
Chart |
SEC
View all notes Alert
me of new notes
Company
Profile
|
CACC
- NASDAQ
Credit Acceptance Corp
FINANCIAL SERVICES - Credit Services
|
$34.35
|
-0.26
|
28,296
74% DAV
38,200
|
9/29/2009
(Date
Featured) |
$33.48
(Price
Featured) |
PP = $32.60 |
G |
| MB = $34.23 |
Most Recent Note - 11/4/2009 5:03:46 PM
G - Quietly consolidating since its impressive positive reversal was noted on 11/02/09. Market conditions (M criteria) are an overriding concern suggesting that investors hold off on any new buying efforts until a new rally with follow through day occurs. Prior chart highs and its 50 DMA line coincide in the $32 area, an important level to watch on pullbacks. The Finance - Consumer/Commercial Loans firm has maintained a great track record of annual and quarterly sales revenues and earnings increases. It was featured on 9/29/09 in yellow in the mid-day report (read here).
>>> The latest Featured Stock Update with an annotated graph appeared on 10/15/2009. click here.
|
|
C
A
S
I |
News |
Chart |
SEC
View all notes Alert
me of new notes
Company
Profile
|
CRM
- NYSE
Salesforce.com Inc
INTERNET - Internet Software & Services
|
$58.76
|
+0.17
|
1,208,068
60% DAV
2,012,800
|
8/16/2009
(Date
Featured) |
$47.12
(Price
Featured) |
PP = $45.59 |
G |
| MB = $47.87 |
Most Recent Note - 11/4/2009 5:04:58 PM
G - Quietly consolidating just above its 50 DMA line, while today's volume total was even lighter. Deterioration last week led to technical sell signals as it violated prior chart highs in the $59 area and an upward trendline connecting its July, August and October chart lows.
>>> The latest Featured Stock Update with an annotated graph appeared on 10/27/2009. click here.
|
|
C
A
S
I |
News |
Chart |
SEC
View all notes Alert
me of new notes
Company
Profile
|
EBIX
- NASDAQ
Ebix Inc
COMPUTER SOFTWARE & SERVICES - Business Software & Services
|
$56.44
|
-1.99
|
1,012,658
453% DAV
223,700
|
8/28/2009
(Date
Featured) |
$45.86
(Price
Featured) |
PP = $45.35 |
G |
| MB = $47.62 |
Most Recent Note - 11/4/2009 5:06:09 PM
G - Gapped down today and suffered another damaging loss on heavy volume after reporting results for the quarter ended Sept 30, 2009 which showed sales revenues up only +15% and earnings +23% over the year ago period. That continued a worrisome pattern of decelerating growth and raised concerns by falling under the +25% guideline. Previously noted its negative reversal from all-time highs on 10/26/09, followed by more worrisome distributional pressure. It is now testing prior chart highs and its 50 DMA line coinciding in the $54 area previously noted as the next important support level to watch.
>>> The latest Featured Stock Update with an annotated graph appeared on 11/2/2009. click here.
|
|
C
A
S
I |
News |
Chart |
SEC
View all notes Alert
me of new notes
Company
Profile
|
GMCR
- NASDAQ
Green Mtn Coffee Roastrs
FOOD & BEVERAGE - Processed & Packaged Goods
|
$66.82
|
-1.93
|
929,150
77% DAV
1,213,500
|
10/5/2009
(Date
Featured) |
$71.11
(Price
Featured) |
PP = $75.89 |
G |
| MB = $79.68 |
Most Recent Note - 11/4/2009 5:09:39 PM
G - Loss on lighter than average volume today, closing just under its 50 DMA line ($67.50) again, which was previously noted as an important support level to watch. Technically, it has also been hovering the past few sessions near an upward trendline connecting its March-September lows. Further deterioration would raise more concerns that its previously strong uptrend has gone cold.
>>> The latest Featured Stock Update with an annotated graph appeared on 10/29/2009. click here.
|
|
C
A
S
I |
News |
Chart |
SEC
View all notes Alert
me of new notes
Company
Profile
|
PEGA
- NASDAQ
Pegasystems Inc
COMPUTER SOFTWARE & SERVICES - Business Software & Services
|
$27.75
|
-0.87
|
1,825,293
573% DAV
318,600
|
9/9/2009
(Date
Featured) |
$31.14
(Price
Featured) |
PP = $33.35 |
G |
| MB = $35.02 |
Most Recent Note - 11/4/2009 5:11:57 PM
G - Opened the session with a steep decline after reporting results for the quarter ended Sept 30, 2009. After briefly undercutting its June-July highs it closed in the middle of its intra-day range. Prior resistance in the $27 area has been noted as an important chart support level, while additional damaging losses would hurt its outlook.
>>> The latest Featured Stock Update with an annotated graph appeared on 11/4/2009. click here.
|
|
C
A
S
I |
News |
Chart |
SEC
View all notes Alert
me of new notes
Company
Profile
|
|
|
|
THESE ARE NOT BUY RECOMMENDATIONS!
Comments contained in the body of this report are technical
opinions only. The material herein has been obtained
from sources believed to be reliable and accurate, however,
its accuracy and completeness cannot be guaranteed.
This site is not an investment advisor, hence it does
not endorse or recommend any securities or other investments.
Any recommendation contained in this report may not
be suitable for all investors and it is not to be deemed
an offer or solicitation on our part with respect to
the purchase or sale of any securities. All trademarks,
service marks and trade names appearing in this report
are the property of their respective owners, and are
likewise used for identification purposes only.
This report is a service available
only to active Paid Premium Members.
You may opt-out of receiving report notifications
at any time. Questions or comments may be submitted
by writing to Premium Membership Services 665 S.E. 10 Street, Suite 201 Deerfield Beach, FL 33441-5634 or by calling 1-800-965-8307
or 954-785-1121.
|
|
|


