You are not logged in.
This means you
CAN ONLY VIEW reports that were published prior to Monday, April 14, 2025.
You
MUST UPGRADE YOUR MEMBERSHIP if you want to see any current reports.
AFTER MARKET UPDATE - FRIDAY, NOVEMBER 2ND, 2012
Previous After Market Report Next After Market Report >>>
|
|
|
|
DOW |
-139.46 |
13,093.16 |
-1.05% |
|
Volume |
793,034,600 |
-1% |
|
Volume |
1,765,801,880 |
-3% |
|
NASDAQ |
-37.93 |
2,982.13 |
-1.26% |
|
Advancers |
908 |
29% |
|
Advancers |
662 |
26% |
|
S&P 500 |
-13.39 |
1,414.20 |
-0.94% |
|
Decliners |
2,123 |
68% |
|
Decliners |
1,779 |
70% |
|
Russell 2000 |
-13.48 |
814.37 |
-1.63% |
|
52 Wk Highs |
140 |
|
|
52 Wk Highs |
71 |
|
|
S&P 600 |
-2.41 |
461.28 |
-0.52% |
|
52 Wk Lows |
39 |
|
|
52 Wk Lows |
48 |
|
|
 |
Major Averages Lost Ground After Erasing Early Gains
Kenneth J. Gruneisen - Passed the CAN SLIM® Master's Exam
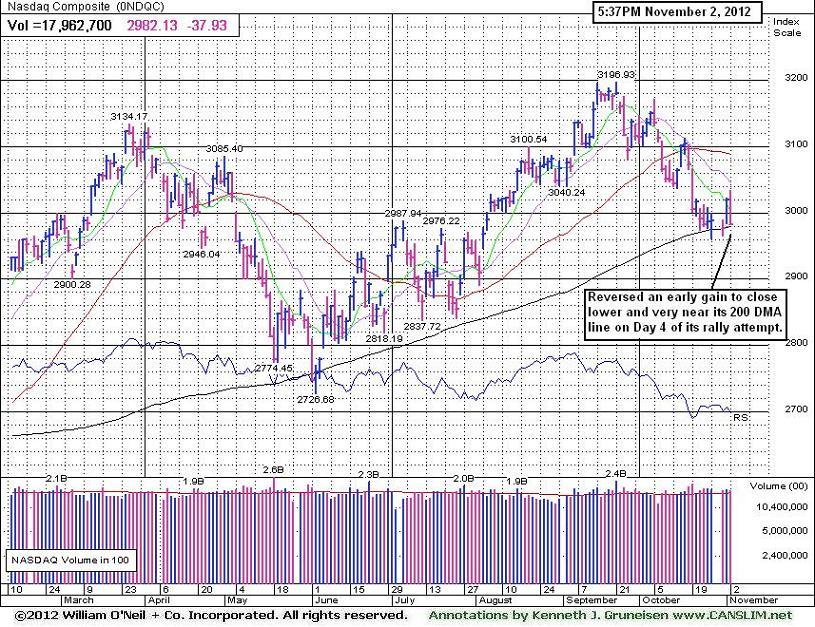
For the shortened trading week the Dow Jones Industrial Average rose +0.1%, the benchmark S&P 500 Index was up +0.4%, and the Nasdaq Composite Index was flat. On Friday's session the major averages lost ground, yet they remained above their recent chart lows, keeping the nascent rally attempt intact while still awaiting confirming gains. The volume totals were reported slightly lower on the NYSE and on the Nasdaq exchange versus the prior session's totals. Breadth was negative as decliners led advancers by more than a 2-1 margin on the NYSE and by nearly 3-1 on the Nasdaq exchange. The total number of stocks hitting new 52-week highs outnumbered new 52-week lows on the NYSE and on the Nasdaq exchange. There were 63 high-ranked companies from the CANSLIM.net Leaders List making new 52-week highs and appearing on the CANSLIM.net BreakOuts Page, down from the prior session total of 70 stocks. There were gains for 4 of the 17 high-ranked companies currently included on the Featured Stocks Page.
A better-than-expected result in the highly anticipated jobs report had little lasting effect on stocks. The employment situation improved with non-farm payrolls expanding by 171,000 jobs and private payrolls adding 184,000 positions in October. In addition, the unemployment rate rose to 7.9% from the September reading of 7.8%.
Nine of the 10 sectors on the S&P ended lower, led by declines in Material stocks. Shares of Newmont Mining Corp (NEM -8.42%) and Barrick Gold Corp (ABX -3.60%) fell hard as gold prices fell $36.80 to $1,678.70 an ounce. Energy stocks were also under pressure as crude oil shed $2.12 to $84.97 per barrel. Chevron Corp (CVX -2.77%) ended lower after the company fell short of analysts' expectations in their quarterly earnings. American International Group, Inc. (AIG -7.16%) was smacked for a large loss following their earnings report. The McGraw-Hill Companies, Inc (MHP -3.66%) and Penske Automotive Group Inc (PAG -8.54%) each also fell after both companies missed analysts' expectations in the quarter.
The Retail group was helped by gains in consumer stocks. Shares of Starbucks corp (SBUX +9.05%) were up considerably after the company posted a better-than-expected profit tally and raised its full year earnings guidance. Ralph Lauren Corp (RL +1.08%) rose following their better-than-expected profit tally. LinkedIn (LNKD -0.07%) erased an early gain to finish flat following its stronger than expected quarterly result. In other news, Restoration Hardware Holdings (RH +29.58%) shares surged $7.10 to $31.10 in their first day of trading.
Turning to fixed income, Treasuries finished relatively unchanged with the 10-year note up 3/32 to yield 1.72%.
Monday's session will mark Day 5 for the Nasdaq Composite Index's rally attempt from its low hit on 10/26/12. Monday marks Day 6 for the Dow's rally attempt and Day 4 for the S&P 500 Index. The window is open for an ideal follow-through day provided that the indices' recent lows are not undercut, which would reset their day counts.
During market corrections the M criteria argues against new buying efforts and urges investors to take a defensive stance to protect precious capital. That stance can change back to a bullish stance where buying is encouraged when at least one of the three major averages produces a solid follow-through day (FTD). A FTD confirming a new rally requires substantial gains on higher (ideally above average) volume, coupled with healthy leadership and a respectable number of stocks hitting new 52-week highs. Historic studies have shown that a FTD occurring between Days 4-7 of a new rally effort has often signaled the beginning of the most substantial market rallies.
Investors should always limit losses if ever any stock falls more than -7% from their purchase price. Following strict sell rules is precisely how this fact-based investment system prompts investors to reduce exposure and protect cash during market downturns. Keep a watchlist of strong acting stocks with all-key criteria in anticipation of the next confirmed uptrend. See the noteworthy candidates included on the Featured Stocks Page.
Watch for an announcement via email concerning the next WEBCAST. The webcast will also be available via an updated link highlighted at the top of the Premium Member Homepage.
PICTURED: The Nasdaq Composite Index erased an early gain to finish lower and near its 200-day moving average (DMA) line on Day 4 of its current rally attempt. In this commentary we will continue to watch closely for confirming gains within the ideal window for a proper FTD, meanwhile caution and patience are required.
|
 Kenneth J. Gruneisen started out as a licensed stockbroker in August 1987, a couple of months prior to the historic stock market crash that took the Dow Jones Industrial Average down -22.6% in a single day. He has published daily fact-based fundamental and technical analysis on high-ranked stocks online for two decades. Through FACTBASEDINVESTING.COM, Kenneth provides educational articles, news, market commentary, and other information regarding proven investment systems that work in good times and bad.
Comments contained in the body of this report are technical opinions only and are not necessarily those of Gruneisen Growth Corp. The material herein has been obtained from sources believed to be reliable and accurate, however, its accuracy and completeness cannot be guaranteed. Our firm, employees, and customers may effect transactions, including transactions contrary to any recommendation herein, or have positions in the securities mentioned herein or options with respect thereto. Any recommendation contained in this report may not be suitable for all investors and it is not to be deemed an offer or solicitation on our part with respect to the purchase or sale of any securities. |
|
 |
Retail Index Rose While Tech and Commodity-Linked Groups Led Decliners
Kenneth J. Gruneisen - Passed the CAN SLIM® Master's Exam
The Retail Index ($RLX +1.07%) was a standout gainer on Friday. Meanwhile the tech sector weighed on the major averages as the Networking Index ($NWX -2.54%), Semiconductor Index ($SOX -1.89%), Biotechnology Index ($BTK -1.40%), and the Internet Index ($IIX -0.78%) suffered unanimous losses. Weakness in energy-related shares dragged the Oil Services Index ($OSX -1.71%) and the Integrated Oil Index ($XOI -1.16%) lower. Financial shares also backpedaled as the Bank Index ($BKX -0.71%) and the Broker/Dealer Index ($XBD -0.35%) suffered modest losses. The Healthcare Index ($HMO -0.66%) edged lower, rounding out the mostly negative session.
Charts courtesy www.stockcharts.com
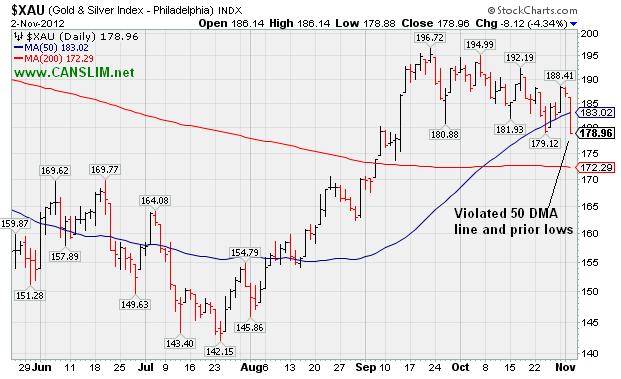
PICTURED: The Gold & Silver Index ($XAU -4.34%) was a standout decliner on Friday. The dollar was stronger after the somewhat favorable jobs data led traders to conclude that the Fed might feel less pressure to take additional measures aimed at stimulating the economy.
| Oil Services |
$OSX |
215.51 |
-3.75 |
-1.71% |
-0.36% |
| Healthcare |
$HMO |
2,473.04 |
-16.50 |
-0.66% |
+8.39% |
| Integrated Oil |
$XOI |
1,225.23 |
-14.43 |
-1.16% |
-0.32% |
| Semiconductor |
$SOX |
372.31 |
-7.19 |
-1.89% |
+2.16% |
| Networking |
$NWX |
197.14 |
-5.14 |
-2.54% |
-8.37% |
| Internet |
$IIX |
308.02 |
-2.43 |
-0.78% |
+9.33% |
| Broker/Dealer |
$XBD |
85.99 |
-0.30 |
-0.35% |
+3.26% |
| Retail |
$RLX |
656.79 |
+6.93 |
+1.07% |
+25.53% |
| Gold & Silver |
$XAU |
178.96 |
-8.12 |
-4.34% |
-0.93% |
| Bank |
$BKX |
50.09 |
-0.36 |
-0.71% |
+27.20% |
| Biotech |
$BTK |
1,412.68 |
-20.12 |
-1.40% |
+29.43% |
|
|
|
 |
New High Today Followed By Negative Reversal
Kenneth J. Gruneisen - Passed the CAN SLIM® Master's Exam
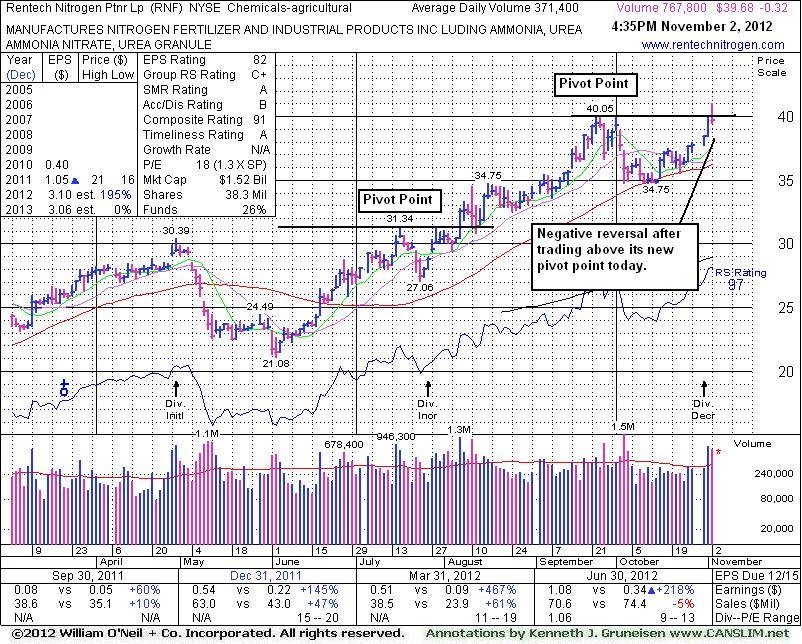
Rentech Nitrogen Ptnr LP (RNF -$0.33 or -.92% to $35.59) touched a new 52-week high today, but a negative reversal led to a loss with above average volume which broke a streak of 5 consecutive gains. It recently found support at its 50-day moving average (DMA) line defining important near-term support.
Its Accumulation/Distribution Rating has improved to a B rating from a D+ when it made its last appearance in this FSU section on 10/04/12 with an annotated graph under the headline, "Distributional Pressure Violated Upward Trendline". A volume-driven loss had violated an upward trendline defining near-term chart support in the $37 area, yet it made a stand at it 50 DMA line and formed a new base of sufficient length. On 11/01/12 its color code was changed to yellow with a new pivot point cited based on its 9/25/12 high plus 10 cents, yet it was cautiously noted - "Volume-driven gains above its pivot point may trigger a new (or add-on) technical buy signal. Disciplined investors know to watch for the market direction (M criteria) to produce a FTD and be noted as favorable again before acting on any new buy candidates."
On 8/07/12 it triggered a technical buy signal with its considerable gain backed by +266% above average volume as it rallied above its earlier pivot point into new high territory. It traded as much as +35.4% higher within less than 2 months afterward. The number of top-rated funds owning its shares rose from 42 in Dec '11 to 50 as of Sep '12, a reassuring sign concerning the I criteria. Its current Up/Down Volume Ratio of 1.4 is also an unbiased indication that its shares have been under accumulation over the past 50 days.
|
|
|
Color Codes Explained :
Y - Better candidates highlighted by our
staff of experts.
G - Previously featured
in past reports as yellow but may no longer be buyable under the
guidelines.
***Last / Change / Volume data in this table is the closing quote data***
Symbol/Exchange
Company Name
Industry Group |
PRICE |
CHANGE
(%Change) |
Day High |
Volume
(% DAV)
(% 50 day avg vol) |
52 Wk Hi
% From Hi |
Featured
Date |
Price
Featured |
Pivot Featured |
|
Max Buy |
ASPS
-
NASDAQ
Altisource Ptf Sltns Sa
REAL ESTATE - Property Management/Developmen
|
$111.00
|
+0.66
0.60% |
$114.87
|
113,260
53.00% of 50 DAV
50 DAV is 213,700
|
$129.72
-14.43%
|
9/24/2012
|
$87.24
|
PP = $92.39
|
|
MB = $97.01
|
Most Recent Note - 11/1/2012 6:05:11 PM
G - Pulled back from its 52-week and all-time highs with higher volume behind a 4th consecutive loss today. Previously noted - "Very extended from its prior base, its prior highs in the $92 area define initial support to watch on pullbacks."
>>> The latest Featured Stock Update with an annotated graph appeared on 10/12/2012. Click here.
View all notes |
Alert me of new notes |
CANSLIM.net Company Profile |
SEC |
Zacks Reports |
StockTalk |
News |
Chart |
Request a new note
C
A N
S L
I M


|
BRLI
-
NASDAQ
Bio Reference Labs Inc
HEALTH SERVICES - Medical Laboratories and Researc
|
$28.13
|
-0.00
-0.01% |
$28.50
|
301,657
88.18% of 50 DAV
50 DAV is 342,100
|
$32.86
-14.39%
|
10/3/2012
|
$30.90
|
PP = $30.25
|
|
MB = $31.76
|
Most Recent Note - 11/1/2012 6:06:34 PM
G - Small gain today halted a streak of 7 consecutive losses. Undercut prior highs in the $30 area and violated its 50 DMA line triggering technical sell signals and raising serious concerns.
>>> The latest Featured Stock Update with an annotated graph appeared on 10/8/2012. Click here.
View all notes |
Alert me of new notes |
CANSLIM.net Company Profile |
SEC |
Zacks Reports |
StockTalk |
News |
Chart |
Request a new note
C
A N
S L
I M
|
CFNL
-
NASDAQ
Cardinal Financial Corp
BANKING - Regional - Southeast Banks
|
$15.66
|
-0.18
-1.14% |
$15.93
|
242,904
224.50% of 50 DAV
50 DAV is 108,200
|
$16.07
-2.55%
|
8/17/2012
|
$12.84
|
PP = $13.31
|
|
MB = $13.98
|
 Most Recent Note - 11/2/2012 11:58:38 AM
G - Perched near its 52-week high today, holding its ground after getting extended from its prior base. Found support at its 50 DMA line in recent months.
>>> The latest Featured Stock Update with an annotated graph appeared on 10/25/2012. Click here.
View all notes |
Alert me of new notes |
CANSLIM.net Company Profile |
SEC |
Zacks Reports |
StockTalk |
News |
Chart |
Request a new note
C
A N
S L
I M
|
CMCSA
-
NASDAQ
Comcast Corp Cl A
MEDIA - CATV Systems
|
$37.61
|
+0.06
0.16% |
$37.96
|
14,147,895
115.32% of 50 DAV
50 DAV is 12,268,100
|
$37.95
-0.90%
|
6/11/2012
|
$29.94
|
PP = $30.98
|
|
MB = $32.53
|
Most Recent Note - 11/1/2012 6:15:21 PM
G - Touched another new 52-week high today. Reported earnings +39% on +15% sales revenues for the Sep '12 quarter, a reassuring follow-up to the previously noted sub par quarter. Upward trendline and 50 DMA line define near term support where violations would trigger technical sell signals.
>>> The latest Featured Stock Update with an annotated graph appeared on 10/24/2012. Click here.
View all notes |
Alert me of new notes |
CANSLIM.net Company Profile |
SEC |
Zacks Reports |
StockTalk |
News |
Chart |
Request a new note
C
A N
S L
I M
|
DVA
-
NYSE
Davita Inc
HEALTH SERVICES - Specialized Health Services
|
$111.50
|
-0.86
-0.77% |
$112.93
|
618,638
76.74% of 50 DAV
50 DAV is 806,200
|
$114.85
-2.92%
|
9/5/2012
|
$102.92
|
PP = $100.62
|
|
MB = $105.65
|
Most Recent Note - 10/31/2012 4:32:17 PM
G - Reported earnings +3% on +12% sales for the Sep '12 quarter, below the guidelines of the fact-based system. Hit a new 52-week high today with a gain backed by above average volume, getting more extended from its latest sound base. Prior highs near $100 and its 50 DMA line define near-term support to watch on pullbacks where violations may trigger technical sell signals.
>>> The latest Featured Stock Update with an annotated graph appeared on 10/10/2012. Click here.
View all notes |
Alert me of new notes |
CANSLIM.net Company Profile |
SEC |
Zacks Reports |
StockTalk |
News |
Chart |
Request a new note
C
A N
S L
I M
|
Symbol/Exchange
Company Name
Industry Group |
PRICE |
CHANGE
(%Change) |
Day High |
Volume
(% DAV)
(% 50 day avg vol) |
52 Wk Hi
% From Hi |
Featured
Date |
Price
Featured |
Pivot Featured |
|
Max Buy |
GPX
-
NYSE
G P Strategies Corp
DIVERSIFIED SERVICES - Education and Training Services
|
$19.46
|
+0.17
0.88% |
$19.95
|
62,319
105.98% of 50 DAV
50 DAV is 58,800
|
$20.67
-5.85%
|
10/8/2012
|
$20.00
|
PP = $20.77
|
|
MB = $21.81
|
Most Recent Note - 11/1/2012 6:11:35 PM
G - Reported earnings +0% on +12% sales revenues for the Sep '12 quarter, below the +25% minimum earnings guideline, raising fundamental concerns. Churned heavy volume while holding its ground, and its 50 DMA line acted as resistance.
>>> The latest Featured Stock Update with an annotated graph appeared on 10/16/2012. Click here.
View all notes |
Alert me of new notes |
CANSLIM.net Company Profile |
SEC |
Zacks Reports |
StockTalk |
News |
Chart |
Request a new note
C
A N
S L
I M
|
LKQ
-
NASDAQ
L K Q Corp
WHOLESALE - Auto Parts
|
$21.04
|
-0.68
-3.13% |
$21.95
|
1,632,364
102.51% of 50 DAV
50 DAV is 1,592,400
|
$21.90
-3.93%
|
8/9/2012
|
$18.97
|
PP = $18.72
|
|
MB = $19.66
|
Most Recent Note - 11/1/2012 6:09:21 PM
G - Rallied with above average volume today for a new 52-week high, and no resistance remains due to overhead supply. Showed impressive resilience and strength after reporting earnings +6% on +30% sales revenues for the Sep '12 quarter. Results below the +25% minimum earnings guideline (C criteria) raised fundamental concerns.
>>> The latest Featured Stock Update with an annotated graph appeared on 10/19/2012. Click here.
View all notes |
Alert me of new notes |
CANSLIM.net Company Profile |
SEC |
Zacks Reports |
StockTalk |
News |
Chart |
Request a new note
C
A N
S L
I M
|
MIDD
-
NASDAQ
Middleby Corp
MANUFACTURING - Diversified Machinery
|
$123.40
|
-3.16
-2.50% |
$127.89
|
62,130
81.54% of 50 DAV
50 DAV is 76,200
|
$127.06
-2.88%
|
10/8/2012
|
$118.46
|
PP = $122.67
|
|
MB = $128.80
|
Most Recent Note - 11/1/2012 6:08:28 PM
Y - Hit a new 52-week high with +41% above average volume behind today's 4th consecutive gain. Volume-driven gains above the pivot point confirmed a new (or add-on) technical buy signal, however the M criteria remains an overriding concern until a FTD confirms a new rally. Its 50 DMA line and recent lows define near-term chart support to watch.
>>> The latest Featured Stock Update with an annotated graph appeared on 10/22/2012. Click here.
View all notes |
Alert me of new notes |
CANSLIM.net Company Profile |
SEC |
Zacks Reports |
StockTalk |
News |
Chart |
Request a new note
C
A N
S L
I M
|
N
-
NYSE
Netsuite Inc
DIVERSIFIED SERVICES - Business/Management Services
|
$62.96
|
-1.24
-1.93% |
$64.92
|
294,572
57.02% of 50 DAV
50 DAV is 516,600
|
$67.02
-6.06%
|
8/20/2012
|
$55.88
|
PP = $59.32
|
|
MB = $62.29
|
Most Recent Note - 10/31/2012 12:53:04 PM
G - Reported earnings +60% on +31% sales revenues for the Sep '12 quarter. Pulling back today following a considerable 10/26/12 gap up and volume-driven gain from below its 50 DMA line for new 52-week and all-time highs. It did not form a sound new base pattern. Until the major averages are back in a confirmed rally the M criteria argues against any new buying efforts.
>>> The latest Featured Stock Update with an annotated graph appeared on 10/26/2012. Click here.
View all notes |
Alert me of new notes |
CANSLIM.net Company Profile |
SEC |
Zacks Reports |
StockTalk |
News |
Chart |
Request a new note
C
A N
S L
I M
|
NSM
-
NYSE
Nationstar Mtg Hldgs Inc
FINANCIAL SERVICES - Credit Services
|
$33.11
|
-1.10
-3.22% |
$35.00
|
962,678
62.35% of 50 DAV
50 DAV is 1,544,000
|
$37.20
-10.99%
|
8/29/2012
|
$27.96
|
PP = $28.85
|
|
MB = $30.29
|
Most Recent Note - 11/1/2012 5:57:00 PM
G - Finished near the session low today with a big loss on higher volume indicative of distributional pressure. It has not formed a sound new base pattern.
>>> The latest Featured Stock Update with an annotated graph appeared on 10/11/2012. Click here.
View all notes |
Alert me of new notes |
CANSLIM.net Company Profile |
SEC |
Zacks Reports |
StockTalk |
News |
Chart |
Request a new note
C
A N
S L
I M
|
Symbol/Exchange
Company Name
Industry Group |
PRICE |
CHANGE
(%Change) |
Day High |
Volume
(% DAV)
(% 50 day avg vol) |
52 Wk Hi
% From Hi |
Featured
Date |
Price
Featured |
Pivot Featured |
|
Max Buy |
OSIS
-
NASDAQ
O S I Systems Inc
ELECTRONICS - Semiconductor Equipment and Mate
|
$78.35
|
-0.79
-1.00% |
$80.01
|
67,916
59.63% of 50 DAV
50 DAV is 113,900
|
$81.23
-3.55%
|
9/5/2012
|
$74.39
|
PP = $75.10
|
|
MB = $78.86
|
Most Recent Note - 10/31/2012 4:38:44 PM
G - Recently found prompt support at its 50 DMA line, and it is still slightly extended from its prior base.
>>> The latest Featured Stock Update with an annotated graph appeared on 10/18/2012. Click here.
View all notes |
Alert me of new notes |
CANSLIM.net Company Profile |
SEC |
Zacks Reports |
StockTalk |
News |
Chart |
Request a new note
C
A N
S L
I M
|
RNF
-
NYSE
Rentech Nitrogen Ptnr Lp
CHEMICALS - Agricultural Chemicals
|
$39.68
|
-0.32
-0.80% |
$41.15
|
767,821
206.74% of 50 DAV
50 DAV is 371,400
|
$40.05
-0.92%
|
11/1/2012
|
$39.11
|
PP = $40.15
|
|
MB = $42.16
|
Most Recent Note - 11/2/2012 5:48:08 PM
Y - Touched a new 52-week high today, but a "negative reversal" led to a loss with above average volume which broke a streak of 5 consecutive gains. See the latest FSU analysis for more details and a new annotated graph.
>>> The latest Featured Stock Update with an annotated graph appeared on 11/2/2012. Click here.
View all notes |
Alert me of new notes |
CANSLIM.net Company Profile |
SEC |
Zacks Reports |
StockTalk |
News |
Chart |
Request a new note
C
A N
S L
I M
|
TDG
-
NYSE
Transdigm Group Inc
AEROSPACE/DEFENSE - Aerospace/Defense Products and; Services
|
$136.88
|
+0.31
0.23% |
$139.00
|
274,847
54.13% of 50 DAV
50 DAV is 507,800
|
$139.31
-1.75%
|
8/16/2012
|
$132.23
|
PP = $136.44
|
|
MB = $143.26
|
Most Recent Note - 11/1/2012 6:16:31 PM
G - Posted a gain today with below average volume. When noted on 10/23/12 it undercut its 50 DMA line following a special dividend, yet it promptly rebounded back above that important short-term average.
>>> The latest Featured Stock Update with an annotated graph appeared on 10/23/2012. Click here.
View all notes |
Alert me of new notes |
CANSLIM.net Company Profile |
SEC |
Zacks Reports |
StockTalk |
News |
Chart |
Request a new note
C
A N
S L
I M
|
ULTA
-
NASDAQ
Ulta Salon Cosm & Frag
SPECIALTY RETAIL - Specialty Retail, Other
|
$92.45
|
-1.26
-1.34% |
$94.13
|
415,629
56.94% of 50 DAV
50 DAV is 730,000
|
$103.52
-10.69%
|
9/4/2012
|
$93.17
|
PP = $98.52
|
|
MB = $103.45
|
Most Recent Note - 10/31/2012 5:18:51 PM
G - Still sputtering below its 50 DMA line, and a rebound above that important short-term average is needed for its outlook to improve. Its 200 DMA line ($90.20 now) defines near-term support to watch.
>>> The latest Featured Stock Update with an annotated graph appeared on 10/5/2012. Click here.
View all notes |
Alert me of new notes |
CANSLIM.net Company Profile |
SEC |
Zacks Reports |
StockTalk |
News |
Chart |
Request a new note
C
A N
S L
I M
|
ULTI
-
NASDAQ
Ultimate Software Group
INTERNET - Internet Software and Services
|
$95.16
|
-0.44
-0.46% |
$97.97
|
222,272
141.66% of 50 DAV
50 DAV is 156,900
|
$106.40
-10.56%
|
10/31/2012
|
$101.36
|
PP = $105.00
|
|
MB = $110.25
|
Most Recent Note - 11/1/2012 6:00:55 PM
G - Gapped down today and erased the prior session's gain, raising concerns while violating its 50 DMA line with a damaging loss on above average volume. Reported earnings +61% on +22% sales revenues for the Sep '12 quarter. Color code is changed to green, and a rebound above its 50 DMA is needed to improve its technical stance. Still building on a 9-week "double bottom" base pattern. See latest FSU analysis for more details and a new annotated graph.
>>> The latest Featured Stock Update with an annotated graph appeared on 10/31/2012. Click here.
View all notes |
Alert me of new notes |
CANSLIM.net Company Profile |
SEC |
Zacks Reports |
StockTalk |
News |
Chart |
Request a new note
C
A N
S L
I M
|
Symbol/Exchange
Company Name
Industry Group |
PRICE |
CHANGE
(%Change) |
Day High |
Volume
(% DAV)
(% 50 day avg vol) |
52 Wk Hi
% From Hi |
Featured
Date |
Price
Featured |
Pivot Featured |
|
Max Buy |
VSI
-
NYSE
Vitamin Shoppe Inc
SPECIALTY RETAIL - Specialty Retail, Other
|
$54.98
|
-2.98
-5.14% |
$58.40
|
298,424
112.61% of 50 DAV
50 DAV is 265,000
|
$61.83
-11.07%
|
10/15/2012
|
$57.82
|
PP = $60.08
|
|
MB = $63.08
|
Most Recent Note - 11/2/2012 3:01:16 PM
G - Slumping below its 50 DMA line again and its color code is changed to green. Subsequent volume-driven gains for new highs are needed to trigger a new technical buy signal.
>>> The latest Featured Stock Update with an annotated graph appeared on 10/15/2012. Click here.
View all notes |
Alert me of new notes |
CANSLIM.net Company Profile |
SEC |
Zacks Reports |
StockTalk |
News |
Chart |
Request a new note
C
A N
S L
I M
|
WPI
-
NYSE
Watson Pharmaceuticals
DRUGS - Drugs - Generic
|
$86.73
|
-0.98
-1.12% |
$89.32
|
938,187
101.37% of 50 DAV
50 DAV is 925,500
|
$90.00
-3.63%
|
8/24/2012
|
$82.90
|
PP = $81.10
|
|
MB = $85.16
|
Most Recent Note - 11/1/2012 6:04:27 PM
G - Touched a new 52-week high today, rallying with above average volume after testing support at its 50 DMA line. It has not formed a sound base and it is extended from a proper buy point under the fact-based system's guidelines. See the latest FSU analysis for more details and a new annotated graph.
>>> The latest Featured Stock Update with an annotated graph appeared on 11/1/2012. Click here.
View all notes |
Alert me of new notes |
CANSLIM.net Company Profile |
SEC |
Zacks Reports |
StockTalk |
News |
Chart |
Request a new note
C
A N
S L
I M
|
|
|
|
THESE ARE NOT BUY RECOMMENDATIONS!
Comments contained in the body of this report are technical
opinions only. The material herein has been obtained
from sources believed to be reliable and accurate, however,
its accuracy and completeness cannot be guaranteed.
This site is not an investment advisor, hence it does
not endorse or recommend any securities or other investments.
Any recommendation contained in this report may not
be suitable for all investors and it is not to be deemed
an offer or solicitation on our part with respect to
the purchase or sale of any securities. All trademarks,
service marks and trade names appearing in this report
are the property of their respective owners, and are
likewise used for identification purposes only.
This report is a service available
only to active Paid Premium Members.
You may opt-out of receiving report notifications
at any time. Questions or comments may be submitted
by writing to Premium Membership Services 665 S.E. 10 Street, Suite 201 Deerfield Beach, FL 33441-5634 or by calling 1-800-965-8307
or 954-785-1121.
|
|
|

