You are not logged in.
This means you
CAN ONLY VIEW reports that were published prior to Monday, April 14, 2025.
You
MUST UPGRADE YOUR MEMBERSHIP if you want to see any current reports.
AFTER MARKET UPDATE - THURSDAY, NOVEMBER 1ST, 2012
Previous After Market Report Next After Market Report >>>
|
|
|
|
DOW |
+136.16 |
13,232.62 |
+1.04% |
|
Volume |
797,521,590 |
-6% |
|
Volume |
1,813,508,590 |
+3% |
|
NASDAQ |
+42.83 |
3,020.06 |
+1.44% |
|
Advancers |
2,343 |
74% |
|
Advancers |
1,611 |
63% |
|
S&P 500 |
+15.43 |
1,427.59 |
+1.09% |
|
Decliners |
705 |
22% |
|
Decliners |
855 |
33% |
|
Russell 2000 |
+9.12 |
827.85 |
+1.11% |
|
52 Wk Highs |
194 |
|
|
52 Wk Highs |
87 |
|
|
S&P 600 |
+5.54 |
463.69 |
+1.21% |
|
52 Wk Lows |
26 |
|
|
52 Wk Lows |
46 |
|
|
 |
Major Averages Rise With an Expansion in Leadership
Kenneth J. Gruneisen - Passed the CAN SLIM® Master's Exam
Stocks opened November on a positive note as better-than-expected economic readings helped buoy the major averages The volume totals were reported mixed, slightly lower on the NYSE and slightly higher on the Nasdaq exchange versus the prior session's totals. Breadth was positive as advancers led decliners by more than a 3-1 margin on the NYSE and by nearly 2-1 on the Nasdaq exchange. The total number of stocks hitting new 52-week highs easily outnumbered new 52-week lows on the NYSE and on the Nasdaq exchange. There were 70 high-ranked companies from the CANSLIM.net Leaders List making new 52-week highs and appearing on the CANSLIM.net BreakOuts Page, up from the prior session total of 46 stocks. There were gains for 11 of the 17 high-ranked companies currently included on the Featured Stocks Page.
Looking at the numbers, ADP employment figures for October, weekly jobless claims, and October ISM manufacturing data all modestly topped consensus expectations. Eight of the 10 sectors on the S&P ended higher, led by a rally in Material stocks. Shares of Alcoa Inc (AA +2.10%) and Freeport-McMoRan Copper and Gold Inc (FCX +4.17%) advanced. Corporate earnings also played a factor in the session. Visa Inc (V +3.69%) and Kellogg Co (K +2.26%) rose after both companies topped analysts' estimates in the quarter. Bank Of America Corp (BAC +4.51%) and Microsoft Corp (MSFT +3.42%) were among many well-known names posting influential gains. In other news, Advanced Auto Parts (AAP +14.18%) jumped on news that the company was actively seeking bids to be acquired.
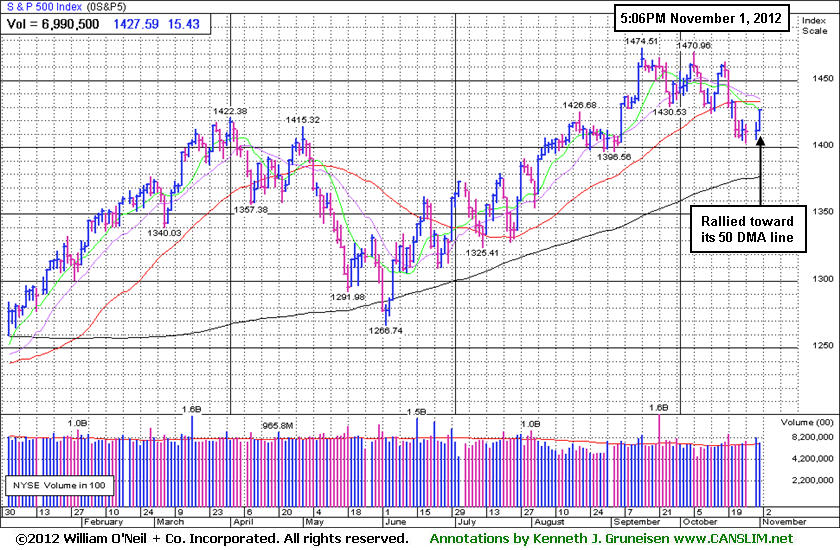
The Nasdaq Composite Index's gain of +1.44% with higher volume was a reassuring sign, however this was only Day 3 of that index's rally attempt from its low hit on 10/26/12. The Dow's gain of +1.04% was not substantial enough to be considered a proper follow-through day on Day 4 of its rally attempt, plus volume was lighter on the NYSE. The window is open for an ideal follow-through day provided that the indices' recent lows are not undercut, which would reset their day counts.
Turning to fixed income markets, Treasuries ended lower along the curve. The benchmark 10-year note was down 7/32 to yield 1.72% and the 30-year bond gave up 27/32 to yield 2.90%.
During market corrections the M criteria argues against new buying efforts and urges investors to take a defensive stance to protect precious capital. That stance can change back to a bullish stance where buying is encouraged when at least one of the three major averages produces a solid follow-through day (FTD). A FTD confirming a new rally requires substantial gains on higher (ideally above average) volume, coupled with healthy leadership and a respectable number of stocks hitting new 52-week highs. Historic studies have shown that a FTD occurring between Days 4-7 of a new rally effort has often signaled the beginning of the most substantial market rallies.
Investors should always limit losses if ever any stock falls more than -7% from their purchase price. Following strict sell rules is precisely how this fact-based investment system prompts investors to reduce exposure and protect cash during market downturns. Keep a watchlist of strong acting stocks with all-key criteria in anticipation of the next confirmed uptrend. See the noteworthy candidates included on the Featured Stocks Page.
Watch for an announcement via email concerning the next WEBCAST. The webcast will also be available via an updated link highlighted at the top of the Premium Member Homepage.
PICTURED: The S&P 500 Index finished -3.2% off its 52-week high. It rebounded toward its 50-day moving average (DMA) line on what was Day 2 of its current rally attempt. In this commentary we will continue to watch closely for an eventual rally and confirming gains within the ideal window for a proper FTD, meanwhile caution and patience are required.
|
 Kenneth J. Gruneisen started out as a licensed stockbroker in August 1987, a couple of months prior to the historic stock market crash that took the Dow Jones Industrial Average down -22.6% in a single day. He has published daily fact-based fundamental and technical analysis on high-ranked stocks online for two decades. Through FACTBASEDINVESTING.COM, Kenneth provides educational articles, news, market commentary, and other information regarding proven investment systems that work in good times and bad.
Comments contained in the body of this report are technical opinions only and are not necessarily those of Gruneisen Growth Corp. The material herein has been obtained from sources believed to be reliable and accurate, however, its accuracy and completeness cannot be guaranteed. Our firm, employees, and customers may effect transactions, including transactions contrary to any recommendation herein, or have positions in the securities mentioned herein or options with respect thereto. Any recommendation contained in this report may not be suitable for all investors and it is not to be deemed an offer or solicitation on our part with respect to the purchase or sale of any securities. |
|
 |
Tech Sector Tallied Best Gains
Kenneth J. Gruneisen - Passed the CAN SLIM® Master's Exam
The tech sector had a strong day as the Networking Index ($NWX +3.89%), Semiconductor Index ($SOX +3.40%), Internet Index ($IIX +2.20%), and the Biotechnology Index ($BTK +2.51%) tallied unanimous gains with substance. Financial shares also helped underpin the rally attempt as the Bank Index ($BKX +1.71%) and the Broker/Dealer Index ($XBD +1.75%) posted solid gains. The Retail Index ($RLX +0.93%) rose, however it was outpaced by the Healthcare Index ($HMO +1.78%). Strength in energy-related shares boosted the Oil Services Index ($OSX +1.31%) and the Integrated Oil Index ($XOI +0.88%). Meanwhile, the Gold & Silver Index ($XAU -0.62%) was clearly a laggard as it edged lower.
Charts courtesy www.stockcharts.com
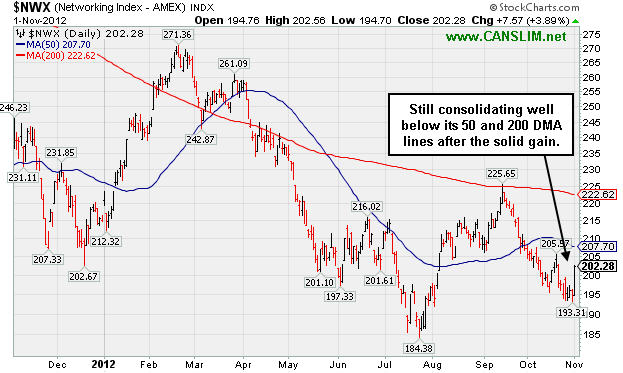
PICTURED: The Networking Index ($NWX +3.89%) is still consolidating well below its 50-day and 200-day moving average (DMA) lines after the solid gain.
| Oil Services |
$OSX |
219.26 |
+2.83 |
+1.31% |
+1.38% |
| Healthcare |
$HMO |
2,489.55 |
+43.45 |
+1.78% |
+9.11% |
| Integrated Oil |
$XOI |
1,239.65 |
+10.87 |
+0.88% |
+0.86% |
| Semiconductor |
$SOX |
379.50 |
+12.47 |
+3.40% |
+4.13% |
| Networking |
$NWX |
202.28 |
+7.57 |
+3.89% |
-5.99% |
| Internet |
$IIX |
310.45 |
+6.67 |
+2.20% |
+10.19% |
| Broker/Dealer |
$XBD |
86.29 |
+1.48 |
+1.75% |
+3.63% |
| Retail |
$RLX |
649.86 |
+5.96 |
+0.93% |
+24.21% |
| Gold & Silver |
$XAU |
187.08 |
-1.17 |
-0.62% |
+3.57% |
| Bank |
$BKX |
50.45 |
+0.85 |
+1.71% |
+28.11% |
| Biotech |
$BTK |
1,432.80 |
+35.02 |
+2.51% |
+31.28% |
|
|
|
 |
Found Support at 50-Day Average; Earnings Deceleration Evident
Kenneth J. Gruneisen - Passed the CAN SLIM® Master's Exam
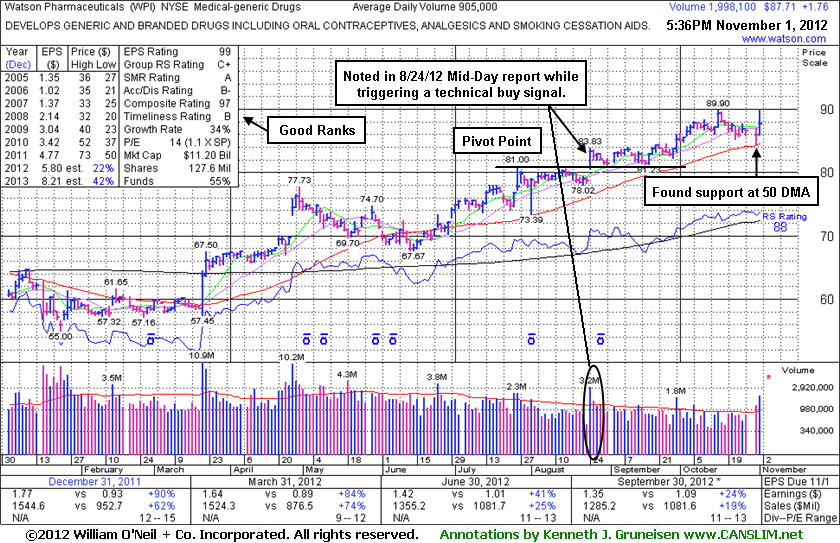
Watson Pharmaceuticals (WPI +$1.76 or +2.05% to $87.71) touched a new 52-week high today, rallying with above average volume after testing support at its 50-day moving average (DMA) line. It has not formed a sound base and it is extended from a proper buy point under the fact-based system's guidelines. It was last shown in this FSU section on 9/28/12 with an annotated graph under the headline, "Volume-Driven Gain Into New 52-Week High Territory", as its gain backed by +71% above average volume lifted it above the "max buy" level. Disciplined investors know to avoid chasing stocks after they get extended from a prior base. Prior highs in the $81 area acted as support during its consolidation before it continued higher. The number of top-rated funds owning its shares rose from 1,011 in Mar '12 to 1,081 in Sep '12, a reassuring sign concerning the I criteria.
It reported earnings +24% on +19% sales revenues for the Sep '12 quarter, a hair below the +25% minimum earnings (C criteria) guideline. That continued the streak of sequential comparisons showing recent deceleration in sales and earning growth rate, which has been noted as a small concern. Earlier, its 8/24/12 gap up and solid gain above its pivot point backed by +143% above average volume triggered a technical buy signal. The considerable gain with above average volume followed news that its generic Lidoderm(R) received FDA approval, an encouraging development concerning the N criteria The 5/09/12 mid-day report had previously noted - "Its improved fundamentals make it a worthy candidate for investors' watchlists. Sales revenues showed impressive acceleration while the 3 latest quarterly comparisons through Mar '12 showed earnings increases above the +25% guideline satisfying the C criteria. It also has maintained a strong annual earnings (A criteria) history."
|
|
|
Color Codes Explained :
Y - Better candidates highlighted by our
staff of experts.
G - Previously featured
in past reports as yellow but may no longer be buyable under the
guidelines.
***Last / Change / Volume data in this table is the closing quote data***
Symbol/Exchange
Company Name
Industry Group |
PRICE |
CHANGE
(%Change) |
Day High |
Volume
(% DAV)
(% 50 day avg vol) |
52 Wk Hi
% From Hi |
Featured
Date |
Price
Featured |
Pivot Featured |
|
Max Buy |
ASPS
-
NASDAQ
Altisource Ptf Sltns Sa
REAL ESTATE - Property Management/Developmen
|
$110.34
|
-3.16
-2.78% |
$115.12
|
265,058
124.50% of 50 DAV
50 DAV is 212,900
|
$129.72
-14.94%
|
9/24/2012
|
$87.24
|
PP = $92.39
|
|
MB = $97.01
|
 Most Recent Note - 11/1/2012 6:05:11 PM
G - Pulled back from its 52-week and all-time highs with higher volume behind a 4th consecutive loss today. Previously noted - "Very extended from its prior base, its prior highs in the $92 area define initial support to watch on pullbacks."
>>> The latest Featured Stock Update with an annotated graph appeared on 10/12/2012. Click here.
View all notes |
Alert me of new notes |
CANSLIM.net Company Profile |
SEC |
Zacks Reports |
StockTalk |
News |
Chart |
Request a new note
C
A N
S L
I M


|
BRLI
-
NASDAQ
Bio Reference Labs Inc
HEALTH SERVICES - Medical Laboratories and Researc
|
$28.13
|
+0.37
1.35% |
$28.32
|
432,566
124.84% of 50 DAV
50 DAV is 346,500
|
$32.86
-14.38%
|
10/3/2012
|
$30.90
|
PP = $30.25
|
|
MB = $31.76
|
Most Recent Note - 11/1/2012 6:06:34 PM
G - Small gain today halted a streak of 7 consecutive losses. Undercut prior highs in the $30 area and violated its 50 DMA line triggering technical sell signals and raising serious concerns.
>>> The latest Featured Stock Update with an annotated graph appeared on 10/8/2012. Click here.
View all notes |
Alert me of new notes |
CANSLIM.net Company Profile |
SEC |
Zacks Reports |
StockTalk |
News |
Chart |
Request a new note
C
A N
S L
I M
|
CFNL
-
NASDAQ
Cardinal Financial Corp
BANKING - Regional - Southeast Banks
|
$15.84
|
-0.09
-0.57% |
$16.05
|
221,990
212.02% of 50 DAV
50 DAV is 104,700
|
$16.07
-1.43%
|
8/17/2012
|
$12.84
|
PP = $13.31
|
|
MB = $13.98
|
Most Recent Note - 11/1/2012 6:13:18 PM
G - Pulled back today following 5 consecutive gains into new 52-week high territory. Extended from its prior base. Found support at its 50 DMA line in recent months.
>>> The latest Featured Stock Update with an annotated graph appeared on 10/25/2012. Click here.
View all notes |
Alert me of new notes |
CANSLIM.net Company Profile |
SEC |
Zacks Reports |
StockTalk |
News |
Chart |
Request a new note
C
A N
S L
I M
|
CMCSA
-
NASDAQ
Comcast Corp Cl A
MEDIA - CATV Systems
|
$37.55
|
+0.03
0.07% |
$37.95
|
12,076,708
99.09% of 50 DAV
50 DAV is 12,187,100
|
$37.85
-0.79%
|
6/11/2012
|
$29.94
|
PP = $30.98
|
|
MB = $32.53
|
Most Recent Note - 11/1/2012 6:15:21 PM
G - Touched another new 52-week high today. Reported earnings +39% on +15% sales revenues for the Sep '12 quarter, a reassuring follow-up to the previously noted sub par quarter. Upward trendline and 50 DMA line define near term support where violations would trigger technical sell signals.
>>> The latest Featured Stock Update with an annotated graph appeared on 10/24/2012. Click here.
View all notes |
Alert me of new notes |
CANSLIM.net Company Profile |
SEC |
Zacks Reports |
StockTalk |
News |
Chart |
Request a new note
C
A N
S L
I M
|
DVA
-
NYSE
Davita Inc
HEALTH SERVICES - Specialized Health Services
|
$112.36
|
-0.16
-0.14% |
$114.09
|
897,278
112.77% of 50 DAV
50 DAV is 795,700
|
$114.85
-2.17%
|
9/5/2012
|
$102.92
|
PP = $100.62
|
|
MB = $105.65
|
Most Recent Note - 10/31/2012 4:32:17 PM
G - Reported earnings +3% on +12% sales for the Sep '12 quarter, below the guidelines of the fact-based system. Hit a new 52-week high today with a gain backed by above average volume, getting more extended from its latest sound base. Prior highs near $100 and its 50 DMA line define near-term support to watch on pullbacks where violations may trigger technical sell signals.
>>> The latest Featured Stock Update with an annotated graph appeared on 10/10/2012. Click here.
View all notes |
Alert me of new notes |
CANSLIM.net Company Profile |
SEC |
Zacks Reports |
StockTalk |
News |
Chart |
Request a new note
C
A N
S L
I M
|
Symbol/Exchange
Company Name
Industry Group |
PRICE |
CHANGE
(%Change) |
Day High |
Volume
(% DAV)
(% 50 day avg vol) |
52 Wk Hi
% From Hi |
Featured
Date |
Price
Featured |
Pivot Featured |
|
Max Buy |
GPX
-
NYSE
G P Strategies Corp
DIVERSIFIED SERVICES - Education and Training Services
|
$19.29
|
+0.04
0.21% |
$19.84
|
208,961
367.89% of 50 DAV
50 DAV is 56,800
|
$20.67
-6.68%
|
10/8/2012
|
$20.00
|
PP = $20.77
|
|
MB = $21.81
|
Most Recent Note - 11/1/2012 6:11:35 PM
G - Reported earnings +0% on +12% sales revenues for the Sep '12 quarter, below the +25% minimum earnings guideline, raising fundamental concerns. Churned heavy volume while holding its ground, and its 50 DMA line acted as resistance.
>>> The latest Featured Stock Update with an annotated graph appeared on 10/16/2012. Click here.
View all notes |
Alert me of new notes |
CANSLIM.net Company Profile |
SEC |
Zacks Reports |
StockTalk |
News |
Chart |
Request a new note
C
A N
S L
I M
|
LKQ
-
NASDAQ
L K Q Corp
WHOLESALE - Auto Parts
|
$21.72
|
+0.85
4.07% |
$21.90
|
2,880,149
184.01% of 50 DAV
50 DAV is 1,565,200
|
$21.22
2.38%
|
8/9/2012
|
$18.97
|
PP = $18.72
|
|
MB = $19.66
|
Most Recent Note - 11/1/2012 6:09:21 PM
G - Rallied with above average volume today for a new 52-week high, and no resistance remains due to overhead supply. Showed impressive resilience and strength after reporting earnings +6% on +30% sales revenues for the Sep '12 quarter. Results below the +25% minimum earnings guideline (C criteria) raised fundamental concerns.
>>> The latest Featured Stock Update with an annotated graph appeared on 10/19/2012. Click here.
View all notes |
Alert me of new notes |
CANSLIM.net Company Profile |
SEC |
Zacks Reports |
StockTalk |
News |
Chart |
Request a new note
C
A N
S L
I M
|
MIDD
-
NASDAQ
Middleby Corp
MANUFACTURING - Diversified Machinery
|
$126.56
|
+1.61
1.29% |
$127.06
|
105,863
140.96% of 50 DAV
50 DAV is 75,100
|
$125.57
0.79%
|
10/8/2012
|
$118.46
|
PP = $122.67
|
|
MB = $128.80
|
Most Recent Note - 11/1/2012 6:08:28 PM
Y - Hit a new 52-week high with +41% above average volume behind today's 4th consecutive gain. Volume-driven gains above the pivot point confirmed a new (or add-on) technical buy signal, however the M criteria remains an overriding concern until a FTD confirms a new rally. Its 50 DMA line and recent lows define near-term chart support to watch.
>>> The latest Featured Stock Update with an annotated graph appeared on 10/22/2012. Click here.
View all notes |
Alert me of new notes |
CANSLIM.net Company Profile |
SEC |
Zacks Reports |
StockTalk |
News |
Chart |
Request a new note
C
A N
S L
I M
|
N
-
NYSE
Netsuite Inc
DIVERSIFIED SERVICES - Business/Management Services
|
$64.20
|
+0.69
1.09% |
$64.74
|
459,202
89.67% of 50 DAV
50 DAV is 512,100
|
$67.02
-4.21%
|
8/20/2012
|
$55.88
|
PP = $59.32
|
|
MB = $62.29
|
Most Recent Note - 10/31/2012 12:53:04 PM
G - Reported earnings +60% on +31% sales revenues for the Sep '12 quarter. Pulling back today following a considerable 10/26/12 gap up and volume-driven gain from below its 50 DMA line for new 52-week and all-time highs. It did not form a sound new base pattern. Until the major averages are back in a confirmed rally the M criteria argues against any new buying efforts.
>>> The latest Featured Stock Update with an annotated graph appeared on 10/26/2012. Click here.
View all notes |
Alert me of new notes |
CANSLIM.net Company Profile |
SEC |
Zacks Reports |
StockTalk |
News |
Chart |
Request a new note
C
A N
S L
I M
|
NSM
-
NYSE
Nationstar Mtg Hldgs Inc
FINANCIAL SERVICES - Credit Services
|
$34.21
|
-1.92
-5.31% |
$36.60
|
1,752,513
115.16% of 50 DAV
50 DAV is 1,521,800
|
$37.20
-8.04%
|
8/29/2012
|
$27.96
|
PP = $28.85
|
|
MB = $30.29
|
Most Recent Note - 11/1/2012 5:57:00 PM
G - Finished near the session low today with a big loss on higher volume indicative of distributional pressure. It has not formed a sound new base pattern.
>>> The latest Featured Stock Update with an annotated graph appeared on 10/11/2012. Click here.
View all notes |
Alert me of new notes |
CANSLIM.net Company Profile |
SEC |
Zacks Reports |
StockTalk |
News |
Chart |
Request a new note
C
A N
S L
I M
|
Symbol/Exchange
Company Name
Industry Group |
PRICE |
CHANGE
(%Change) |
Day High |
Volume
(% DAV)
(% 50 day avg vol) |
52 Wk Hi
% From Hi |
Featured
Date |
Price
Featured |
Pivot Featured |
|
Max Buy |
OSIS
-
NASDAQ
O S I Systems Inc
ELECTRONICS - Semiconductor Equipment and Mate
|
$79.14
|
-0.11
-0.14% |
$79.55
|
71,483
62.21% of 50 DAV
50 DAV is 114,900
|
$81.23
-2.57%
|
9/5/2012
|
$74.39
|
PP = $75.10
|
|
MB = $78.86
|
Most Recent Note - 10/31/2012 4:38:44 PM
G - Recently found prompt support at its 50 DMA line, and it is still slightly extended from its prior base.
>>> The latest Featured Stock Update with an annotated graph appeared on 10/18/2012. Click here.
View all notes |
Alert me of new notes |
CANSLIM.net Company Profile |
SEC |
Zacks Reports |
StockTalk |
News |
Chart |
Request a new note
C
A N
S L
I M
|
RNF
-
NYSE
Rentech Nitrogen Ptnr Lp
CHEMICALS - Agricultural Chemicals
|
$40.00
|
+1.59
4.14% |
$40.02
|
884,191
245.06% of 50 DAV
50 DAV is 360,800
|
$40.05
-0.12%
|
11/1/2012
|
$39.11
|
PP = $40.15
|
|
MB = $42.16
|
Most Recent Note - 11/1/2012 1:18:59 PM
Y - Approaching its 52-week high with today's 5th consecutive gain on higher volume. Found support at its 50 DMA line defining important near-term support after the previously noted upward trendline violation. Color code is changed to yellow with new pivot point cited based on its 9/25/12 high plus 10 cents. Volume-driven gains above its pivot point may trigger a new (or add-on) technical buy signal. Disciplined investors know to watch for the market direction (M criteria) to produce a FTD and be noted as favorable again before acting on any new buy candidates.
>>> The latest Featured Stock Update with an annotated graph appeared on 10/4/2012. Click here.
View all notes |
Alert me of new notes |
CANSLIM.net Company Profile |
SEC |
Zacks Reports |
StockTalk |
News |
Chart |
Request a new note
C
A N
S L
I M
|
TDG
-
NYSE
Transdigm Group Inc
AEROSPACE/DEFENSE - Aerospace/Defense Products and; Services
|
$136.57
|
+3.36
2.52% |
$137.71
|
374,945
73.58% of 50 DAV
50 DAV is 509,600
|
$139.31
-1.97%
|
8/16/2012
|
$132.23
|
PP = $136.44
|
|
MB = $143.26
|
Most Recent Note - 11/1/2012 6:16:31 PM
G - Posted a gain today with below average volume. When noted on 10/23/12 it undercut its 50 DMA line following a special dividend, yet it promptly rebounded back above that important short-term average.
>>> The latest Featured Stock Update with an annotated graph appeared on 10/23/2012. Click here.
View all notes |
Alert me of new notes |
CANSLIM.net Company Profile |
SEC |
Zacks Reports |
StockTalk |
News |
Chart |
Request a new note
C
A N
S L
I M
|
ULTA
-
NASDAQ
Ulta Salon Cosm & Frag
SPECIALTY RETAIL - Specialty Retail, Other
|
$93.71
|
+1.52
1.65% |
$93.78
|
556,816
75.73% of 50 DAV
50 DAV is 735,300
|
$103.52
-9.48%
|
9/4/2012
|
$93.17
|
PP = $98.52
|
|
MB = $103.45
|
Most Recent Note - 10/31/2012 5:18:51 PM
G - Still sputtering below its 50 DMA line, and a rebound above that important short-term average is needed for its outlook to improve. Its 200 DMA line ($90.20 now) defines near-term support to watch.
>>> The latest Featured Stock Update with an annotated graph appeared on 10/5/2012. Click here.
View all notes |
Alert me of new notes |
CANSLIM.net Company Profile |
SEC |
Zacks Reports |
StockTalk |
News |
Chart |
Request a new note
C
A N
S L
I M
|
ULTI
-
NASDAQ
Ultimate Software Group
INTERNET - Internet Software and Services
|
$95.60
|
-5.76
-5.68% |
$99.00
|
377,750
247.70% of 50 DAV
50 DAV is 152,500
|
$106.40
-10.15%
|
10/31/2012
|
$101.36
|
PP = $105.00
|
|
MB = $110.25
|
Most Recent Note - 11/1/2012 6:00:55 PM
G - Gapped down today and erased the prior session's gain, raising concerns while violating its 50 DMA line with a damaging loss on above average volume. Reported earnings +61% on +22% sales revenues for the Sep '12 quarter. Color code is changed to green, and a rebound above its 50 DMA is needed to improve its technical stance. Still building on a 9-week "double bottom" base pattern. See latest FSU analysis for more details and a new annotated graph.
>>> The latest Featured Stock Update with an annotated graph appeared on 10/31/2012. Click here.
View all notes |
Alert me of new notes |
CANSLIM.net Company Profile |
SEC |
Zacks Reports |
StockTalk |
News |
Chart |
Request a new note
C
A N
S L
I M
|
Symbol/Exchange
Company Name
Industry Group |
PRICE |
CHANGE
(%Change) |
Day High |
Volume
(% DAV)
(% 50 day avg vol) |
52 Wk Hi
% From Hi |
Featured
Date |
Price
Featured |
Pivot Featured |
|
Max Buy |
VSI
-
NYSE
Vitamin Shoppe Inc
SPECIALTY RETAIL - Specialty Retail, Other
|
$57.96
|
+0.72
1.26% |
$58.19
|
333,853
124.02% of 50 DAV
50 DAV is 269,200
|
$61.83
-6.25%
|
10/15/2012
|
$57.82
|
PP = $60.08
|
|
MB = $63.08
|
Most Recent Note - 11/1/2012 6:03:50 PM
Y - Rebounded with a gain today backed by above average volume while it closed near the session high and finished well above its 50 DMA line again. Color code is changed to yellow, yet subsequent volume-driven gains for new highs are needed to trigger a new technical buy signal.
>>> The latest Featured Stock Update with an annotated graph appeared on 10/15/2012. Click here.
View all notes |
Alert me of new notes |
CANSLIM.net Company Profile |
SEC |
Zacks Reports |
StockTalk |
News |
Chart |
Request a new note
C
A N
S L
I M
|
WPI
-
NYSE
Watson Pharmaceuticals
DRUGS - Drugs - Generic
|
$87.71
|
+1.76
2.05% |
$90.00
|
2,003,144
221.34% of 50 DAV
50 DAV is 905,000
|
$89.90
-2.44%
|
8/24/2012
|
$82.90
|
PP = $81.10
|
|
MB = $85.16
|
Most Recent Note - 11/1/2012 6:04:27 PM
G - Touched a new 52-week high today, rallying with above average volume after testing support at its 50 DMA line. It has not formed a sound base and it is extended from a proper buy point under the fact-based system's guidelines. See the latest FSU analysis for more details and a new annotated graph.
>>> The latest Featured Stock Update with an annotated graph appeared on 11/1/2012. Click here.
View all notes |
Alert me of new notes |
CANSLIM.net Company Profile |
SEC |
Zacks Reports |
StockTalk |
News |
Chart |
Request a new note
C
A N
S L
I M
|
|
|
|
THESE ARE NOT BUY RECOMMENDATIONS!
Comments contained in the body of this report are technical
opinions only. The material herein has been obtained
from sources believed to be reliable and accurate, however,
its accuracy and completeness cannot be guaranteed.
This site is not an investment advisor, hence it does
not endorse or recommend any securities or other investments.
Any recommendation contained in this report may not
be suitable for all investors and it is not to be deemed
an offer or solicitation on our part with respect to
the purchase or sale of any securities. All trademarks,
service marks and trade names appearing in this report
are the property of their respective owners, and are
likewise used for identification purposes only.
This report is a service available
only to active Paid Premium Members.
You may opt-out of receiving report notifications
at any time. Questions or comments may be submitted
by writing to Premium Membership Services 665 S.E. 10 Street, Suite 201 Deerfield Beach, FL 33441-5634 or by calling 1-800-965-8307
or 954-785-1121.
|
|
|

