You are not logged in.
This means you
CAN ONLY VIEW reports that were published prior to Monday, April 14, 2025.
You
MUST UPGRADE YOUR MEMBERSHIP if you want to see any current reports.
AFTER MARKET UPDATE - WEDNESDAY, OCTOBER 31ST, 2012
Previous After Market Report Next After Market Report >>>
|
|
|
|
DOW |
-10.75 |
13,096.46 |
-0.08% |
|
Volume |
852,903,500 |
+16% |
|
Volume |
1,759,660,470 |
+1% |
|
NASDAQ |
-10.72 |
2,977.23 |
-0.36% |
|
Advancers |
1,776 |
56% |
|
Advancers |
1,354 |
52% |
|
S&P 500 |
+0.22 |
1,412.16 |
+0.02% |
|
Decliners |
1,289 |
41% |
|
Decliners |
1,131 |
44% |
|
Russell 2000 |
+5.48 |
818.73 |
+0.67% |
|
52 Wk Highs |
122 |
|
|
52 Wk Highs |
76 |
|
|
S&P 600 |
+3.71 |
458.15 |
+0.82% |
|
52 Wk Lows |
49 |
|
|
52 Wk Lows |
75 |
|
|
 |
Major Averages End Mixed After 2-Day Hiatus Due to Weather
Kenneth J. Gruneisen - Passed the CAN SLIM® Master's Exam
Stocks opened higher in early trading after being closed for two days, the first weather-related market closure of more than one day since the Blizzard of 1888. On Wednesday's session the major averages finished mixed and virtually flat. The volume totals were reported slightly higher on the NYSE and on the Nasdaq exchange versus the prior session's totals. Breadth was positive as advancers led decliners by nearly a 3-2 margin on the NYSE, but advancers led decliners by a narrower 7-6 margin on the Nasdaq exchange. The total number of stocks hitting new 52-week highs easily outnumbered new 52-week lows on the NYSE, meanwhile new 52-week highs and new 52-week lows were evenly matched on the Nasdaq exchange. There were 46 high-ranked companies from the CANSLIM.net Leaders List making new 52-week highs and appearing on the CANSLIM.net BreakOuts Page, up from the prior session total of 26 stocks. There were gains for 7 of the 17 high-ranked companies currently included on the Featured Stocks Page, a slightly negative tilt versus the broader market's mostly positive bias.
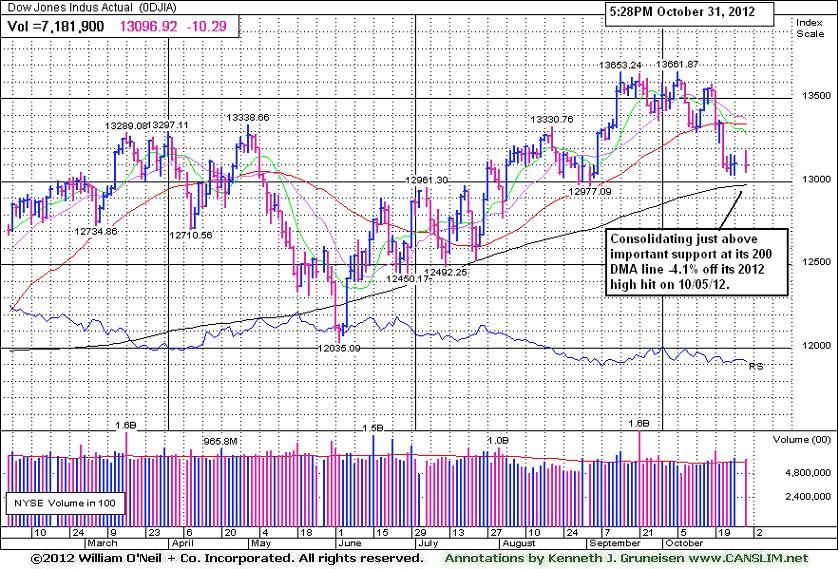
The major averages finished the session with mixed results after turning lower following economic data that fell short of expectations. The Employment Cost Index and Chicago PMI only showed modest improvement. Separately, payroll processing firm ADP revised its September private sector metrics under their new methodology, which showed a downward revision to 88,200 from 162,000. A final revision on September data and new October data is scheduled to be released Thursday ahead of the opening bell.
Six of the 10 sectors on the S&P ended higher, led by gains in utility stocks. Shares of Consolidated Edison Inc (ED +0.68%) tried to lead the space higher. On the earnings front, the new General Motors Company (GM +9.54%) rallied after the company topped analysts' expectations in the quarter. In other news, Facebook Inc (FB -3.79%) fell as the company's lock-up period expired on about 234 million shares held by employees.
Turning to fixed income, Treasuries ended higher along the curve. The benchmark 10-year note added 7/32 to yield 1.70% and the 30-year bond advanced 13/32 to yield 2.86%.
During market corrections the M criteria argues against new buying efforts and urges investors to take a defensive stance to protect precious capital. That stance can change back to a bullish stance where buying is encouraged when at least one of the three major averages produces a solid follow-through day (FTD). A FTD confirming a new rally requires substantial gains on higher (ideally above average) volume, coupled with healthy leadership and a respectable number of stocks hitting new 52-week highs. Historic studies have shown that a FTD occurring between Days 4-7 of a new rally effort has often signaled the beginning of the most substantial market rallies.
Investors should always limit losses if ever any stock falls more than -7% from their purchase price. Following strict sell rules is precisely how this fact-based investment system prompts investors to reduce exposure and protect cash during market downturns. Keep a watchlist of strong acting stocks with all-key criteria in anticipation of the next confirmed uptrend. See the noteworthy candidates included on the Featured Stocks Page.
Watch for an announcement via email concerning the Q3 2012 WEBCAST. The webcast will also be available via an updated link highlighted at the top of the Premium Member Homepage.
PICTURED: The Dow Jones Industrial Average finished -4.1% off its 52-week high. It halted its slide just above its 200-day moving average (DMA) line. Subsequent deterioration would not bode well for the broader market outlook. Further weakness would be a signal for investors to reduce market exposure if they are not already entirely in cash. In this commentary we will continue to watch closely for an eventual rally and confirming gains within the ideal window for a proper FTD, meanwhile caution and patience are required
|
 Kenneth J. Gruneisen started out as a licensed stockbroker in August 1987, a couple of months prior to the historic stock market crash that took the Dow Jones Industrial Average down -22.6% in a single day. He has published daily fact-based fundamental and technical analysis on high-ranked stocks online for two decades. Through FACTBASEDINVESTING.COM, Kenneth provides educational articles, news, market commentary, and other information regarding proven investment systems that work in good times and bad.
Comments contained in the body of this report are technical opinions only and are not necessarily those of Gruneisen Growth Corp. The material herein has been obtained from sources believed to be reliable and accurate, however, its accuracy and completeness cannot be guaranteed. Our firm, employees, and customers may effect transactions, including transactions contrary to any recommendation herein, or have positions in the securities mentioned herein or options with respect thereto. Any recommendation contained in this report may not be suitable for all investors and it is not to be deemed an offer or solicitation on our part with respect to the purchase or sale of any securities. |
|
 |
Gold & Silver Index Posted Standout Gain
Kenneth J. Gruneisen - Passed the CAN SLIM® Master's Exam
The Retail Index ($RLX +0.59%) and financial shares were positive influences on the major averages as the Broker/Dealer Index ($XBD +0.62%) and the Bank Index ($BKX +0.71%) rose on Wednesday. The Oil Services Index ($OSX -1.54%) led the energy-related groups lower while the Integrated Oil Index ($XOI +0.12%) held its ground. Weakness in the Biotechnology Index ($BTK -2.17%) and Healthcare Index ($HMO -1.38%) also were a drag on the market while the Networking Index ($NWX -0.67%) and the Internet Index ($IIX -0.37%) edged lower and the Semiconductor Index ($SOX -0.07%) finished flat.
Charts courtesy www.stockcharts.com
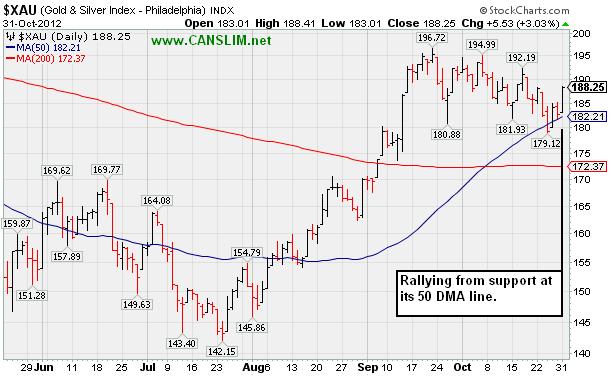
PICTURED: The Gold & Silver Index ($XAU +3.03%) was a standout gainer while rallying from support at its 50-day moving average (DMA) line.
| Oil Services |
$OSX |
216.43 |
-3.38 |
-1.54% |
+0.07% |
| Healthcare |
$HMO |
2,446.10 |
-34.25 |
-1.38% |
+7.21% |
| Integrated Oil |
$XOI |
1,228.79 |
+1.41 |
+0.12% |
-0.03% |
| Semiconductor |
$SOX |
367.03 |
-0.25 |
-0.07% |
+0.71% |
| Networking |
$NWX |
194.70 |
-1.31 |
-0.67% |
-9.51% |
| Internet |
$IIX |
303.77 |
-1.14 |
-0.37% |
+7.82% |
| Broker/Dealer |
$XBD |
84.81 |
+0.53 |
+0.62% |
+1.85% |
| Retail |
$RLX |
643.90 |
+3.79 |
+0.59% |
+23.07% |
| Gold & Silver |
$XAU |
188.25 |
+5.53 |
+3.03% |
+4.21% |
| Bank |
$BKX |
49.60 |
+0.35 |
+0.71% |
+25.95% |
| Biotech |
$BTK |
1,397.78 |
-30.99 |
-2.17% |
+28.07% |
|
|
|
 |
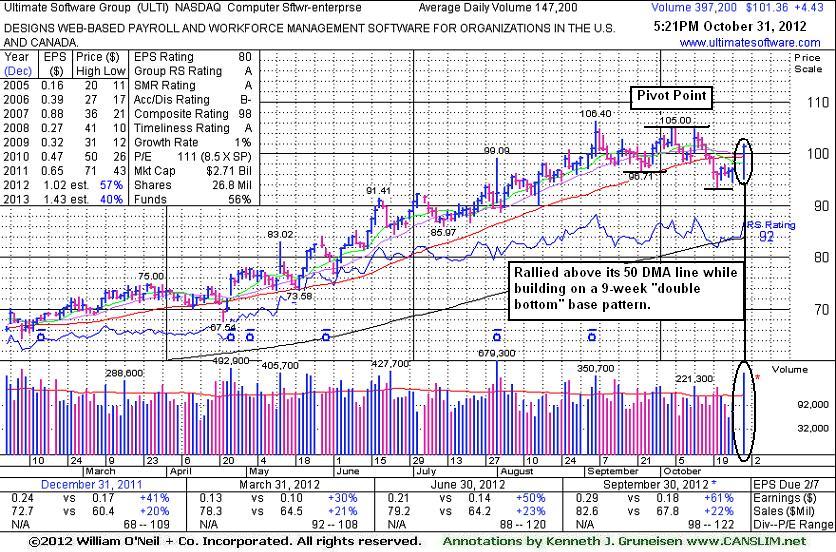
Following Strong Quarterly Results it Rallied Above 50-Day Moving Average
Kenneth J. Gruneisen - Passed the CAN SLIM® Master's Exam
Ultimate Software Group (ULTI +$4.43 or +4.57% to $101.36) reported earnings +61% on +22% sales revenues for the Sep '12 quarter. A big volume-driven gain and strong close today helped it rebound above its 50-day moving average (DMA) line improving its technical stance. Its color code was changed to yellow with new pivot point cited based on its 10/04/12 high while still building on a 9-week "double bottom" base pattern. Subsequent volume driven gains above its pivot point may trigger a new (or add-on) technical buy signal. However, disciplined investors also know that until the major averages are back in a confirmed rally the M criteria argues against any new buying efforts.
It was last shown in this FSU section on 9/27/12 with an annotated graph under the headline, "Halted 7-Session Losing Streak With Gain on Higher Volume". It promptly halted its slide after more recently undercutting prior lows in the $96 area and violating its 50 DMA line triggering technical sell signals. Quarterly earnings increases have been above the +25% guideline (C criteria) and its annual earnings (A criteria) have been steadily improving since a downturn in FY '08. The number of top-rated funds owning its shares rose from 258 in Sep '11 to 336 in Sep '12, a reassuring sign concerning the I criteria.
|
|
|
Color Codes Explained :
Y - Better candidates highlighted by our
staff of experts.
G - Previously featured
in past reports as yellow but may no longer be buyable under the
guidelines.
***Last / Change / Volume data in this table is the closing quote data***
Symbol/Exchange
Company Name
Industry Group |
PRICE |
CHANGE
(%Change) |
Day High |
Volume
(% DAV)
(% 50 day avg vol) |
52 Wk Hi
% From Hi |
Featured
Date |
Price
Featured |
Pivot Featured |
|
Max Buy |
ASPS
-
NASDAQ
Altisource Ptf Sltns Sa
REAL ESTATE - Property Management/Developmen
|
$113.50
|
-1.91
-1.65% |
$116.27
|
166,506
78.58% of 50 DAV
50 DAV is 211,900
|
$129.72
-12.50%
|
9/24/2012
|
$87.24
|
PP = $92.39
|
|
MB = $97.01
|
 Most Recent Note - 10/31/2012 6:00:42 PM
G - Pulled back from its 52-week and all-time highs with a 3rd consecutive loss today. Previously noted - "Very extended from its prior base, its prior highs in the $92 area define initial support to watch on pullbacks."
>>> The latest Featured Stock Update with an annotated graph appeared on 10/12/2012. Click here.
View all notes |
Alert me of new notes |
CANSLIM.net Company Profile |
SEC |
Zacks Reports |
StockTalk |
News |
Chart |
Request a new note
C
A N
S L
I M


|
BRLI
-
NASDAQ
Bio Reference Labs Inc
HEALTH SERVICES - Medical Laboratories and Researc
|
$27.76
|
-0.26
-0.93% |
$28.00
|
471,808
137.27% of 50 DAV
50 DAV is 343,700
|
$32.86
-15.52%
|
10/3/2012
|
$30.90
|
PP = $30.25
|
|
MB = $31.76
|
Most Recent Note - 10/26/2012 4:24:20 PM
G - Damaging losses for 6 consecutive sessions undercut prior highs in the $30 area and violated its 50 DMA line triggering technical sell signals and raising serious concerns.
>>> The latest Featured Stock Update with an annotated graph appeared on 10/8/2012. Click here.
View all notes |
Alert me of new notes |
CANSLIM.net Company Profile |
SEC |
Zacks Reports |
StockTalk |
News |
Chart |
Request a new note
C
A N
S L
I M
|
CFNL
-
NASDAQ
Cardinal Financial Corp
BANKING - Regional - Southeast Banks
|
$15.97
|
+0.17
1.08% |
$16.07
|
172,419
168.38% of 50 DAV
50 DAV is 102,400
|
$15.94
0.19%
|
8/17/2012
|
$12.84
|
PP = $13.31
|
|
MB = $13.98
|
Most Recent Note - 10/31/2012 12:01:49 PM
G - Getting more extended from its prior base, on track today for a 5th consecutive gain while hitting another new 52-week high. Found support at its 50 DMA line in recent months.
>>> The latest Featured Stock Update with an annotated graph appeared on 10/25/2012. Click here.
View all notes |
Alert me of new notes |
CANSLIM.net Company Profile |
SEC |
Zacks Reports |
StockTalk |
News |
Chart |
Request a new note
C
A N
S L
I M
|
CMCSA
-
NASDAQ
Comcast Corp Cl A
MEDIA - CATV Systems
|
$37.53
|
-0.04
-0.09% |
$37.85
|
16,202,471
134.18% of 50 DAV
50 DAV is 12,075,100
|
$37.78
-0.67%
|
6/11/2012
|
$29.94
|
PP = $30.98
|
|
MB = $32.53
|
Most Recent Note - 10/26/2012 11:59:12 AM
G - Rallying near its 52-week high today. Upward trendline and 50 DMA line define near term support where violations would trigger technical sell signals. Fundamental concerns have been repeatedly noted - "Due to sub par sales and earnings growth in the Jun '12 quarter."
>>> The latest Featured Stock Update with an annotated graph appeared on 10/24/2012. Click here.
View all notes |
Alert me of new notes |
CANSLIM.net Company Profile |
SEC |
Zacks Reports |
StockTalk |
News |
Chart |
Request a new note
C
A N
S L
I M
|
DVA
-
NYSE
Davita Inc
HEALTH SERVICES - Specialized Health Services
|
$112.52
|
+1.50
1.35% |
$114.85
|
1,061,767
135.07% of 50 DAV
50 DAV is 786,100
|
$113.48
-0.85%
|
9/5/2012
|
$102.92
|
PP = $100.62
|
|
MB = $105.65
|
Most Recent Note - 10/31/2012 4:32:17 PM
G - Reported earnings +3% on +12% sales for the Sep '12 quarter, below the guidelines of the fact-based system. Hit a new 52-week high today with a gain backed by above average volume, getting more extended from its latest sound base. Prior highs near $100 and its 50 DMA line define near-term support to watch on pullbacks where violations may trigger technical sell signals.
>>> The latest Featured Stock Update with an annotated graph appeared on 10/10/2012. Click here.
View all notes |
Alert me of new notes |
CANSLIM.net Company Profile |
SEC |
Zacks Reports |
StockTalk |
News |
Chart |
Request a new note
C
A N
S L
I M
|
Symbol/Exchange
Company Name
Industry Group |
PRICE |
CHANGE
(%Change) |
Day High |
Volume
(% DAV)
(% 50 day avg vol) |
52 Wk Hi
% From Hi |
Featured
Date |
Price
Featured |
Pivot Featured |
|
Max Buy |
GPX
-
NYSE
G P Strategies Corp
DIVERSIFIED SERVICES - Education and Training Services
|
$19.25
|
-0.44
-2.23% |
$19.59
|
63,016
109.78% of 50 DAV
50 DAV is 57,400
|
$20.67
-6.87%
|
10/8/2012
|
$20.00
|
PP = $20.77
|
|
MB = $21.81
|
Most Recent Note - 10/31/2012 4:34:19 PM
G - Down today with above average volume. Gains have lacked volume conviction since violating its 50 DMA line, and that important short-term average has acted as resistance. Gains above its 50 DMA line are needed for its outlook to improve
>>> The latest Featured Stock Update with an annotated graph appeared on 10/16/2012. Click here.
View all notes |
Alert me of new notes |
CANSLIM.net Company Profile |
SEC |
Zacks Reports |
StockTalk |
News |
Chart |
Request a new note
C
A N
S L
I M
|
LKQ
-
NASDAQ
L K Q Corp
WHOLESALE - Auto Parts
|
$20.87
|
+0.11
0.53% |
$21.00
|
1,692,252
108.62% of 50 DAV
50 DAV is 1,557,900
|
$21.22
-1.63%
|
8/9/2012
|
$18.97
|
PP = $18.72
|
|
MB = $19.66
|
Most Recent Note - 10/26/2012 4:19:02 PM
G - Rallied with above average volume today following a pullback near its 50 DMA line on the prior session. Showed resilience after reporting earnings +6% on +30% sales revenues for the Sep '12 quarter, below the +25% minimum earnings guideline (C criteria), raising fundamental concerns. Still perched near its 52-week high, and no resistance remains due to overhead supply.
>>> The latest Featured Stock Update with an annotated graph appeared on 10/19/2012. Click here.
View all notes |
Alert me of new notes |
CANSLIM.net Company Profile |
SEC |
Zacks Reports |
StockTalk |
News |
Chart |
Request a new note
C
A N
S L
I M
|
MIDD
-
NASDAQ
Middleby Corp
MANUFACTURING - Diversified Machinery
|
$124.95
|
+1.31
1.06% |
$125.57
|
97,378
131.06% of 50 DAV
50 DAV is 74,300
|
$124.23
0.58%
|
10/8/2012
|
$118.46
|
PP = $122.67
|
|
MB = $128.80
|
Most Recent Note - 10/26/2012 4:25:47 PM
Y - Finished just -0.5% off its 52-week high today. Volume totals have been below average in recent weeks while stubbornly holding its ground. Subsequent volume-driven gains above the pivot point may confirm a new (or add-on) technical buy signal. Its 50 DMA line and recent lows define near-term chart support to watch.
>>> The latest Featured Stock Update with an annotated graph appeared on 10/22/2012. Click here.
View all notes |
Alert me of new notes |
CANSLIM.net Company Profile |
SEC |
Zacks Reports |
StockTalk |
News |
Chart |
Request a new note
C
A N
S L
I M
|
N
-
NYSE
Netsuite Inc
DIVERSIFIED SERVICES - Business/Management Services
|
$63.51
|
-1.89
-2.89% |
$65.35
|
882,379
176.48% of 50 DAV
50 DAV is 500,000
|
$67.02
-5.24%
|
8/20/2012
|
$55.88
|
PP = $59.32
|
|
MB = $62.29
|
Most Recent Note - 10/31/2012 12:53:04 PM
G - Reported earnings +60% on +31% sales revenues for the Sep '12 quarter. Pulling back today following a considerable 10/26/12 gap up and volume-driven gain from below its 50 DMA line for new 52-week and all-time highs. It did not form a sound new base pattern. Until the major averages are back in a confirmed rally the M criteria argues against any new buying efforts.
>>> The latest Featured Stock Update with an annotated graph appeared on 10/26/2012. Click here.
View all notes |
Alert me of new notes |
CANSLIM.net Company Profile |
SEC |
Zacks Reports |
StockTalk |
News |
Chart |
Request a new note
C
A N
S L
I M
|
NSM
-
NYSE
Nationstar Mtg Hldgs Inc
FINANCIAL SERVICES - Credit Services
|
$36.13
|
+1.90
5.55% |
$36.45
|
1,410,388
93.60% of 50 DAV
50 DAV is 1,506,900
|
$37.20
-2.88%
|
8/29/2012
|
$27.96
|
PP = $28.85
|
|
MB = $30.29
|
Most Recent Note - 10/31/2012 4:37:24 PM
G - Rallied today with below average volume, tallying a 3rd consecutive gain and finishing at a best-ever close. It has not formed a sound new base pattern.
>>> The latest Featured Stock Update with an annotated graph appeared on 10/11/2012. Click here.
View all notes |
Alert me of new notes |
CANSLIM.net Company Profile |
SEC |
Zacks Reports |
StockTalk |
News |
Chart |
Request a new note
C
A N
S L
I M
|
Symbol/Exchange
Company Name
Industry Group |
PRICE |
CHANGE
(%Change) |
Day High |
Volume
(% DAV)
(% 50 day avg vol) |
52 Wk Hi
% From Hi |
Featured
Date |
Price
Featured |
Pivot Featured |
|
Max Buy |
OSIS
-
NASDAQ
O S I Systems Inc
ELECTRONICS - Semiconductor Equipment and Mate
|
$79.25
|
-0.51
-0.64% |
$80.21
|
69,867
60.23% of 50 DAV
50 DAV is 116,000
|
$81.23
-2.44%
|
9/5/2012
|
$74.39
|
PP = $75.10
|
|
MB = $78.86
|
Most Recent Note - 10/31/2012 4:38:44 PM
G - Recently found prompt support at its 50 DMA line, and it is still slightly extended from its prior base.
>>> The latest Featured Stock Update with an annotated graph appeared on 10/18/2012. Click here.
View all notes |
Alert me of new notes |
CANSLIM.net Company Profile |
SEC |
Zacks Reports |
StockTalk |
News |
Chart |
Request a new note
C
A N
S L
I M
|
RNF
-
NYSE
Rentech Nitrogen Ptnr Lp
CHEMICALS - Agricultural Chemicals
|
$38.41
|
+0.64
1.69% |
$38.41
|
315,987
87.19% of 50 DAV
50 DAV is 362,400
|
$40.05
-4.09%
|
7/27/2012
|
$29.58
|
PP = $30.60
|
|
MB = $32.13
|
Most Recent Note - 10/31/2012 5:15:08 PM
G - Found support at its 50 DMA line defining important near-term support after the previously noted upward trendline violation. It may be building a new base pattern. Disciplined investors know to watch for the market direction (M criteria) to be noted as favorable again before acting on any new buy candidates
>>> The latest Featured Stock Update with an annotated graph appeared on 10/4/2012. Click here.
View all notes |
Alert me of new notes |
CANSLIM.net Company Profile |
SEC |
Zacks Reports |
StockTalk |
News |
Chart |
Request a new note
C
A N
S L
I M
|
TDG
-
NYSE
Transdigm Group Inc
AEROSPACE/DEFENSE - Aerospace/Defense Products and; Services
|
$133.21
|
-2.23
-1.65% |
$136.69
|
798,547
156.46% of 50 DAV
50 DAV is 510,400
|
$139.31
-4.38%
|
8/16/2012
|
$132.23
|
PP = $136.44
|
|
MB = $143.26
|
Most Recent Note - 10/31/2012 5:17:08 PM
G - Pulled back today and finished near the session low with above average volume behind its loss. When last noted on 10/23/12 it undercut its 50 DMA line following a special dividend, yet it promptly rebounded back above that important short-term average.
>>> The latest Featured Stock Update with an annotated graph appeared on 10/23/2012. Click here.
View all notes |
Alert me of new notes |
CANSLIM.net Company Profile |
SEC |
Zacks Reports |
StockTalk |
News |
Chart |
Request a new note
C
A N
S L
I M
|
ULTA
-
NASDAQ
Ulta Salon Cosm & Frag
SPECIALTY RETAIL - Specialty Retail, Other
|
$92.19
|
-0.22
-0.24% |
$92.85
|
434,283
58.35% of 50 DAV
50 DAV is 744,300
|
$103.52
-10.94%
|
9/4/2012
|
$93.17
|
PP = $98.52
|
|
MB = $103.45
|
Most Recent Note - 10/31/2012 5:18:51 PM
G - Still sputtering below its 50 DMA line, and a rebound above that important short-term average is needed for its outlook to improve. Its 200 DMA line ($90.20 now) defines near-term support to watch.
>>> The latest Featured Stock Update with an annotated graph appeared on 10/5/2012. Click here.
View all notes |
Alert me of new notes |
CANSLIM.net Company Profile |
SEC |
Zacks Reports |
StockTalk |
News |
Chart |
Request a new note
C
A N
S L
I M
|
ULTI
-
NASDAQ
Ultimate Software Group
INTERNET - Internet Software and Services
|
$101.36
|
+4.43
4.57% |
$101.97
|
399,754
271.57% of 50 DAV
50 DAV is 147,200
|
$106.40
-4.74%
|
10/31/2012
|
$101.36
|
PP = $105.00
|
|
MB = $110.25
|
Most Recent Note - 10/31/2012 5:55:21 PM
Y - Reported earnings +61% on +22% sales revenues for the Sep '12 quarter. A big volume-driven gain and strong close today helped it rebound above its 50 DMA line improving its technical stance. Color code is changed to yellow with new pivot point cited based on its 10/04/12 high while still building on a 9-week "double bottom" base pattern. See latest FSU analysis for more details and a new annotated graph.
>>> The latest Featured Stock Update with an annotated graph appeared on 10/31/2012. Click here.
View all notes |
Alert me of new notes |
CANSLIM.net Company Profile |
SEC |
Zacks Reports |
StockTalk |
News |
Chart |
Request a new note
C
A N
S L
I M
|
Symbol/Exchange
Company Name
Industry Group |
PRICE |
CHANGE
(%Change) |
Day High |
Volume
(% DAV)
(% 50 day avg vol) |
52 Wk Hi
% From Hi |
Featured
Date |
Price
Featured |
Pivot Featured |
|
Max Buy |
VSI
-
NYSE
Vitamin Shoppe Inc
SPECIALTY RETAIL - Specialty Retail, Other
|
$57.24
|
-0.14
-0.24% |
$57.82
|
258,541
94.81% of 50 DAV
50 DAV is 272,700
|
$61.83
-7.42%
|
10/15/2012
|
$57.82
|
PP = $60.08
|
|
MB = $63.08
|
Most Recent Note - 10/31/2012 5:57:23 PM
G - Volume was near average today while consolidating near its 50 DMA line. Subsequent volume-driven gains for new highs are needed to trigger a new technical buy signal.
>>> The latest Featured Stock Update with an annotated graph appeared on 10/15/2012. Click here.
View all notes |
Alert me of new notes |
CANSLIM.net Company Profile |
SEC |
Zacks Reports |
StockTalk |
News |
Chart |
Request a new note
C
A N
S L
I M
|
WPI
-
NYSE
Watson Pharmaceuticals
DRUGS - Drugs - Generic
|
$85.95
|
-0.69
-0.80% |
$87.05
|
1,245,604
139.06% of 50 DAV
50 DAV is 895,700
|
$89.90
-4.39%
|
8/24/2012
|
$82.90
|
PP = $81.10
|
|
MB = $85.16
|
Most Recent Note - 10/31/2012 5:58:56 PM
G - Down today with above average volume, testing its 50 DMA line which defines important near-term support to watch. Retreating to just -4.4% from its 52-week high with a distributional loss.
>>> The latest Featured Stock Update with an annotated graph appeared on 9/28/2012. Click here.
View all notes |
Alert me of new notes |
CANSLIM.net Company Profile |
SEC |
Zacks Reports |
StockTalk |
News |
Chart |
Request a new note
C
A N
S L
I M
|
|
|
|
THESE ARE NOT BUY RECOMMENDATIONS!
Comments contained in the body of this report are technical
opinions only. The material herein has been obtained
from sources believed to be reliable and accurate, however,
its accuracy and completeness cannot be guaranteed.
This site is not an investment advisor, hence it does
not endorse or recommend any securities or other investments.
Any recommendation contained in this report may not
be suitable for all investors and it is not to be deemed
an offer or solicitation on our part with respect to
the purchase or sale of any securities. All trademarks,
service marks and trade names appearing in this report
are the property of their respective owners, and are
likewise used for identification purposes only.
This report is a service available
only to active Paid Premium Members.
You may opt-out of receiving report notifications
at any time. Questions or comments may be submitted
by writing to Premium Membership Services 665 S.E. 10 Street, Suite 201 Deerfield Beach, FL 33441-5634 or by calling 1-800-965-8307
or 954-785-1121.
|
|
|

