***Last / Change / Volume data in this table is the closing quote data***
Symbol/Exchange
Company Name
Industry Group |
PRICE |
CHANGE
(%Change) |
Day High |
Volume
(% DAV)
(% 50 day avg vol) |
52 Wk Hi
% From Hi |
Featured
Date |
Price
Featured |
Pivot Featured |
|
Max Buy |
AVG
-
NYSE
A V G Technologies N.V.
INTERNET - Internet Software and Services
|
$19.61
|
-3.16
-13.88% |
$22.09
|
4,964,549
612.30% of 50 DAV
50 DAV is 810,800
|
$26.56
-26.16%
|
9/13/2013
|
$23.06
|
PP = $23.88
|
|
MB = $25.07
|
 Most Recent Note - 10/30/2013 2:04:21 PM
Gapped down today for another damaging volume-driven loss following an analyst downgrade. A rebound above its 50 DMA line is needed for its outlook to improve. It will be dropped from the Featured Stocks list tonight based on technical deterioration. Due to report its third quarter 2013 financial results for the period ended September 30, 2013 following the close of market on November 7, 2013.
>>> FEATURED STOCK ARTICLE : Valid Secondary Buy Point After Resilient at 10-Week Moving Average - 10/21/2013
View all notes |
Set NEW NOTE alert |
CANSLIM.net Company Profile |
SEC
News |
Chart |
Request a new note
C
A N
S L
I M


|
BITA
-
NYSE
Bitauto Hldgs Ltd Ads
INTERNET - Internet Information Providers
|
$23.96
|
-1.10
-4.39% |
$25.80
|
1,310,324
162.33% of 50 DAV
50 DAV is 807,200
|
$28.48
-15.87%
|
9/24/2013
|
$16.40
|
PP = $17.31
|
|
MB = $18.18
|
Most Recent Note - 10/30/2013 2:06:47 PM
G - Down considerably for its 3rd volume-driven loss in the span of 4 sessions. Wider than usual intra-day price swings in recent days is a worrisome sign of uncertainty while it remains very extended from its prior base. Prior highs in the $18 area define initial support to watch on pullbacks.
>>> FEATURED STOCK ARTICLE : Volume-Driven Gains Cleared Latest Pivot Point - 10/2/2013
View all notes |
Set NEW NOTE alert |
CANSLIM.net Company Profile |
SEC
News |
Chart |
Request a new note
C
A N
S L
I M
|
BLOX
-
NYSE
Infoblox Inc
COMPUTER HARDWARE - Networking and Communication Dev
|
$44.09
|
-0.71
-1.58% |
$45.62
|
676,567
84.33% of 50 DAV
50 DAV is 802,300
|
$48.97
-9.96%
|
10/11/2013
|
$43.02
|
PP = $45.60
|
|
MB = $47.88
|
Most Recent Note - 10/30/2013 3:08:22 PM
Y - Retreating today on lighter volume however it has slumped below prior highs in the $45 area defining initial support to watch raising some concern. Prior volume-driven gains above the pivot point triggered a technical buy signal. Disciplined investors avoid chasing "extended" stocks and limit losses by selling any stock that falls more than -7% from their purchase price.
>>> FEATURED STOCK ARTICLE : Finished Another Week Higher With Volume Behind Gains - 10/11/2013
View all notes |
Set NEW NOTE alert |
CANSLIM.net Company Profile |
SEC
News |
Chart |
Request a new note
C
A N
S L
I M
|
CELG
-
NASDAQ
Celgene Corp
DRUGS - Drug Manufacturers - Major
|
$151.32
|
-3.99
-2.57% |
$157.00
|
3,246,554
120.86% of 50 DAV
50 DAV is 2,686,300
|
$161.64
-6.39%
|
9/12/2013
|
$149.50
|
PP = $150.02
|
|
MB = $157.52
|
Most Recent Note - 10/30/2013 3:13:19 PM
G - Slumping near its 50 DMA line with today's 5th loss in 6 sessions while retreating from all-time highs. Its 50 DMA line ($150.07 now) defines important near-term support while the prior low ($143.13 on 10/09/13) is the next technical support level where subsequent violations may trigger technical sell signals.
>>> FEATURED STOCK ARTICLE : Volume-Driven Gain Challenging New Pivot Point - 9/20/2013
View all notes |
Set NEW NOTE alert |
CANSLIM.net Company Profile |
SEC
News |
Chart |
Request a new note
C
A N
S L
I M
|
EGBN
-
NASDAQ
Eagle Bancorp Inc
BANKING - Regional - Mid-Atlantic Banks
|
$27.45
|
-0.17
-0.62% |
$27.84
|
20,324
28.27% of 50 DAV
50 DAV is 71,900
|
$29.92
-8.26%
|
9/16/2013
|
$27.48
|
PP = $27.77
|
|
MB = $29.16
|
Most Recent Note - 10/30/2013 3:16:25 PM
G - Previously noted that its fundamental and technical deterioration has raised concerns. Trading near recent low ($26.88 on 10/08/13) and its 50 DMA line (now $27.35) defining near-term support where subsequent violations may trigger more worrisome technical sell signals.
>>> FEATURED STOCK ARTICLE : Fundamental and Technical Deterioration Raising Concerns - 10/23/2013
View all notes |
Set NEW NOTE alert |
CANSLIM.net Company Profile |
SEC
News |
Chart |
Request a new note
C
A N
S L
I M
|
Symbol/Exchange
Company Name
Industry Group |
PRICE |
CHANGE
(%Change) |
Day High |
Volume
(% DAV)
(% 50 day avg vol) |
52 Wk Hi
% From Hi |
Featured
Date |
Price
Featured |
Pivot Featured |
|
Max Buy |
EGOV
-
NASDAQ
N I C Inc
INTERNET - Internet Software and Services
|
$24.75
|
-0.32
-1.28% |
$25.39
|
256,518
86.96% of 50 DAV
50 DAV is 295,000
|
$25.99
-4.77%
|
10/18/2013
|
$25.17
|
PP = $23.66
|
|
MB = $24.84
|
Most Recent Note - 10/28/2013 6:46:25 PM
Y - Holding its ground perched in a tight range near its 52-week high following a technical breakout from a "double bottom" base on 10/18/13.
>>> FEATURED STOCK ARTICLE : Technical Breakout From "Double Bottom" Base on 3 Times Average Volume - 10/18/2013
View all notes |
Set NEW NOTE alert |
CANSLIM.net Company Profile |
SEC
News |
Chart |
Request a new note
C
A N
S L
I M
|
FLT
-
NYSE
Fleetcor Technologies
DIVERSIFIED SERVICES - Business/Management Services
|
$107.16
|
-4.08
-3.67% |
$113.65
|
1,600,633
216.59% of 50 DAV
50 DAV is 739,000
|
$114.16
-6.13%
|
8/19/2013
|
$99.01
|
PP = $100.97
|
|
MB = $106.02
|
Most Recent Note - 10/30/2013 3:19:55 PM
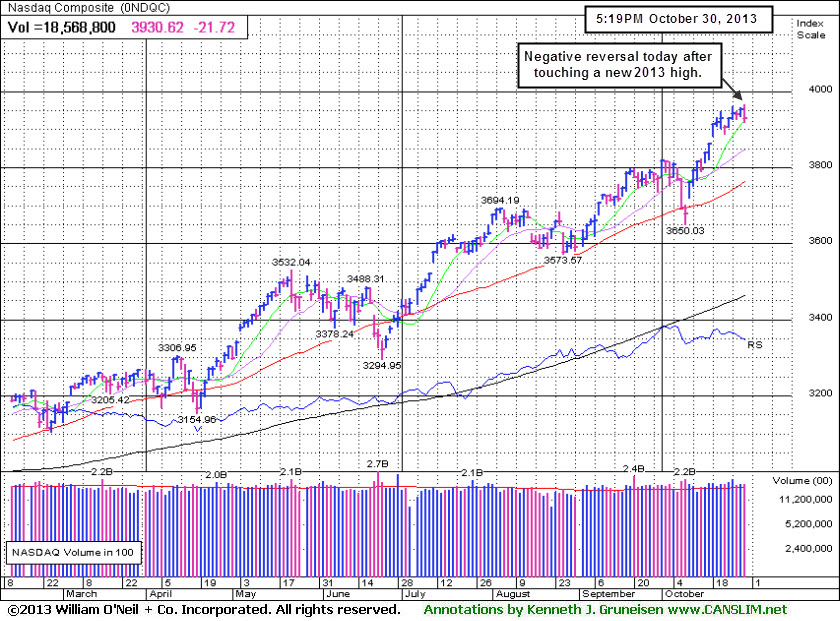
G - After early gain today challenging its 52-week high there was a"negative reversal" and it is testing support near its 50 DMA line. Deterioration below that important short-term average would raise concerns, and a breach of its 10/09/13 lows would raise more serious concerns.
>>> FEATURED STOCK ARTICLE : Extended After 13 Weekly Gains in Span of 14 Weeks - 10/7/2013
View all notes |
Set NEW NOTE alert |
CANSLIM.net Company Profile |
SEC
News |
Chart |
Request a new note
C
A N
S L
I M
|
GNRC
-
NYSE
Generac Hldgs Inc
CONSUMER DURABLES - Electronic Equipment
|
$49.17
|
-0.48
-0.97% |
$50.13
|
727,167
89.31% of 50 DAV
50 DAV is 814,200
|
$52.32
-6.02%
|
10/24/2013
|
$47.46
|
PP = $44.24
|
|
MB = $46.45
|
Most Recent Note - 10/30/2013 6:06:38 PM
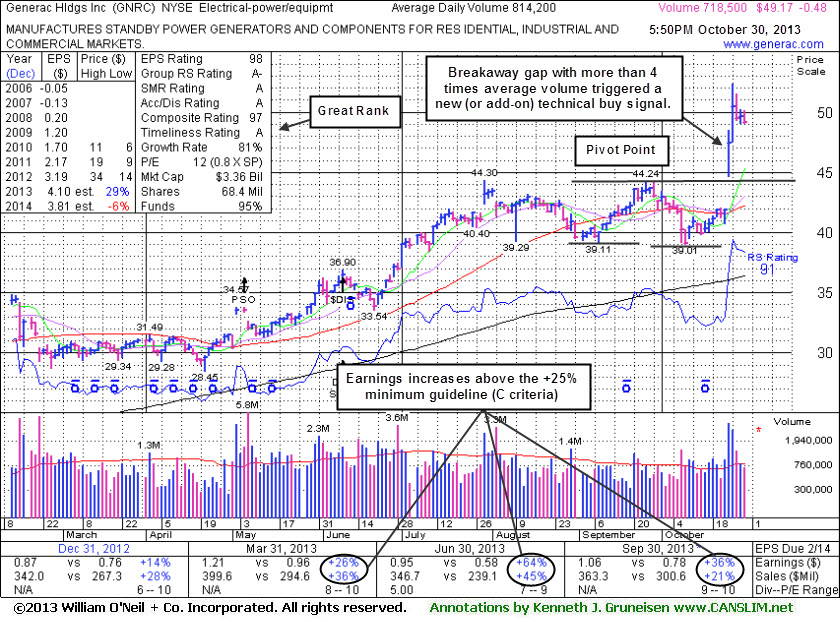
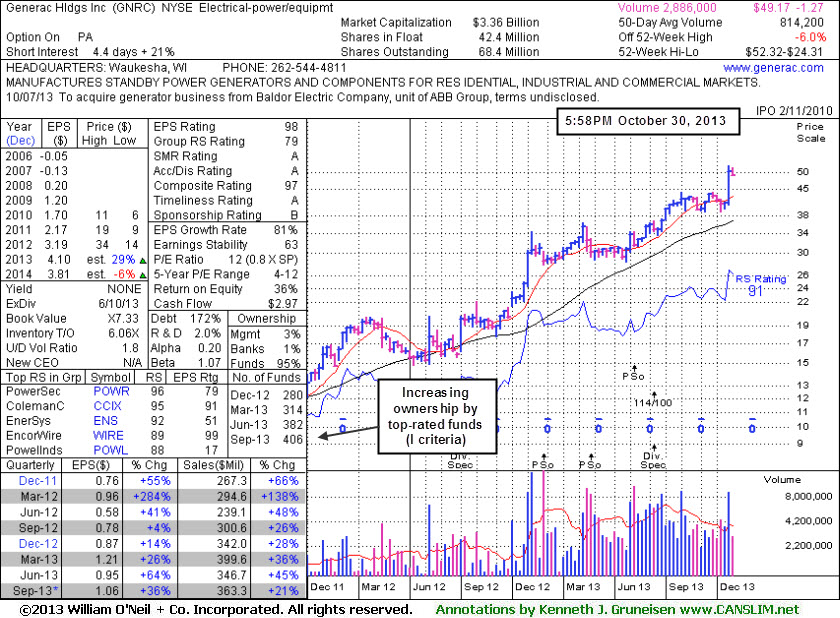
G - Consolidating after quickly getting very extended from its latest base after highlighted in yellow with new pivot point cited based on its 9/25/13 high in the 10/24/13 mid-day report (read here) after a considerable "breakaway gap" triggered a technical buy signal. See the latest FSU analysis for more details and new annotated daily and weekly graphs.
>>> FEATURED STOCK ARTICLE : Consolidating After "Breakway Gap" With 4 Times Average Volume - 10/30/2013
View all notes |
Set NEW NOTE alert |
CANSLIM.net Company Profile |
SEC
News |
Chart |
Request a new note
C
A N
S L
I M
|
JAZZ
-
NASDAQ
Jazz Pharmaceuticals Plc
DRUGS - Biotechnology
|
$90.71
|
-1.32
-1.43% |
$92.89
|
404,465
58.00% of 50 DAV
50 DAV is 697,400
|
$95.24
-4.76%
|
9/30/2013
|
$93.20
|
PP = $89.10
|
|
MB = $93.56
|
Most Recent Note - 10/24/2013 5:48:33 PM
G- Rallied to a new 52-week high today with its 7th consecutive gain, and its color code is changed to green after rising above its "max buy" level.
>>> FEATURED STOCK ARTICLE : Strong Finish With High Volume Indicative of Accumulation - 9/30/2013
View all notes |
Set NEW NOTE alert |
CANSLIM.net Company Profile |
SEC
News |
Chart |
Request a new note
C
A N
S L
I M
|
KORS
-
NYSE
Michael Kors Hldgs Ltd
RETAIL - Apparel Stores
|
$77.98
|
+0.60
0.78% |
$78.75
|
6,277,622
195.55% of 50 DAV
50 DAV is 3,210,200
|
$78.83
-1.08%
|
8/6/2013
|
$69.66
|
PP = $66.28
|
|
MB = $69.59
|
Most Recent Note - 10/30/2013 12:59:33 PM
G - Trading heavy volume behind recent gains but making limited price progress versus prior highs in the $78 area, noted as sign it has been enduring distributional pressure. Recent low ($70.59 on 10/09/13) defines the next important near-term support area below its 50 DMA line ($74.64 now).
>>> FEATURED STOCK ARTICLE : Extended From Base After Additional Volume-Driven Gains - 9/27/2013
View all notes |
Set NEW NOTE alert |
CANSLIM.net Company Profile |
SEC
News |
Chart |
Request a new note
C
A N
S L
I M
|
Symbol/Exchange
Company Name
Industry Group |
PRICE |
CHANGE
(%Change) |
Day High |
Volume
(% DAV)
(% 50 day avg vol) |
52 Wk Hi
% From Hi |
Featured
Date |
Price
Featured |
Pivot Featured |
|
Max Buy |
LOPE
-
NASDAQ
Grand Canyon Education
DIVERSIFIED SERVICES - Education and; Training Services
|
$47.89
|
+4.54
10.47% |
$50.48
|
2,300,949
687.88% of 50 DAV
50 DAV is 334,500
|
$44.62
7.33%
|
6/19/2013
|
$31.47
|
PP = $34.17
|
|
MB = $35.88
|
Most Recent Note - 10/30/2013 1:13:29 PM
G - Gapped up today for a considerable volume-driven gain and another new all-time high. Reported earnings +17% on +14% sales revenues for the Sep '13 quarter, its 2nd quarterly comparison. Fundamental concerns remain while technical action has been reassuring.
>>> FEATURED STOCK ARTICLE : Formed Advanced Base But Fundamental Concerns Remain - 10/14/2013
View all notes |
Set NEW NOTE alert |
CANSLIM.net Company Profile |
SEC
News |
Chart |
Request a new note
C
A N
S L
I M
|
MRLN
-
NASDAQ
Marlin Business Services
DIVERSIFIED SERVICES - Rental and Leasing Services
|
$27.70
|
+0.02
0.07% |
$28.01
|
20,014
64.15% of 50 DAV
50 DAV is 31,200
|
$28.64
-3.28%
|
9/9/2013
|
$23.75
|
PP = $24.03
|
|
MB = $25.23
|
Most Recent Note - 10/24/2013 5:44:18 PM
G - Hit a new 52-week high today with another gain on light volume. Found support at its 50 DMA line on the last pullback. Subsequent losses below the recent low ($23.25) would trigger a more worrisome technical sell signal.
>>> FEATURED STOCK ARTICLE : Faring Better Than Others While Testing 50-Day Average Line - 10/8/2013
View all notes |
Set NEW NOTE alert |
CANSLIM.net Company Profile |
SEC
News |
Chart |
Request a new note
C
A N
S L
I M
|
NOAH
-
NYSE
Noah Holdings Ltd Ads
FINANCIAL SERVICES - Asset Management
|
$19.42
|
+0.30
1.57% |
$19.91
|
825,611
103.98% of 50 DAV
50 DAV is 794,000
|
$22.99
-15.53%
|
10/15/2013
|
$19.10
|
PP = $18.33
|
|
MB = $19.25
|
Most Recent Note - 10/29/2013 3:28:33 PM
Y - Rebounding today after testing support at its 50 DMA line, and its color code is changed to yellow. Disciplined investors always limit losses by selling if any stock falls more than -7% from their purchase price.
>>> FEATURED STOCK ARTICLE : Finished Strong With Gain on 4 Times Average Volume - 10/15/2013
View all notes |
Set NEW NOTE alert |
CANSLIM.net Company Profile |
SEC
News |
Chart |
Request a new note
C
A N
S L
I M
|
OII
-
NYSE
Oceaneering Intl Inc
ENERGY - Oil and Gas Drilling and Explorati
|
$86.68
|
+0.27
0.31% |
$87.62
|
706,752
109.93% of 50 DAV
50 DAV is 642,900
|
$87.64
-1.10%
|
10/16/2013
|
$83.08
|
PP = $84.74
|
|
MB = $88.98
|
Most Recent Note - 10/29/2013 3:31:30 PM
Y - Rising within close striking distance of its best-ever close with today's 4th consecutive gain helping it rebound above its pivot point. Its 50 DMA line and recent lows define near-term support in the $82 area.
>>> FEATURED STOCK ARTICLE : Forming Set-Up Above 50-Day Moving Average Line - 10/16/2013
View all notes |
Set NEW NOTE alert |
CANSLIM.net Company Profile |
SEC
News |
Chart |
Request a new note
C
A N
S L
I M
|
PCLN
-
NASDAQ
Priceline.Com Inc
INTERNET - Internet Software and Services
|
$1,068.55
|
-0.97
-0.09% |
$1,078.00
|
362,934
68.61% of 50 DAV
50 DAV is 529,000
|
$1,098.70
-2.74%
|
9/13/2013
|
$966.82
|
PP = $995.08
|
|
MB = $1,044.83
|
Most Recent Note - 10/29/2013 6:10:03 PM
G - Hovering near its 52-week high, extended from any sound base. Found support near its 50 DMA line then rallied to new highs with volume-driven gains. see the latest FSU analysis for more details and new annotated daily and weekly graphs.
>>> FEATURED STOCK ARTICLE : Rallied to New Highs Following Pullback to 50-day Average - 10/29/2013
View all notes |
Set NEW NOTE alert |
CANSLIM.net Company Profile |
SEC
News |
Chart |
Request a new note
C
A N
S L
I M
|
Symbol/Exchange
Company Name
Industry Group |
PRICE |
CHANGE
(%Change) |
Day High |
Volume
(% DAV)
(% 50 day avg vol) |
52 Wk Hi
% From Hi |
Featured
Date |
Price
Featured |
Pivot Featured |
|
Max Buy |
PRAA
-
NASDAQ
Portfolio Recovery Assoc
DIVERSIFIED SERVICES - Business/Management Services
|
$62.94
|
-0.43
-0.68% |
$63.96
|
392,291
100.85% of 50 DAV
50 DAV is 389,000
|
$63.56
-0.98%
|
10/17/2013
|
$60.75
|
PP = $61.70
|
|
MB = $64.79
|
Most Recent Note - 10/28/2013 6:48:21 PM
Y - Today's gain on light volume helped it rise to a best-ever close. Pivot point cited was based on its 9/26/13 high plus 10 cents after forming an advanced "3-weeks tight" base. Subsequent volume-driven gains may clinch a proper new (or add-on) technical buy signal.
>>> FEATURED STOCK ARTICLE : Wedging to New Highs With Gains Lacking Volume Conviction - 9/26/2013
View all notes |
Set NEW NOTE alert |
CANSLIM.net Company Profile |
SEC
News |
Chart |
Request a new note
C
A N
S L
I M
|
PRLB
-
NYSE
Proto Labs Inc
MANUFACTURING - Small Tools and Accessories
|
$84.00
|
-2.56
-2.96% |
$88.27
|
539,633
159.37% of 50 DAV
50 DAV is 338,600
|
$88.63
-5.22%
|
7/29/2013
|
$64.86
|
PP = $67.50
|
|
MB = $70.88
|
Most Recent Note - 10/30/2013 3:22:10 PM
G - After early gains today challenging its 52-week high it reversed into the red for a loss on higher volume indicative of distributional pressure. It remains extended from a sound base after steadily rallying since finding prompt support at its 50 DMA line.
>>> FEATURED STOCK ARTICLE : Extended Following Additional Volume-Driven Gains - 9/25/2013
View all notes |
Set NEW NOTE alert |
CANSLIM.net Company Profile |
SEC
News |
Chart |
Request a new note
C
A N
S L
I M
|
SFUN
-
NYSE
Soufun Hldgs Ltd Ads A
INTERNET - Internet Information Providers
|
$49.91
|
-1.11
-2.18% |
$52.43
|
1,037,910
72.63% of 50 DAV
50 DAV is 1,429,100
|
$59.50
-16.12%
|
10/17/2013
|
$58.02
|
PP = $53.87
|
|
MB = $56.56
|
Most Recent Note - 10/28/2013 1:48:51 PM
Y - Halted its slide today after undercutting prior highs in the $53 area and slumping into its prior base with 5 consecutive losses marked by ever-increasing volume. Its 50 DMA line ($48.09 now) defines important near-term support to watch.
>>> FEATURED STOCK ARTICLE : Following Great Rally No New Base Has Been Formed - 10/1/2013
View all notes |
Set NEW NOTE alert |
CANSLIM.net Company Profile |
SEC
News |
Chart |
Request a new note
C
A N
S L
I M
|
SSNC
-
NASDAQ
S S & C Technologies
COMPUTER SOFTWARE and SERVICES - Application Software
|
$39.41
|
-0.17
-0.43% |
$39.80
|
215,726
53.92% of 50 DAV
50 DAV is 400,100
|
$39.99
-1.45%
|
10/22/2013
|
$39.17
|
PP = $40.04
|
|
MB = $42.04
|
Most Recent Note - 10/29/2013 3:36:16 PM
Y - Volume totals have been cooling while recently wedging higher and it touched a new 52-week high today but reversed into the red. Subsequent volume-driven gains above the pivot point may trigger a new (or add-on) technical buy signal.
>>> FEATURED STOCK ARTICLE : Finding Support Near 50-Day Average After Secondary Offering - 10/4/2013
View all notes |
Set NEW NOTE alert |
CANSLIM.net Company Profile |
SEC
News |
Chart |
Request a new note
C
A N
S L
I M
|
SSYS
-
NASDAQ
Stratasys Ltd
COMPUTER HARDWARE - Computer Peripherals
|
$112.67
|
+3.74
3.43% |
$112.75
|
1,072,703
96.20% of 50 DAV
50 DAV is 1,115,100
|
$113.49
-0.72%
|
10/11/2013
|
$102.94
|
PP = $105.38
|
|
MB = $110.65
|
Most Recent Note - 10/30/2013 3:27:43 PM
G - Poised for a possible new high close with today's gain challenging its 52-week high. Color code is changed to green while rallying back above its "max buy" level. Found support above prior highs in the $105 area when consolidating after rallying from a "double bottom" base. Recent gains lacked higher volume indicative of heavy institutional buying demand.
>>> FEATURED STOCK ARTICLE : Faltering and Relative Strength Waning After Offering - 10/9/2013
View all notes |
Set NEW NOTE alert |
CANSLIM.net Company Profile |
SEC
News |
Chart |
Request a new note
C
A N
S L
I M
|
Symbol/Exchange
Company Name
Industry Group |
PRICE |
CHANGE
(%Change) |
Day High |
Volume
(% DAV)
(% 50 day avg vol) |
52 Wk Hi
% From Hi |
Featured
Date |
Price
Featured |
Pivot Featured |
|
Max Buy |
STMP
-
NASDAQ
Stamps.Com Inc
INTERNET - Internet Software and Services
|
$45.96
|
-0.93
-1.98% |
$47.38
|
108,863
98.43% of 50 DAV
50 DAV is 110,600
|
$49.40
-6.96%
|
9/24/2013
|
$45.54
|
PP = $46.57
|
|
MB = $48.90
|
Most Recent Note - 10/28/2013 6:44:19 PM
G - Churning above average volume perched near its 52-week high and above its 50 DMA line. Fundamental concerns were raised by waning sales revenues and earnings increases. Reported earnings +24% on +7% sales revenues for the Sep '13 quarter, just below the +25% minimum earnings guideline (C criteria).
>>> FEATURED STOCK ARTICLE : Forming New Set-Up After 50-Day Average Acted as Support - 9/24/2013
View all notes |
Set NEW NOTE alert |
CANSLIM.net Company Profile |
SEC
News |
Chart |
Request a new note
C
A N
S L
I M
|
TBBK
-
NASDAQ
Bancorp Inc
BANKING - Regional - Mid-Atlantic Banks
|
$16.64
|
-0.18
-1.07% |
$16.91
|
209,651
103.17% of 50 DAV
50 DAV is 203,200
|
$19.14
-13.06%
|
9/4/2013
|
$16.26
|
PP = $16.79
|
|
MB = $17.63
|
Most Recent Note - 10/25/2013 1:01:38 PM
G - Reported earnings +18% for the Sep '13 quarter, below the +25% minimum guideline (C criteria) for buy candidates raising concerns. Violated recent lows in the $17.25 area and its 50 DMA line with today's damaging volume-driven loss, yet it has recovered from early lows.
>>> FEATURED STOCK ARTICLE : Encountering Distributional Pressure While Consolidating Above Prior Highs - 10/3/2013
View all notes |
Set NEW NOTE alert |
CANSLIM.net Company Profile |
SEC
News |
Chart |
Request a new note
C
A N
S L
I M
|
TNGO
-
NASDAQ
Tangoe Inc
COMPUTER SOFTWARE and SERVICES - Technical and System Software
|
$19.55
|
-1.30
-6.24% |
$20.65
|
2,307,162
322.95% of 50 DAV
50 DAV is 714,400
|
$26.05
-24.95%
|
9/12/2013
|
$21.30
|
PP = $23.15
|
|
MB = $24.31
|
Most Recent Note - 10/30/2013 2:09:56 PM
Down again today for a 4th consecutive volume-driven loss while slumping further below its 50 DMA line. It will be dropped from the Featured Stocks list tonight due to technical deterioration. A subsequent rebound above its 50 DMA line is needed to help its outlook improve.
>>> FEATURED STOCK ARTICLE : Impressive Weekly Winning Streak Ends - 10/25/2013
View all notes |
Set NEW NOTE alert |
CANSLIM.net Company Profile |
SEC
News |
Chart |
Request a new note
C
A N
S L
I M
|
ULTI
-
NASDAQ
Ultimate Software Group
INTERNET - Internet Software and Services
|
$157.43
|
+4.25
2.77% |
$162.88
|
332,484
232.18% of 50 DAV
50 DAV is 143,200
|
$156.61
0.52%
|
10/16/2013
|
$142.95
|
PP = $151.18
|
|
MB = $158.74
|
Most Recent Note - 10/30/2013 1:55:16 PM
G - Hit another new 52-week high with today's 5th consecutive gain, rallying just beyond its "max buy" level and its color code is changed to green while getting extended from its prior base. Volume-driven gains were noted when a technical buy signal was triggered. Disciplined investors avoid chasing extended stocks that have rallied more than +5% above their prior highs.
>>> FEATURED STOCK ARTICLE : Hovering Less Than -5% From 52-Week High - 10/17/2013
View all notes |
Set NEW NOTE alert |
CANSLIM.net Company Profile |
SEC
News |
Chart |
Request a new note
C
A N
S L
I M
|
VRX
-
NYSE
Valeant Pharmaceuticals
DRUGS - Drug Manufacturers - Other
|
$109.06
|
-2.00
-1.80% |
$111.93
|
1,543,256
144.26% of 50 DAV
50 DAV is 1,069,800
|
$115.40
-5.49%
|
9/11/2013
|
$100.26
|
PP = $105.50
|
|
MB = $110.78
|
Most Recent Note - 10/30/2013 3:03:59 PM
Y- Retreating from its all-time high hit last week with above average volume behind today's loss and its color code is changed to yellow while slumping below its "max buy" level. Prior highs in the $105 area and its 50 DMA line define near-term support where subsequent violations may trigger a technical sell signal.
>>> FEATURED STOCK ARTICLE : Found Support Above Prior Highs on Pullback - 10/10/2013
View all notes |
Set NEW NOTE alert |
CANSLIM.net Company Profile |
SEC
News |
Chart |
Request a new note
C
A N
S L
I M
|
Symbol/Exchange
Company Name
Industry Group |
PRICE |
CHANGE
(%Change) |
Day High |
Volume
(% DAV)
(% 50 day avg vol) |
52 Wk Hi
% From Hi |
Featured
Date |
Price
Featured |
Pivot Featured |
|
Max Buy |
YNDX
-
NASDAQ
Yandex N V Class A
INTERNET - Internet Information Providers
|
$37.31
|
-0.48
-1.27% |
$38.61
|
1,828,716
69.43% of 50 DAV
50 DAV is 2,633,800
|
$42.00
-11.17%
|
9/5/2013
|
$34.24
|
PP = $34.79
|
|
MB = $36.53
|
Most Recent Note - 10/28/2013 6:37:11 PM
G - Consolidating above its 50 DMA line and recent lows defining support after getting extended. See the latest FSU analysis for more details and new annotated daily and weekly graphs.
>>> FEATURED STOCK ARTICLE : Consolidating After Getting Extended From Sound Base - 10/28/2013
View all notes |
Set NEW NOTE alert |
CANSLIM.net Company Profile |
SEC
News |
Chart |
Request a new note
C
A N
S L
I M
|