Symbol/Exchange
Company Name
Industry Group |
PRICE |
CHANGE
(%Change) |
Day High |
Volume
(% DAV)
(% 50 day avg vol) |
52 Wk Hi
% From Hi |
Featured
Date |
Price
Featured |
Pivot Featured |
|
Max Buy |
AVG
-
NYSE
A V G Technologies N.V.
INTERNET - Internet Software and Services
|
$22.77
|
+0.29
1.29% |
$22.77
|
410,045
50.65% of 50 DAV
50 DAV is 809,500
|
$26.56
-14.26%
|
9/13/2013
|
$23.06
|
PP = $23.88
|
|
MB = $25.07
|
Most Recent Note - 10/25/2013 3:05:22 PM
G - Slumping further below its 50 DMA line with higher volume behind today's damaging loss. A rebound above its 50 DMA line is needed for its outlook to improve.
>>> FEATURED STOCK ARTICLE : Valid Secondary Buy Point After Resilient at 10-Week Moving Average - 10/21/2013
View all notes |
Set NEW NOTE alert |
CANSLIM.net Company Profile |
SEC
News |
Chart |
Request a new note
C
A N
S L
I M


|
BITA
-
NYSE
Bitauto Hldgs Ltd Ads
INTERNET - Internet Information Providers
|
$25.06
|
+2.00
8.67% |
$25.18
|
1,347,206
170.08% of 50 DAV
50 DAV is 792,100
|
$28.48
-12.01%
|
9/24/2013
|
$16.40
|
PP = $17.31
|
|
MB = $18.18
|
 Most Recent Note - 10/29/2013 3:26:17 PM
G - Rebounding with above average volume behind today's solid gain. It is very extended from its prior base. Prior highs in the $18 area define initial support to watch on pullbacks.
>>> FEATURED STOCK ARTICLE : Volume-Driven Gains Cleared Latest Pivot Point - 10/2/2013
View all notes |
Set NEW NOTE alert |
CANSLIM.net Company Profile |
SEC
News |
Chart |
Request a new note
C
A N
S L
I M
|
BLOX
-
NYSE
Infoblox Inc
COMPUTER HARDWARE - Networking and Communication Dev
|
$44.80
|
-0.61
-1.34% |
$46.17
|
495,432
62.22% of 50 DAV
50 DAV is 796,300
|
$48.97
-8.51%
|
10/11/2013
|
$43.02
|
PP = $45.60
|
|
MB = $47.88
|
Most Recent Note - 10/23/2013 12:01:47 PM
Y - Abruptly retreating from its new 52-week high with today's considerable loss. Prior highs in the $45 area define initial support to watch. Disciplined investors avoid chasing "extended" stocks and limit losses by selling any stock that falls more than -7% from their purchase price.
>>> FEATURED STOCK ARTICLE : Finished Another Week Higher With Volume Behind Gains - 10/11/2013
View all notes |
Set NEW NOTE alert |
CANSLIM.net Company Profile |
SEC
News |
Chart |
Request a new note
C
A N
S L
I M
|
CELG
-
NASDAQ
Celgene Corp
DRUGS - Drug Manufacturers - Major
|
$155.31
|
-0.92
-0.59% |
$157.19
|
2,484,957
93.00% of 50 DAV
50 DAV is 2,671,900
|
$161.64
-3.92%
|
9/12/2013
|
$149.50
|
PP = $150.02
|
|
MB = $157.52
|
Most Recent Note - 10/24/2013 5:35:24 PM
G - Encountered distributional pressure today yet remains perched near all-time highs. The recent low ($143.13 on 10/09/13) defines important near-term support where a subsequent violation may trigger a more worrisome technical sell signal.
>>> FEATURED STOCK ARTICLE : Volume-Driven Gain Challenging New Pivot Point - 9/20/2013
View all notes |
Set NEW NOTE alert |
CANSLIM.net Company Profile |
SEC
News |
Chart |
Request a new note
C
A N
S L
I M
|
EGBN
-
NASDAQ
Eagle Bancorp Inc
BANKING - Regional - Mid-Atlantic Banks
|
$27.62
|
-0.34
-1.22% |
$27.96
|
33,990
47.34% of 50 DAV
50 DAV is 71,800
|
$29.92
-7.69%
|
9/16/2013
|
$27.48
|
PP = $27.77
|
|
MB = $29.16
|
Most Recent Note - 10/23/2013 6:10:21 PM
G - Color code is changed to green after fundamental and technical deterioration has raised concerns. See the latest FSU analysis for more details and new annotated daily and weekly graphs. Recent lows and its 50 DMA line define near-term support.
>>> FEATURED STOCK ARTICLE : Fundamental and Technical Deterioration Raising Concerns - 10/23/2013
View all notes |
Set NEW NOTE alert |
CANSLIM.net Company Profile |
SEC
News |
Chart |
Request a new note
C
A N
S L
I M
|
Symbol/Exchange
Company Name
Industry Group |
PRICE |
CHANGE
(%Change) |
Day High |
Volume
(% DAV)
(% 50 day avg vol) |
52 Wk Hi
% From Hi |
Featured
Date |
Price
Featured |
Pivot Featured |
|
Max Buy |
EGOV
-
NASDAQ
N I C Inc
INTERNET - Internet Software and Services
|
$25.07
|
+0.38
1.54% |
$25.10
|
226,064
76.48% of 50 DAV
50 DAV is 295,600
|
$25.99
-3.54%
|
10/18/2013
|
$25.17
|
PP = $23.66
|
|
MB = $24.84
|
Most Recent Note - 10/28/2013 6:46:25 PM
Y - Holding its ground perched in a tight range near its 52-week high following a technical breakout from a "double bottom" base on 10/18/13.
>>> FEATURED STOCK ARTICLE : Technical Breakout From "Double Bottom" Base on 3 Times Average Volume - 10/18/2013
View all notes |
Set NEW NOTE alert |
CANSLIM.net Company Profile |
SEC
News |
Chart |
Request a new note
C
A N
S L
I M
|
FLT
-
NYSE
Fleetcor Technologies
DIVERSIFIED SERVICES - Business/Management Services
|
$111.24
|
+2.77
2.55% |
$111.24
|
575,278
78.38% of 50 DAV
50 DAV is 734,000
|
$114.16
-2.56%
|
8/19/2013
|
$99.01
|
PP = $100.97
|
|
MB = $106.02
|
Most Recent Note - 10/23/2013 6:01:03 PM
G - Perched at its all-time high, extended from any sound base. Found prompt support near its 50 DMA line that helped its outlook after enduring distributional pressure.
>>> FEATURED STOCK ARTICLE : Extended After 13 Weekly Gains in Span of 14 Weeks - 10/7/2013
View all notes |
Set NEW NOTE alert |
CANSLIM.net Company Profile |
SEC
News |
Chart |
Request a new note
C
A N
S L
I M
|
GNRC
-
NYSE
Generac Hldgs Inc
CONSUMER DURABLES - Electronic Equipment
|
$49.65
|
+0.16
0.32% |
$50.19
|
832,185
103.07% of 50 DAV
50 DAV is 807,400
|
$52.32
-5.10%
|
10/24/2013
|
$47.46
|
PP = $44.24
|
|
MB = $46.45
|
Most Recent Note - 10/25/2013 12:35:39 PM
G - Color code is changed to green after quickly getting very extended from its latest base. It was highlighted in yellow with new pivot point cited based on its 9/25/13 high in the prior mid-day report (read here) as a considerable "breakaway gap" triggered a technical buy signal after it gapped up from its 50 DMA line. Reported earnings +36% on +21% sales revenues for the Sep '13 quarter, continuing its strong earnings increases satisfying the C criteria.
>>> FEATURED STOCK ARTICLE : Pullback Following Friday's Technical Buy Signal - 9/23/2013
View all notes |
Set NEW NOTE alert |
CANSLIM.net Company Profile |
SEC
News |
Chart |
Request a new note
C
A N
S L
I M
|
JAZZ
-
NASDAQ
Jazz Pharmaceuticals Plc
DRUGS - Biotechnology
|
$92.03
|
-0.45
-0.49% |
$93.15
|
525,652
75.41% of 50 DAV
50 DAV is 697,100
|
$95.24
-3.37%
|
9/30/2013
|
$93.20
|
PP = $89.10
|
|
MB = $93.56
|
Most Recent Note - 10/24/2013 5:48:33 PM
G- Rallied to a new 52-week high today with its 7th consecutive gain, and its color code is changed to green after rising above its "max buy" level.
>>> FEATURED STOCK ARTICLE : Strong Finish With High Volume Indicative of Accumulation - 9/30/2013
View all notes |
Set NEW NOTE alert |
CANSLIM.net Company Profile |
SEC
News |
Chart |
Request a new note
C
A N
S L
I M
|
KORS
-
NYSE
Michael Kors Hldgs Ltd
RETAIL - Apparel Stores
|
$77.38
|
+0.98
1.28% |
$78.82
|
14,479,968
488.96% of 50 DAV
50 DAV is 2,961,400
|
$78.83
-1.84%
|
8/6/2013
|
$69.66
|
PP = $66.28
|
|
MB = $69.59
|
Most Recent Note - 10/29/2013 1:12:22 PM
G - Trading heavy volume today yet making limited price progress versus prior highs in the $78 area, enduring distributional pressure. Recent low ($70.59 on 10/09/13) defines the next important near-term support area.
>>> FEATURED STOCK ARTICLE : Extended From Base After Additional Volume-Driven Gains - 9/27/2013
View all notes |
Set NEW NOTE alert |
CANSLIM.net Company Profile |
SEC
News |
Chart |
Request a new note
C
A N
S L
I M
|
Symbol/Exchange
Company Name
Industry Group |
PRICE |
CHANGE
(%Change) |
Day High |
Volume
(% DAV)
(% 50 day avg vol) |
52 Wk Hi
% From Hi |
Featured
Date |
Price
Featured |
Pivot Featured |
|
Max Buy |
LOPE
-
NASDAQ
Grand Canyon Education
DIVERSIFIED SERVICES - Education and; Training Services
|
$43.35
|
+0.33
0.77% |
$44.14
|
651,741
197.80% of 50 DAV
50 DAV is 329,500
|
$44.62
-2.85%
|
6/19/2013
|
$31.47
|
PP = $34.17
|
|
MB = $35.88
|
Most Recent Note - 10/23/2013 5:56:30 PM
G - Volume-driven gain today for another new all-time high. Fundamental concerns remain while technical action has been reassuring.
>>> FEATURED STOCK ARTICLE : Formed Advanced Base But Fundamental Concerns Remain - 10/14/2013
View all notes |
Set NEW NOTE alert |
CANSLIM.net Company Profile |
SEC
News |
Chart |
Request a new note
C
A N
S L
I M
|
MRLN
-
NASDAQ
Marlin Business Services
DIVERSIFIED SERVICES - Rental and Leasing Services
|
$27.68
|
-0.38
-1.35% |
$28.01
|
11,013
34.42% of 50 DAV
50 DAV is 32,000
|
$28.64
-3.35%
|
9/9/2013
|
$23.75
|
PP = $24.03
|
|
MB = $25.23
|
Most Recent Note - 10/24/2013 5:44:18 PM
G - Hit a new 52-week high today with another gain on light volume. Found support at its 50 DMA line on the last pullback. Subsequent losses below the recent low ($23.25) would trigger a more worrisome technical sell signal.
>>> FEATURED STOCK ARTICLE : Faring Better Than Others While Testing 50-Day Average Line - 10/8/2013
View all notes |
Set NEW NOTE alert |
CANSLIM.net Company Profile |
SEC
News |
Chart |
Request a new note
C
A N
S L
I M
|
NOAH
-
NYSE
Noah Holdings Ltd Ads
FINANCIAL SERVICES - Asset Management
|
$19.12
|
+1.72
9.89% |
$19.19
|
1,141,065
146.69% of 50 DAV
50 DAV is 777,900
|
$22.99
-16.83%
|
10/15/2013
|
$19.10
|
PP = $18.33
|
|
MB = $19.25
|
Most Recent Note - 10/29/2013 3:28:33 PM
Y - Rebounding today after testing support at its 50 DMA line, and its color code is changed to yellow. Disciplined investors always limit losses by selling if any stock falls more than -7% from their purchase price.
>>> FEATURED STOCK ARTICLE : Finished Strong With Gain on 4 Times Average Volume - 10/15/2013
View all notes |
Set NEW NOTE alert |
CANSLIM.net Company Profile |
SEC
News |
Chart |
Request a new note
C
A N
S L
I M
|
OII
-
NYSE
Oceaneering Intl Inc
ENERGY - Oil and Gas Drilling and Explorati
|
$86.41
|
+1.87
2.21% |
$86.70
|
916,334
145.13% of 50 DAV
50 DAV is 631,400
|
$87.64
-1.40%
|
10/16/2013
|
$83.08
|
PP = $84.74
|
|
MB = $88.98
|
Most Recent Note - 10/29/2013 3:31:30 PM
Y - Rising within close striking distance of its best-ever close with today's 4th consecutive gain helping it rebound above its pivot point. Its 50 DMA line and recent lows define near-term support in the $82 area.
>>> FEATURED STOCK ARTICLE : Forming Set-Up Above 50-Day Moving Average Line - 10/16/2013
View all notes |
Set NEW NOTE alert |
CANSLIM.net Company Profile |
SEC
News |
Chart |
Request a new note
C
A N
S L
I M
|
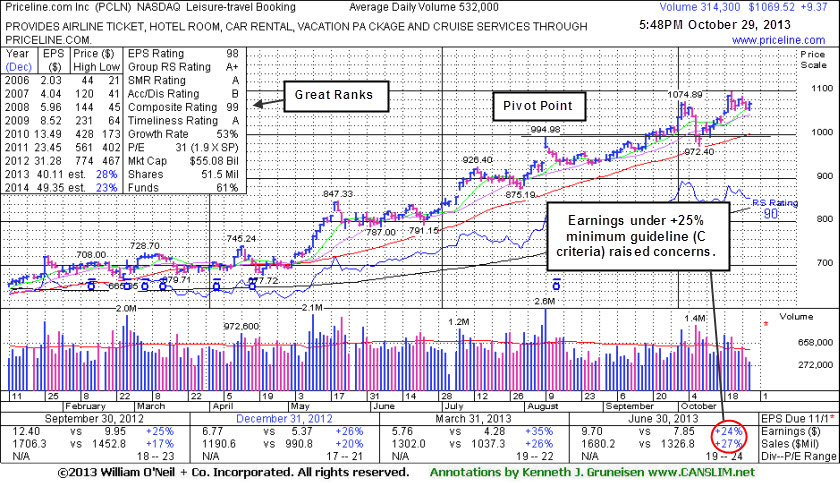
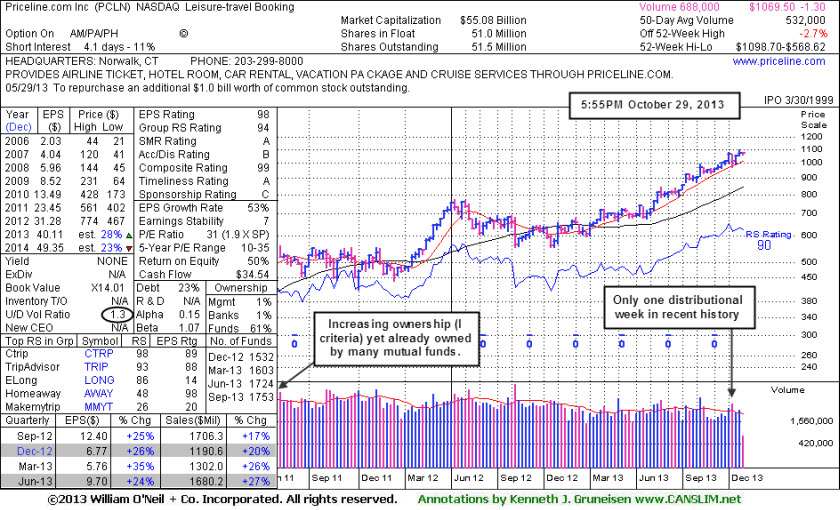
PCLN
-
NASDAQ
Priceline.Com Inc
INTERNET - Internet Software and Services
|
$1,069.52
|
+9.37
0.88% |
$1,075.00
|
315,154
59.24% of 50 DAV
50 DAV is 532,000
|
$1,098.70
-2.66%
|
9/13/2013
|
$966.82
|
PP = $995.08
|
|
MB = $1,044.83
|
Most Recent Note - 10/29/2013 6:10:03 PM
G - Hovering near its 52-week high, extended from any sound base. Found support near its 50 DMA line then rallied to new highs with volume-driven gains. see the latest FSU analysis for more details and new annotated daily and weekly graphs.
>>> FEATURED STOCK ARTICLE : Rallied to New Highs Following Pullback to 50-day Average - 10/29/2013
View all notes |
Set NEW NOTE alert |
CANSLIM.net Company Profile |
SEC
News |
Chart |
Request a new note
C
A N
S L
I M
|
Symbol/Exchange
Company Name
Industry Group |
PRICE |
CHANGE
(%Change) |
Day High |
Volume
(% DAV)
(% 50 day avg vol) |
52 Wk Hi
% From Hi |
Featured
Date |
Price
Featured |
Pivot Featured |
|
Max Buy |
PRAA
-
NASDAQ
Portfolio Recovery Assoc
DIVERSIFIED SERVICES - Business/Management Services
|
$63.37
|
+1.15
1.85% |
$63.56
|
414,659
105.65% of 50 DAV
50 DAV is 392,500
|
$62.40
1.56%
|
10/17/2013
|
$60.75
|
PP = $61.70
|
|
MB = $64.79
|
Most Recent Note - 10/28/2013 6:48:21 PM
Y - Today's gain on light volume helped it rise to a best-ever close. Pivot point cited was based on its 9/26/13 high plus 10 cents after forming an advanced "3-weeks tight" base. Subsequent volume-driven gains may clinch a proper new (or add-on) technical buy signal.
>>> FEATURED STOCK ARTICLE : Wedging to New Highs With Gains Lacking Volume Conviction - 9/26/2013
View all notes |
Set NEW NOTE alert |
CANSLIM.net Company Profile |
SEC
News |
Chart |
Request a new note
C
A N
S L
I M
|
PRLB
-
NYSE
Proto Labs Inc
MANUFACTURING - Small Tools and Accessories
|
$86.56
|
+0.23
0.27% |
$88.39
|
253,118
74.78% of 50 DAV
50 DAV is 338,500
|
$88.63
-2.34%
|
7/29/2013
|
$64.86
|
PP = $67.50
|
|
MB = $70.88
|
Most Recent Note - 10/24/2013 5:49:34 PM
G - Hit another new 52-week high today, getting more extended from a sound base. Steadily rallying since finding prompt support at its 50 DMA line.
>>> FEATURED STOCK ARTICLE : Extended Following Additional Volume-Driven Gains - 9/25/2013
View all notes |
Set NEW NOTE alert |
CANSLIM.net Company Profile |
SEC
News |
Chart |
Request a new note
C
A N
S L
I M
|
SFUN
-
NYSE
Soufun Hldgs Ltd Ads A
INTERNET - Internet Information Providers
|
$51.02
|
+1.00
2.00% |
$51.30
|
1,182,738
82.58% of 50 DAV
50 DAV is 1,432,200
|
$59.50
-14.25%
|
10/17/2013
|
$58.02
|
PP = $53.87
|
|
MB = $56.56
|
Most Recent Note - 10/28/2013 1:48:51 PM
Y - Halted its slide today after undercutting prior highs in the $53 area and slumping into its prior base with 5 consecutive losses marked by ever-increasing volume. Its 50 DMA line ($48.09 now) defines important near-term support to watch.
>>> FEATURED STOCK ARTICLE : Following Great Rally No New Base Has Been Formed - 10/1/2013
View all notes |
Set NEW NOTE alert |
CANSLIM.net Company Profile |
SEC
News |
Chart |
Request a new note
C
A N
S L
I M
|
SSNC
-
NASDAQ
S S & C Technologies
COMPUTER SOFTWARE and SERVICES - Application Software
|
$39.58
|
+0.08
0.20% |
$39.99
|
160,264
39.87% of 50 DAV
50 DAV is 402,000
|
$39.94
-0.90%
|
10/22/2013
|
$39.17
|
PP = $40.04
|
|
MB = $42.04
|
Most Recent Note - 10/29/2013 3:36:16 PM
Y - Volume totals have been cooling while recently wedging higher and it touched a new 52-week high today but reversed into the red. Subsequent volume-driven gains above the pivot point may trigger a new (or add-on) technical buy signal.
>>> FEATURED STOCK ARTICLE : Finding Support Near 50-Day Average After Secondary Offering - 10/4/2013
View all notes |
Set NEW NOTE alert |
CANSLIM.net Company Profile |
SEC
News |
Chart |
Request a new note
C
A N
S L
I M
|
SSYS
-
NASDAQ
Stratasys Ltd
COMPUTER HARDWARE - Computer Peripherals
|
$108.93
|
+2.79
2.63% |
$109.45
|
988,976
87.70% of 50 DAV
50 DAV is 1,127,700
|
$113.49
-4.02%
|
10/11/2013
|
$102.94
|
PP = $105.38
|
|
MB = $110.65
|
Most Recent Note - 10/29/2013 3:37:28 PM
Y - Managed a positive reversal from early lows today near its 50 DMA line. Recently paused near its "max buy" level after rallying from a "double bottom" base with gains backed by above average but not especially strong volume. Gains must have at least +40% above average volume to trigger a proper technical buy signal, so confirming gains with higher volume would be a welcome reassurance in the days to come.
>>> FEATURED STOCK ARTICLE : Faltering and Relative Strength Waning After Offering - 10/9/2013
View all notes |
Set NEW NOTE alert |
CANSLIM.net Company Profile |
SEC
News |
Chart |
Request a new note
C
A N
S L
I M
|
Symbol/Exchange
Company Name
Industry Group |
PRICE |
CHANGE
(%Change) |
Day High |
Volume
(% DAV)
(% 50 day avg vol) |
52 Wk Hi
% From Hi |
Featured
Date |
Price
Featured |
Pivot Featured |
|
Max Buy |
STMP
-
NASDAQ
Stamps.Com Inc
INTERNET - Internet Software and Services
|
$46.89
|
+0.25
0.54% |
$47.38
|
101,221
90.94% of 50 DAV
50 DAV is 111,300
|
$49.40
-5.08%
|
9/24/2013
|
$45.54
|
PP = $46.57
|
|
MB = $48.90
|
Most Recent Note - 10/28/2013 6:44:19 PM
G - Churning above average volume perched near its 52-week high and above its 50 DMA line. Fundamental concerns were raised by waning sales revenues and earnings increases. Reported earnings +24% on +7% sales revenues for the Sep '13 quarter, just below the +25% minimum earnings guideline (C criteria).
>>> FEATURED STOCK ARTICLE : Forming New Set-Up After 50-Day Average Acted as Support - 9/24/2013
View all notes |
Set NEW NOTE alert |
CANSLIM.net Company Profile |
SEC
News |
Chart |
Request a new note
C
A N
S L
I M
|
TBBK
-
NASDAQ
Bancorp Inc
BANKING - Regional - Mid-Atlantic Banks
|
$16.82
|
-0.09
-0.53% |
$17.06
|
319,436
161.41% of 50 DAV
50 DAV is 197,900
|
$19.14
-12.12%
|
9/4/2013
|
$16.26
|
PP = $16.79
|
|
MB = $17.63
|
Most Recent Note - 10/25/2013 1:01:38 PM
G - Reported earnings +18% for the Sep '13 quarter, below the +25% minimum guideline (C criteria) for buy candidates raising concerns. Violated recent lows in the $17.25 area and its 50 DMA line with today's damaging volume-driven loss, yet it has recovered from early lows.
>>> FEATURED STOCK ARTICLE : Encountering Distributional Pressure While Consolidating Above Prior Highs - 10/3/2013
View all notes |
Set NEW NOTE alert |
CANSLIM.net Company Profile |
SEC
News |
Chart |
Request a new note
C
A N
S L
I M
|
TNGO
-
NASDAQ
Tangoe Inc
COMPUTER SOFTWARE and SERVICES - Technical and System Software
|
$20.85
|
-1.81
-7.99% |
$23.12
|
2,368,686
352.59% of 50 DAV
50 DAV is 671,800
|
$26.05
-19.96%
|
9/12/2013
|
$21.30
|
PP = $23.15
|
|
MB = $24.31
|
Most Recent Note - 10/29/2013 3:24:40 PM
G - Color code is changed to green while today's volume-driven loss violated its prior lows and its 50 DMA line raising serious concerns and triggering technical sell signals. Only a prompt rebound above the 50 DMA line would help its outlook improve.
>>> FEATURED STOCK ARTICLE : Impressive Weekly Winning Streak Ends - 10/25/2013
View all notes |
Set NEW NOTE alert |
CANSLIM.net Company Profile |
SEC
News |
Chart |
Request a new note
C
A N
S L
I M
|
ULTI
-
NASDAQ
Ultimate Software Group
INTERNET - Internet Software and Services
|
$153.18
|
+0.15
0.10% |
$156.61
|
482,508
357.15% of 50 DAV
50 DAV is 135,100
|
$153.89
-0.46%
|
10/16/2013
|
$142.95
|
PP = $151.18
|
|
MB = $158.74
|
Most Recent Note - 10/29/2013 1:28:26 PM
Y - Hit another new 52-week high today but reversed into the red, a sign it is encountering distributional pressure. It remains above its pivot point, and its 50 DMA line defines near-term support. Disciplined investors limit losses by always selling any stock that falls more than -7% from their purchase price.
>>> FEATURED STOCK ARTICLE : Hovering Less Than -5% From 52-Week High - 10/17/2013
View all notes |
Set NEW NOTE alert |
CANSLIM.net Company Profile |
SEC
News |
Chart |
Request a new note
C
A N
S L
I M
|
VRX
-
NYSE
Valeant Pharmaceuticals
DRUGS - Drug Manufacturers - Other
|
$111.06
|
+0.64
0.58% |
$112.33
|
1,017,396
94.16% of 50 DAV
50 DAV is 1,080,500
|
$115.40
-3.76%
|
9/11/2013
|
$100.26
|
PP = $105.50
|
|
MB = $110.78
|
Most Recent Note - 10/24/2013 5:39:24 PM
G- Hovering near all-time highs, extended from any sound base. Found support above prior highs defining important support in the $105 area.
>>> FEATURED STOCK ARTICLE : Found Support Above Prior Highs on Pullback - 10/10/2013
View all notes |
Set NEW NOTE alert |
CANSLIM.net Company Profile |
SEC
News |
Chart |
Request a new note
C
A N
S L
I M
|
Symbol/Exchange
Company Name
Industry Group |
PRICE |
CHANGE
(%Change) |
Day High |
Volume
(% DAV)
(% 50 day avg vol) |
52 Wk Hi
% From Hi |
Featured
Date |
Price
Featured |
Pivot Featured |
|
Max Buy |
YNDX
-
NASDAQ
Yandex N V Class A
INTERNET - Internet Information Providers
|
$37.79
|
-0.37
-0.97% |
$38.50
|
4,280,487
163.78% of 50 DAV
50 DAV is 2,613,600
|
$42.00
-10.02%
|
9/5/2013
|
$34.24
|
PP = $34.79
|
|
MB = $36.53
|
Most Recent Note - 10/28/2013 6:37:11 PM
G - Consolidating above its 50 DMA line and recent lows defining support after getting extended. See the latest FSU analysis for more details and new annotated daily and weekly graphs.
>>> FEATURED STOCK ARTICLE : Consolidating After Getting Extended From Sound Base - 10/28/2013
View all notes |
Set NEW NOTE alert |
CANSLIM.net Company Profile |
SEC
News |
Chart |
Request a new note
C
A N
S L
I M
|