***Last / Change / Volume data in this table is the closing quote data***
Symbol/Exchange
Company Name
Industry Group |
PRICE |
CHANGE
(%Change) |
Day High |
Volume
(% DAV)
(% 50 day avg vol) |
52 Wk Hi
% From Hi |
Featured
Date |
Price
Featured |
Pivot Featured |
|
Max Buy |
ABV
-
NYSE
Comp De Bebidas Adr
FOOD and BEVERAGE - Beverages - Brewers
|
$139.24
|
+3.79
2.80% |
$139.40
|
812,954
120.49% of 50 DAV
50 DAV is 674,700
|
$143.53
-2.99%
|
6/29/2010
|
$104.74
|
PP = $109.33
|
|
MB = $114.80
|
 Most Recent Note - 10/29/2010 5:38:29 PM
G - Gapped up today, rebounding after a couple of distribution days this week. Extended from a sound base, its 50 DMA line ($123.04 now) defines support.
>>> The latest Featured Stock Update with an annotated graph appeared on 10/11/2010. Click here.
View all notes |
Alert me of new notes |
CANSLIM.net Company Profile |
SEC |
Zacks Reports |
StockTalk |
News |
Chart |
Request a new note
C
A N
S L
I M


|
ARUN
-
NASDAQ
Aruba Networks Inc
COMPUTER HARDWARE - Networking andamp; Communication Dev
|
$21.93
|
+0.44
2.05% |
$22.07
|
1,835,508
73.36% of 50 DAV
50 DAV is 2,501,900
|
$22.80
-3.82%
|
8/30/2010
|
$18.12
|
PP = $18.51
|
|
MB = $19.44
|
Most Recent Note - 10/29/2010 5:43:23 PM
G - Considerable gain this week, finishing just 31 cents off its best-ever close. Found great support near its 50 DMA line during its recent 5-week consolidation near its 2007 all-time highs.
>>> The latest Featured Stock Update with an annotated graph appeared on 10/26/2010. Click here.
View all notes |
Alert me of new notes |
CANSLIM.net Company Profile |
SEC |
Zacks Reports |
StockTalk |
News |
Chart |
Request a new note
C
A N
S L
I M
|
BIDU
-
NASDAQ
Baidu Inc Ads
INTERNET - Internet Information Providers
|
$110.01
|
-2.16
-1.93% |
$111.97
|
8,415,756
74.67% of 50 DAV
50 DAV is 11,270,500
|
$113.78
-3.31%
|
9/17/2010
|
$85.73
|
PP = $88.42
|
|
MB = $92.84
|
Most Recent Note - 10/29/2010 4:23:27 PM
G - Stubbornly holding its ground after gains with above average volume for all-time highs. Extended from a sound base pattern, the nearest support is recent chart lows near $95-96 which come into play above its 50 DMA line.
>>> The latest Featured Stock Update with an annotated graph appeared on 10/7/2010. Click here.
View all notes |
Alert me of new notes |
CANSLIM.net Company Profile |
SEC |
Zacks Reports |
StockTalk |
News |
Chart |
Request a new note
C
A N
S L
I M
|
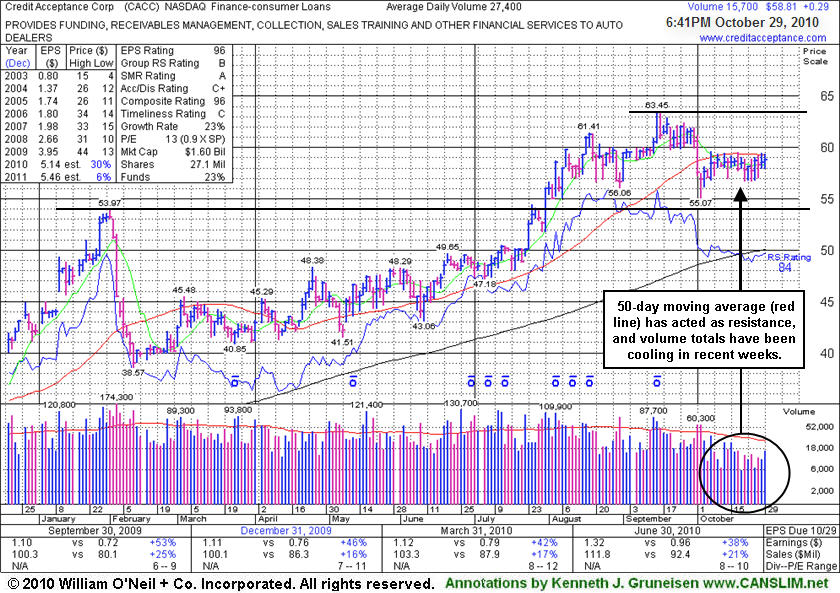
CACC
-
NASDAQ
Credit Acceptance Corp
FINANCIAL SERVICES - Credit Services
|
$58.81
|
+0.29
0.50% |
$59.30
|
15,683
53.89% of 50 DAV
50 DAV is 29,100
|
$63.45
-7.31%
|
7/29/2010
|
$52.04
|
PP = $54.07
|
|
MB = $56.77
|
Most Recent Note - 10/29/2010 6:46:30 PM
G - Hovering -7.3% off its 52-week high and its 50 DMA line has acted as resistance while volume totals have been cooling noticeably in recent weeks. Reports earnings on Monday, November 1, 2010, after the market close. Its $55.07 low (on 10/04/10) defines the nearest chart support level to watch above its long ago chart highs ($53.97).
>>> The latest Featured Stock Update with an annotated graph appeared on 10/29/2010. Click here.
View all notes |
Alert me of new notes |
CANSLIM.net Company Profile |
SEC |
Zacks Reports |
StockTalk |
News |
Chart |
Request a new note
C
A N
S L
I M
|
CMG
-
NYSE
Chipotle Mexican Grill
LEISURE - Restaurants
|
$210.21
|
-0.21
-0.10% |
$211.98
|
380,624
50.82% of 50 DAV
50 DAV is 749,000
|
$215.38
-2.40%
|
9/1/2010
|
$158.31
|
PP = $155.52
|
|
MB = $163.30
|
Most Recent Note - 10/28/2010 3:56:13 PM
G - Holding its ground after big volume driven gains on 10/22/10 and 10/26/10 to new new all-time highs. It is extended from a sound base. Its 50 DMA line defines chart support above its prior highs in the $155 area.
>>> The latest Featured Stock Update with an annotated graph appeared on 10/28/2010. Click here.
View all notes |
Alert me of new notes |
CANSLIM.net Company Profile |
SEC |
Zacks Reports |
StockTalk |
News |
Chart |
Request a new note
C
A N
S L
I M
|
Symbol/Exchange
Company Name
Industry Group |
PRICE |
CHANGE
(%Change) |
Day High |
Volume
(% DAV)
(% 50 day avg vol) |
52 Wk Hi
% From Hi |
Featured
Date |
Price
Featured |
Pivot Featured |
|
Max Buy |
CTRP
-
NASDAQ
Ctrip.Com Intl Ltd Adr
LEISURE - Resorts and Casinos
|
$52.06
|
+1.33
2.62% |
$52.24
|
1,269,161
76.49% of 50 DAV
50 DAV is 1,659,200
|
$52.90
-1.59%
|
9/24/2010
|
$46.75
|
PP = $47.11
|
|
MB = $49.47
|
Most Recent Note - 10/29/2010 4:47:35 PM
G - Gain today with below average volume for a new high close. Prior highs in the $47 area define support to watch above its 50 DMA line.
>>> The latest Featured Stock Update with an annotated graph appeared on 9/28/2010. Click here.
View all notes |
Alert me of new notes |
CANSLIM.net Company Profile |
SEC |
Zacks Reports |
StockTalk |
News |
Chart |
Request a new note
C
A N
S L
I M
|
DECK
-
NASDAQ
Deckers Outdoor Corp
CONSUMER NON-DURABLES - Textile - Apparel Footwear
|
$58.10
|
+4.11
7.61% |
$58.90
|
4,174,631
443.31% of 50 DAV
50 DAV is 941,700
|
$56.12
3.53%
|
10/27/2010
|
$54.16
|
PP = $54.86
|
|
MB = $57.60
|
Most Recent Note - 10/29/2010 1:00:55 PM
G - Gapped up today and already traded 3 times its average daily volume while hitting a new 52-week high. Reported earnings +24% on +22% sales revenues for the quarter ended September 30, 2010 versus the year ago period. The earnings increases was the smallest percentage improvement in the past 5 quarterly comparisons and borderline with the minimum (+25%) increase the investment system calls for. Color code was changed to green after quickly trading above its "max buy" level.
>>> The latest Featured Stock Update with an annotated graph appeared on 10/27/2010. Click here.
View all notes |
Alert me of new notes |
CANSLIM.net Company Profile |
SEC |
Zacks Reports |
StockTalk |
News |
Chart |
Request a new note
C
A N
S L
I M
|
EBIX
-
NASDAQ
Ebix Inc
COMPUTER SOFTWARE and SERVICES - Business Software and Services
|
$24.65
|
-0.91
-3.56% |
$25.89
|
924,077
157.34% of 50 DAV
50 DAV is 587,300
|
$26.36
-6.48%
|
9/23/2010
|
$21.78
|
PP = $22.74
|
|
MB = $23.88
|
Most Recent Note - 10/29/2010 4:13:49 PM
G - Down today with above average volume, ending at the session low and below its old high close ($24.78 on 10/05/10) while completely erasing the prior session's gap up gain. Support to watch is its recent low ($22.12 on 10/26/10) and its 50 DMA line.
>>> The latest Featured Stock Update with an annotated graph appeared on 9/24/2010. Click here.
View all notes |
Alert me of new notes |
CANSLIM.net Company Profile |
SEC |
Zacks Reports |
StockTalk |
News |
Chart |
Request a new note
C
A N
S L
I M
|
FFIV
-
NASDAQ
F 5 Networks Inc
INTERNET - Internet Software and Services
|
$117.70
|
+0.92
0.79% |
$119.88
|
2,208,207
95.77% of 50 DAV
50 DAV is 2,305,700
|
$118.99
-1.08%
|
6/16/2010
|
$74.50
|
PP = $74.10
|
|
MB = $77.81
|
Most Recent Note - 10/27/2010 1:15:40 PM
G - Gapped up today for a considerable gain and a new high while posting its 6th consecutive gain with ever-increasing volume. Reported +58% earnings on +45% sales revenues for the period ended September 30, 2010 versus the year ago period. It may go on to produce more climactic gains, however it did not form a sound new base and may be considered "late stage" after its considerable rally this year.
>>> The latest Featured Stock Update with an annotated graph appeared on 9/13/2010. Click here.
View all notes |
Alert me of new notes |
CANSLIM.net Company Profile |
SEC |
Zacks Reports |
StockTalk |
News |
Chart |
Request a new note
C
A N
S L
I M
|
FOSL
-
NASDAQ
Fossil Inc
CONSUMER DURABLES - Recreational Goods, Other
|
$58.99
|
-0.37
-0.61% |
$59.94
|
560,936
74.55% of 50 DAV
50 DAV is 752,400
|
$59.81
-1.37%
|
10/20/2010
|
$54.12
|
PP = $55.61
|
|
MB = $58.39
|
Most Recent Note - 10/27/2010 5:19:38 PM
G - Color code is changed to green after inching above its "max buy" level with a 6th consecutive gain. Volume conviction has been lacking while wedging to new all-time highs. The nearby chart support level to watch is its 50 DMA line.
>>> The latest Featured Stock Update with an annotated graph appeared on 10/5/2010. Click here.
View all notes |
Alert me of new notes |
CANSLIM.net Company Profile |
SEC |
Zacks Reports |
StockTalk |
News |
Chart |
Request a new note
C
A N
S L
I M
|
Symbol/Exchange
Company Name
Industry Group |
PRICE |
CHANGE
(%Change) |
Day High |
Volume
(% DAV)
(% 50 day avg vol) |
52 Wk Hi
% From Hi |
Featured
Date |
Price
Featured |
Pivot Featured |
|
Max Buy |
HMSY
-
NASDAQ
H M S Holdings Corp
COMPUTER SOFTWARE and SERVICES - Healthcare Information Service
|
$60.11
|
+3.60
6.37% |
$62.47
|
1,086,401
634.21% of 50 DAV
50 DAV is 171,300
|
$62.91
-4.45%
|
9/27/2010
|
$57.97
|
PP = $58.36
|
|
MB = $61.28
|
Most Recent Note - 10/29/2010 1:16:50 PM
Y - Considerable gain today is an encouraging sign of prompt support showing up near its 50 DMA line following its latest earnings report. Color code was changed to yellow based on its impressive resilience after distributional pressure caused technical damage this week.
>>> The latest Featured Stock Update with an annotated graph appeared on 9/27/2010. Click here.
View all notes |
Alert me of new notes |
CANSLIM.net Company Profile |
SEC |
Zacks Reports |
StockTalk |
News |
Chart |
Request a new note
C
A N
S L
I M
|
HS
-
NYSE
Healthspring Inc
HEALTH SERVICES - Health Care Plans
|
$29.19
|
+1.75
6.38% |
$29.80
|
1,529,423
217.96% of 50 DAV
50 DAV is 701,700
|
$28.10
3.90%
|
8/27/2010
|
$19.91
|
PP = $19.75
|
|
MB = $20.74
|
Most Recent Note - 10/29/2010 1:17:30 PM
G - Up today for a new 52-week high following a "positive reversal" on the prior session after earnings news. After dipping near its 50 DMA line, the prompt support near that important short term average has been impressive. Earnings were +23% with sales revenues +10% for the quarter ended September 30, 2010 versus the year ago period, marking its weakest earnings increase in 5 quarterly comparisons with a worrisome deceleration in sales revenues growth.
>>> The latest Featured Stock Update with an annotated graph appeared on 10/22/2010. Click here.
View all notes |
Alert me of new notes |
CANSLIM.net Company Profile |
SEC |
Zacks Reports |
StockTalk |
News |
Chart |
Request a new note
C
A N
S L
I M
|
IGTE
-
NASDAQ
Igate Corp
COMPUTER SOFTWARE and SERVICES - Information Technology Service
|
$20.44
|
-0.15
-0.73% |
$20.58
|
455,935
91.08% of 50 DAV
50 DAV is 500,600
|
$21.10
-3.13%
|
10/26/2010
|
$17.29
|
PP = $19.55
|
|
MB = $20.53
|
Most Recent Note - 10/28/2010 1:15:13 PM
Y - Touched a new 52-week high today and traded above its "max buy" level earlier. Prior chart highs in the $19 area define initial chart support above its 50 DMA line. Its strong finish on 10/26/10, after it was last noted, confirmed a technical buy signal.
>>> The latest Featured Stock Update with an annotated graph appeared on 9/10/2010. Click here.
View all notes |
Alert me of new notes |
CANSLIM.net Company Profile |
SEC |
Zacks Reports |
StockTalk |
News |
Chart |
Request a new note
C
A N
S L
I M
|
JOBS
-
NASDAQ
Fifty One Job Inc Ads
DIVERSIFIED SERVICES - Staffing and; Outsourcing Service
|
$45.08
|
+0.05
0.11% |
$45.55
|
53,153
27.79% of 50 DAV
50 DAV is 191,300
|
$47.48
-5.05%
|
10/13/2010
|
$42.07
|
PP = $40.60
|
|
MB = $42.63
|
Most Recent Note - 10/26/2010 5:24:52 PM
G - Wider intra-day price swings are a sign of uncertainty, meanwhile prior highs in the $40 area define support above its 50 DMA line.
>>> The latest Featured Stock Update with an annotated graph appeared on 9/16/2010. Click here.
View all notes |
Alert me of new notes |
CANSLIM.net Company Profile |
SEC |
Zacks Reports |
StockTalk |
News |
Chart |
Request a new note
C
A N
S L
I M
|
LFT
-
NYSE
Longtop Financl Tech Ads
COMPUTER SOFTWARE and SERVICES - Business Software and Services
|
$36.34
|
-0.75
-2.02% |
$37.22
|
651,824
131.55% of 50 DAV
50 DAV is 495,500
|
$41.77
-13.00%
|
10/14/2010
|
$39.97
|
PP = $41.87
|
|
MB = $43.96
|
Most Recent Note - 10/29/2010 4:20:55 PM
G - Loss today with above average volume raised greater concerns while it slumped further below its 50 DMA line and finished -13% below its 52-week high. Its Relative Strength rank has slumped to 70 while it has struggled in recent weeks. Based on weak action it will be dropped from the Featured Stocks list tonight. Outlook would only turn bullish upon powerful gains above the $40 level which has been a stubborn resistance level.
>>> The latest Featured Stock Update with an annotated graph appeared on 10/14/2010. Click here.
View all notes |
Alert me of new notes |
CANSLIM.net Company Profile |
SEC |
Zacks Reports |
StockTalk |
News |
Chart |
Request a new note
C
A N
S L
I M
|
Symbol/Exchange
Company Name
Industry Group |
PRICE |
CHANGE
(%Change) |
Day High |
Volume
(% DAV)
(% 50 day avg vol) |
52 Wk Hi
% From Hi |
Featured
Date |
Price
Featured |
Pivot Featured |
|
Max Buy |
LULU
-
NASDAQ
Lululemon Athletica
MANUFACTURING - Textile Manufacturing
|
$44.32
|
+0.19
0.43% |
$44.80
|
612,248
50.51% of 50 DAV
50 DAV is 1,212,100
|
$48.45
-8.52%
|
10/8/2010
|
$47.66
|
PP = $46.67
|
|
MB = $49.00
|
Most Recent Note - 10/27/2010 5:17:07 PM
Y - Down today with lighter volume. Its color code was changed to yellow while hovering near old highs in the $45-46 area. Recent lows in the $42 area define support to watch above its 50 DMA line. Subsequent gains to new highs with volume would be welcomed as a confirming sign of serious institutional accumulation.
>>> The latest Featured Stock Update with an annotated graph appeared on 10/8/2010. Click here.
View all notes |
Alert me of new notes |
CANSLIM.net Company Profile |
SEC |
Zacks Reports |
StockTalk |
News |
Chart |
Request a new note
C
A N
S L
I M
|
MRX
-
NYSE
Medicis Pharmaceut Cl A
DRUGS - Biotechnology
|
$29.75
|
-0.25
-0.83% |
$30.19
|
877,200
80.51% of 50 DAV
50 DAV is 1,089,500
|
$30.94
-3.85%
|
8/12/2010
|
$26.88
|
PP = $26.71
|
|
MB = $28.05
|
Most Recent Note - 10/29/2010 5:00:09 PM
G - Volume totals have been cooling while consolidating in a tight trading range just above its 50 DMA line. In recent weeks Medicis Pharmaceutical Corp said Genzyme Corp had sued it in a U.S. court over its wrinkle treatments, accusing patent violation. Medicis acquired exclusive U.S. and Canadian rights to the Restylane family of products through certain license agreements in March 2003. Also it amended its 2009 complaint against India's Lupin Ltd related to a copycat version of Medicis' acne treatment Solodyn, to include a newly issued patent.
>>> The latest Featured Stock Update with an annotated graph appeared on 10/4/2010. Click here.
View all notes |
Alert me of new notes |
CANSLIM.net Company Profile |
SEC |
Zacks Reports |
StockTalk |
News |
Chart |
Request a new note
C
A N
S L
I M
|
MWIV
-
NASDAQ
M W I Veterinary Supply
HEALTH SERVICES - Medical Instruments and; Supplies
|
$57.20
|
-0.48
-0.83% |
$57.69
|
33,927
56.83% of 50 DAV
50 DAV is 59,700
|
$59.50
-3.87%
|
7/29/2010
|
$52.05
|
PP = $52.09
|
|
MB = $54.69
|
Most Recent Note - 10/27/2010 5:14:44 PM
G - Closed at the session high with a gain backed by above average volume today. Due to announce earnings in early-November. Recently found support near its 50 DMA line, but any subsequent violation of that classic chart support level or breach of recent lows would raise greater concerns.
>>> The latest Featured Stock Update with an annotated graph appeared on 9/7/2010. Click here.
View all notes |
Alert me of new notes |
CANSLIM.net Company Profile |
SEC |
Zacks Reports |
StockTalk |
News |
Chart |
Request a new note
C
A N
S L
I M
|
NEM
-
NYSE
Newmont Mining Corp
METALS and MINING - Gold
|
$60.86
|
+1.05
1.76% |
$61.13
|
5,237,368
81.94% of 50 DAV
50 DAV is 6,391,500
|
$65.50
-7.08%
|
8/31/2010
|
$61.32
|
PP = $63.48
|
|
MB = $66.65
|
Most Recent Note - 10/29/2010 5:48:31 PM
G - Gains with light volume helped it rebound to just below its 50 DMA line and close the week -7.1% off its 52-week high.
>>> The latest Featured Stock Update with an annotated graph appeared on 9/14/2010. Click here.
View all notes |
Alert me of new notes |
CANSLIM.net Company Profile |
SEC |
Zacks Reports |
StockTalk |
News |
Chart |
Request a new note
C
A N
S L
I M
|
NEOG
-
NASDAQ
Neogen Corp
DRUGS - Diagnostic Substances
|
$33.42
|
-0.50
-1.47% |
$33.97
|
63,666
61.51% of 50 DAV
50 DAV is 103,500
|
$36.37
-8.11%
|
9/1/2010
|
$30.79
|
PP = $30.49
|
|
MB = $32.01
|
Most Recent Note - 10/29/2010 4:30:24 PM
G - Consolidating above its 10 week moving average in a healthy fashion. It has not tested that important support level since its technical breakout on 9/01/10 from an orderly 5-week base-on-base pattern.
>>> The latest Featured Stock Update with an annotated graph appeared on 10/13/2010. Click here.
View all notes |
Alert me of new notes |
CANSLIM.net Company Profile |
SEC |
Zacks Reports |
StockTalk |
News |
Chart |
Request a new note
C
A N
S L
I M
|
Symbol/Exchange
Company Name
Industry Group |
PRICE |
CHANGE
(%Change) |
Day High |
Volume
(% DAV)
(% 50 day avg vol) |
52 Wk Hi
% From Hi |
Featured
Date |
Price
Featured |
Pivot Featured |
|
Max Buy |
NFLX
-
NASDAQ
Netflix Inc
SPECIALTY RETAIL - Music and Video Stores
|
$173.57
|
-2.13
-1.21% |
$175.80
|
5,924,682
105.78% of 50 DAV
50 DAV is 5,601,100
|
$184.74
-6.05%
|
8/10/2010
|
$124.05
|
PP = $124.00
|
|
MB = $130.20
|
Most Recent Note - 10/29/2010 5:53:42 PM
G - Small loss on higher volume was a sign of distributional pressure today. It could go on to produce more climactic gains. However, while now trading +64% above its 200 DMA line, it may be considered "late stage" and extended from a sound base after a considerable rally this year.
>>> The latest Featured Stock Update with an annotated graph appeared on 10/1/2010. Click here.
View all notes |
Alert me of new notes |
CANSLIM.net Company Profile |
SEC |
Zacks Reports |
StockTalk |
News |
Chart |
Request a new note
C
A N
S L
I M
|
NTAP
-
NASDAQ
Netapp Inc
COMPUTER HARDWARE - Data Storage Devices
|
$53.25
|
+0.44
0.83% |
$53.60
|
3,520,420
43.20% of 50 DAV
50 DAV is 8,149,900
|
$53.66
-0.76%
|
9/8/2010
|
$46.98
|
PP = $44.99
|
|
MB = $47.24
|
Most Recent Note - 10/26/2010 6:06:44 PM
G - Gain today with light volume for a new high close. Its recent lows near $47 define an initial chart support level to watch above its 50 DMA line.
>>> The latest Featured Stock Update with an annotated graph appeared on 9/8/2010. Click here.
View all notes |
Alert me of new notes |
CANSLIM.net Company Profile |
SEC |
Zacks Reports |
StockTalk |
News |
Chart |
Request a new note
C
A N
S L
I M
|
ORCL
-
NASDAQ
Oracle Corp
COMPUTER SOFTWARE and SERVICES - Application Software
|
$29.38
|
+0.02
0.07% |
$29.71
|
35,071,873
89.03% of 50 DAV
50 DAV is 39,393,600
|
$29.48
-0.34%
|
9/20/2010
|
$27.32
|
PP = $26.73
|
|
MB = $28.07
|
Most Recent Note - 10/28/2010 5:51:01 PM
G - Below average volume was behind today's gain for a new 52-week high. Stubbornly holding its ground after getting extended beyond its "max buy" level.
>>> The latest Featured Stock Update with an annotated graph appeared on 9/20/2010. Click here.
View all notes |
Alert me of new notes |
CANSLIM.net Company Profile |
SEC |
Zacks Reports |
StockTalk |
News |
Chart |
Request a new note
C
A N
S L
I M
|
PAY
-
NYSE
Verifone Systems Inc
COMPUTER HARDWARE - Transaction Automation Systems
|
$33.83
|
+0.67
2.02% |
$34.06
|
1,080,923
70.39% of 50 DAV
50 DAV is 1,535,600
|
$33.80
0.09%
|
8/25/2010
|
$24.30
|
PP = $23.74
|
|
MB = $24.93
|
Most Recent Note - 10/29/2010 5:45:43 PM
G - Gain today for another new all-time high, getting more extended from a sound base pattern. Its 50 DMA and recent lows near $27 define chart support.
>>> The latest Featured Stock Update with an annotated graph appeared on 10/25/2010. Click here.
View all notes |
Alert me of new notes |
CANSLIM.net Company Profile |
SEC |
Zacks Reports |
StockTalk |
News |
Chart |
Request a new note
C
A N
S L
I M
|
PRGO
-
NASDAQ
Perrigo Co
DRUGS - Drug Related Products
|
$65.88
|
-0.68
-1.02% |
$66.58
|
371,892
46.42% of 50 DAV
50 DAV is 801,200
|
$67.94
-3.03%
|
9/15/2010
|
$63.73
|
PP = $64.76
|
|
MB = $68.00
|
Most Recent Note - 10/28/2010 3:46:24 PM
Y - Volume totals have been cooling and today it is perched near its best ever close after inching higher for 6 consecutive small gains on very light volume. While its consolidation above its pivot point and below its "max buy" level continues, looking like a healthy base-on-base pattern, its 50 DMA line defines important chart support. Confirming gains to new highs with above average volume would be a reassuring sign it may be capable of a sustained advance.
>>> The latest Featured Stock Update with an annotated graph appeared on 9/15/2010. Click here.
View all notes |
Alert me of new notes |
CANSLIM.net Company Profile |
SEC |
Zacks Reports |
StockTalk |
News |
Chart |
Request a new note
C
A N
S L
I M
|
Symbol/Exchange
Company Name
Industry Group |
PRICE |
CHANGE
(%Change) |
Day High |
Volume
(% DAV)
(% 50 day avg vol) |
52 Wk Hi
% From Hi |
Featured
Date |
Price
Featured |
Pivot Featured |
|
Max Buy |
RAX
-
NYSE
Rackspace Hosting Inc
INTERNET - Internet Software and; Services
|
$24.96
|
+0.04
0.16% |
$25.40
|
1,107,502
45.69% of 50 DAV
50 DAV is 2,423,700
|
$26.50
-5.81%
|
9/21/2010
|
$22.84
|
PP = $23.61
|
|
MB = $24.79
|
Most Recent Note - 10/29/2010 5:04:26 PM
G - Within close striking distance of all-time highs after considerable gains this week. Strength in the Internet - Networking group has been reassuring, especially after a solid earnings report and gap up gain from F5 Networks (FFIV). Reporting earnings on Monday, November 8, 2010, after the close.
>>> The latest Featured Stock Update with an annotated graph appeared on 9/21/2010. Click here.
View all notes |
Alert me of new notes |
CANSLIM.net Company Profile |
SEC |
Zacks Reports |
StockTalk |
News |
Chart |
Request a new note
C
A N
S L
I M
|
ROVI
-
NASDAQ
Rovi Corp
COMPUTER SOFTWARE andamp; SERVICES - Security Software andamp; Services
|
$50.65
|
+0.67
1.34% |
$50.94
|
2,767,896
183.16% of 50 DAV
50 DAV is 1,511,200
|
$53.00
-4.43%
|
10/29/2010
|
$49.99
|
PP = $53.10
|
|
MB = $55.76
|
Most Recent Note - 10/29/2010 10:13:08 AM
Y - Reported earnings +67% on +21% sales revenues for the quarter ended September 30, 2010 versus the year ago period. Its biggest percentage increases in the past 5 quarterly comparisons are an encouraging sign of acceleration. Color code is changed to yellow with a new pivot point cited based on its 52-week high plus ten cents. After its orderly 5-week flat base, a subsequent breakout with volume conviction would trigger a new (or add-on) technical buy signal. Meanwhile, support to watch is defined by its 50 DMA line.
>>> The latest Featured Stock Update with an annotated graph appeared on 10/20/2010. Click here.
View all notes |
Alert me of new notes |
CANSLIM.net Company Profile |
SEC |
Zacks Reports |
StockTalk |
News |
Chart |
Request a new note
C
A N
S L
I M
|
SHOO
-
NASDAQ
Steven Madden Limited
CONSUMER NON-DURABLES - Textile - Apparel Footwear
|
$42.30
|
-0.23
-0.54% |
$43.14
|
328,216
105.54% of 50 DAV
50 DAV is 311,000
|
$44.85
-5.69%
|
9/15/2010
|
$38.94
|
PP = $40.27
|
|
MB = $42.28
|
Most Recent Note - 10/29/2010 4:50:32 PM
G - Hovering above its "max buy" level and enduring mild distributional pressure this week. Support is defined by prior highs and its 50 DMA line in the $50 area.
>>> The latest Featured Stock Update with an annotated graph appeared on 9/29/2010. Click here.
View all notes |
Alert me of new notes |
CANSLIM.net Company Profile |
SEC |
Zacks Reports |
StockTalk |
News |
Chart |
Request a new note
C
A N
S L
I M
|
SLW
-
NYSE
Silver Wheaton Corp
METALS and; MINING - Silver
|
$28.75
|
+1.20
4.36% |
$28.89
|
7,804,616
118.60% of 50 DAV
50 DAV is 6,580,400
|
$28.39
1.27%
|
8/25/2010
|
$21.40
|
PP = $21.99
|
|
MB = $23.09
|
Most Recent Note - 10/29/2010
G - Gain today for a new 52-week high leaves it clear of any resistance due to overhead supply. It is not breaking out of a sound new base, yet it is in better technical shape than most other currently Featured Stocks in the Mining - Gold/Silver/Gems group.
>>> The latest Featured Stock Update with an annotated graph appeared on 10/18/2010. Click here.
View all notes |
Alert me of new notes |
CANSLIM.net Company Profile |
SEC |
Zacks Reports |
StockTalk |
News |
Chart |
Request a new note
C
A N
S L
I M
|
SVR
-
NYSE
Syniverse Holdings Inc
TELECOMMUNICATIONS - Diversified Communication Serv
|
$30.49
|
-0.01
-0.03% |
$30.53
|
7,406,070
1,095.90% of 50 DAV
50 DAV is 675,800
|
$31.25
-2.43%
|
9/22/2010
|
$23.60
|
PP = $23.87
|
|
MB = $25.06
|
Most Recent Note - 10/29/2010 1:43:14 PM
G - Holding its ground after a considerable gain on 10/28/10 after news Carlyle Group will buy Syniverse Technologies for $31 per share. Color code was changed to green after spiking above its "max buy" level.
>>> The latest Featured Stock Update with an annotated graph appeared on 9/22/2010. Click here.
View all notes |
Alert me of new notes |
CANSLIM.net Company Profile |
SEC |
Zacks Reports |
StockTalk |
News |
Chart |
Request a new note
C
A N
S L
I M
|
Symbol/Exchange
Company Name
Industry Group |
PRICE |
CHANGE
(%Change) |
Day High |
Volume
(% DAV)
(% 50 day avg vol) |
52 Wk Hi
% From Hi |
Featured
Date |
Price
Featured |
Pivot Featured |
|
Max Buy |
UA
-
NYSE
Under Armour Inc Cl A
CONSUMER NON-DURABLES - Textile - Apparel Clothing
|
$46.68
|
-0.28
-0.60% |
$47.17
|
440,674
57.30% of 50 DAV
50 DAV is 769,000
|
$48.59
-3.93%
|
9/9/2010
|
$39.99
|
PP = $40.10
|
|
MB = $42.11
|
Most Recent Note - 10/27/2010 2:00:50 PM
G - Gapped down today and held its ground on the prior session following a report of earnings +21% on +22% sales revenues for the quarter ended September 30, 2010 versus the year ago period. It remains near its 52-week high, in healthy shape technically, and may deserve the benefit of the doubt with a favorable backdrop from the M criteria currently favoring 3 out of 4 growth stocks. However, the weaker earnings increase (under the +25% guideline) raises concerns, fundamentally, with respect to the C criteria. Earlier notes acknowledged the downward turn in annual earnings (A criteria) in FY '08, another fundamental concern with respect to the fact-based investment system.
.
>>> The latest Featured Stock Update with an annotated graph appeared on 9/9/2010. Click here.
View all notes |
Alert me of new notes |
CANSLIM.net Company Profile |
SEC |
Zacks Reports |
StockTalk |
News |
Chart |
Request a new note
C
A N
S L
I M
|
UFPT
-
NASDAQ
U F P Tech Inc
CONSUMER NON-DURABLES - Packaging and Containers
|
$11.95
|
-0.07
-0.58% |
$12.02
|
48,684
79.16% of 50 DAV
50 DAV is 61,500
|
$13.32
-10.29%
|
9/16/2010
|
$11.20
|
PP = $11.69
|
|
MB = $12.27
|
Most Recent Note - 10/29/2010 4:46:23 PM
Y - Color code is changed to yellow after its healthy consolidation to its 10 week average. It may be considered buyable up to +5% above its recent high ($13.32 plus 5%) as a secondary buy point following its earlier technical breakout, however a new pivot point is not cited because it did not form a sound new base pattern.
>>> The latest Featured Stock Update with an annotated graph appeared on 9/17/2010. Click here.
View all notes |
Alert me of new notes |
CANSLIM.net Company Profile |
SEC |
Zacks Reports |
StockTalk |
News |
Chart |
Request a new note
C
A N
S L
I M
|
ULTA
-
NASDAQ
Ulta Salon Cosm & Frag
SPECIALTY RETAIL - Specialty Retail, Other
|
$30.69
|
-0.45
-1.45% |
$31.21
|
373,374
56.52% of 50 DAV
50 DAV is 660,600
|
$32.68
-6.09%
|
9/3/2010
|
$26.36
|
PP = $25.89
|
|
MB = $27.18
|
Most Recent Note - 10/27/2010 5:00:46 PM
G - No overhead supply remains to act as resistance, but it is extended from a sound base pattern. Its 50 DMA line defines support to watch above prior chart highs in the $26 area..
>>> The latest Featured Stock Update with an annotated graph appeared on 9/3/2010. Click here.
View all notes |
Alert me of new notes |
CANSLIM.net Company Profile |
SEC |
Zacks Reports |
StockTalk |
News |
Chart |
Request a new note
C
A N
S L
I M
|
VIT
-
NYSE
Vanceinfo Tech Inc Ads
COMPUTER SOFTWARE and SERVICES - Business Software and Services
|
$36.37
|
-0.23
-0.63% |
$37.10
|
436,490
65.12% of 50 DAV
50 DAV is 670,300
|
$37.05
-1.84%
|
7/8/2010
|
$25.20
|
PP = $26.58
|
|
MB = $27.91
|
Most Recent Note - 10/26/2010 6:05:23 PM
G - Hit another new all-time high today with volume slightly above average. It has not formed a recent sound base pattern but patient investors may watch for it to eventually offer an ideal add-on buy point. Meanwhile, its 50 DMA line and recent low ($30.55 on 10/08/10) define important chart support to watch.
>>> The latest Featured Stock Update with an annotated graph appeared on 10/21/2010. Click here.
View all notes |
Alert me of new notes |
CANSLIM.net Company Profile |
SEC |
Zacks Reports |
StockTalk |
News |
Chart |
Request a new note
C
A N
S L
I M
|
WCRX
-
NASDAQ
Warner Chilcott Plc
DRUGS - Drug Manufacturers - Other
|
$23.98
|
-0.42
-1.72% |
$24.32
|
3,497,032
122.55% of 50 DAV
50 DAV is 2,853,500
|
$25.32
-5.29%
|
8/23/2010
|
$21.04
|
PP = $20.84
|
|
MB = $21.88
|
Most Recent Note - 10/29/2010 5:50:28 PM
G - Small loss on above average volume today, a sign of distributional pressure. Holding its ground stubbornly since its "negative reversal" on 10/22/10 was noted. Prior chart highs near $23.50 define near-term support above its 50 DMA line. Its currently low P/E Ratio of 8 (only 60% X S&P 500) might attract the interest of "value" players, but the low P/E and Street estimates calling for only +3% earnings growth in FY '11 raise concerns with respect to its future earnings outlook.
>>> The latest Featured Stock Update with an annotated graph appeared on 10/15/2010. Click here.
View all notes |
Alert me of new notes |
CANSLIM.net Company Profile |
SEC |
Zacks Reports |
StockTalk |
News |
Chart |
Request a new note
C
A N
S L
I M
|
Symbol/Exchange
Company Name
Industry Group |
PRICE |
CHANGE
(%Change) |
Day High |
Volume
(% DAV)
(% 50 day avg vol) |
52 Wk Hi
% From Hi |
Featured
Date |
Price
Featured |
Pivot Featured |
|
Max Buy |