You are not logged in.
This means you
CAN ONLY VIEW reports that were published prior to Monday, April 14, 2025.
You
MUST UPGRADE YOUR MEMBERSHIP if you want to see any current reports.
AFTER MARKET UPDATE - THURSDAY, OCTOBER 29TH, 2009
Previous After Market Report Next After Market Report >>>
|
|
|
|
DOW |
+199.89 |
9,962.58 |
+2.05% |
|
Volume |
1,454,912,010 |
-13% |
|
Volume |
2,375,712,420 |
-15% |
|
NASDAQ |
+37.94 |
2,097.55 |
+1.84% |
|
Advancers |
2,500 |
80% |
|
Advancers |
1,921 |
68% |
|
S&P 500 |
+23.48 |
1,066.11 |
+2.25% |
|
Decliners |
548 |
18% |
|
Decliners |
809 |
29% |
|
Russell 2000 |
+13.86 |
580.22 |
+2.45% |
|
52 Wk Highs |
30 |
|
|
52 Wk Highs |
12 |
|
|
S&P 600 |
+6.33 |
307.90 |
+2.10% |
|
52 Wk Lows |
9 |
|
|
52 Wk Lows |
27 |
|
|
 |
Major Averages' Bounce Came With Lighter Volume Conviction
Adam Sarhan, Contributing Writer,
The major averages bounced back and snapped a four day losing streak which had briefly sent most of the popular averages below their respective 50-day moving average (DMA) lines. Volume was reported lower on the NYSE and Nasdaq exchange, indicating large institutional investors were not aggressively buying stocks while the indices posted gains. Advancers trumped decliners by over a 4-to-1 ratio on the NYSE and by over a 2-to-1 ratio on the Nasdaq exchange. There was only 1 high-ranked company from the CANSLIM.net Leaders List making a new 52-week high and appearing on the CANSLIM.net BreakOuts Page, higher than the 0 issues that appeared on the prior session. In terms of new leadership, the action was hardly anything to get excited over. New 52-week highs still outnumbered new 52-week lows on the NYSE, however new lows outnumbered new highs on Nasdaq exchange for a second consecutive day.
It was very encouraging to see the major averages quickly bounce back and defend their 50 DMA lines. However, volume, a critical component of institutional sponsorship, was lighter than Wednesday's heavy levels which was not ideal. This was the market's largest single-day advance since July and signaled Day 1 of a new rally attempt. This means that the earliest a possible follow-through day could emerge would be Tuesday, November 3, 2009 assuming the day's lows are not breached. That said, the market is still in a correction which means defense is the better part of valor.
The US dollar gapped down, which paved the way for the bulls to step in and clean up. A slew of large cap stocks and other recently beaten down names soared after the government reported GDP rose +3.5% last quarter which topped the Street's estimates. The median estimate was for a +3.2% rally according to the latest Bloomberg survey. The stronger than expected GDP reading helped allay concerns that the eight-month rally in equities was overdone and outpaced the prospects for a sustained economic recovery.
PICTURED: The S&P 500 Index bounced off support (50 DMA line and 8-month upward trendline) however volume was lighter than prior session.
|
|
|
 |
Defensive & Financial Indexes Among Strong Groups Rebounding
Kenneth J. Gruneisen - Passed the CAN SLIM® Master's Exam
Defensive groups were some of Thursday's best gainers as the Gold & Silver Index ($XAU +4.60%) and Healthcare Index ($HMO +4.29%) each rose more than +4%. Energy-related shares traded up as the Oil Services Index ($OSX +3.03%) and Integrated Oil Index ($XOI +2.29%) were on the rise. Financial shares also made an important rebound as the Bank Index ($BKX +4.10%) and Broker/Dealer Index ($XBD +3.16%) fought back for solid gains. The Retail Index ($RLX +2.48%) helped underpin the major averages, and tech sector ended unanimously higher as the Biotechnology Index ($BTK +1.38%), Semiconductor Index ($SOX +2.15%), Internet Index ($IIX +2.41%), and Networking Index ($NWX +2.64%) posted unanimous gains.
Charts courtesy www.stockcharts.com

PICTURED: The Internet Index ($IIX +2.41%) rallied after its latest test of support at its 50-day moving average (DMA) line.
| Oil Services |
$OSX |
195.86 |
+5.76 |
+3.03% |
+61.35% |
| Healthcare |
$HMO |
1,175.46 |
+48.40 |
+4.29% |
+22.42% |
| Integrated Oil |
$XOI |
1,089.56 |
+24.43 |
+2.29% |
+11.22% |
| Semiconductor |
$SOX |
307.26 |
+6.48 |
+2.15% |
+44.82% |
| Networking |
$NWX |
227.47 |
+5.84 |
+2.64% |
+58.09% |
| Internet |
$IIX |
218.63 |
+5.15 |
+2.41% |
+63.44% |
| Broker/Dealer |
$XBD |
115.66 |
+3.54 |
+3.16% |
+49.30% |
| Retail |
$RLX |
391.06 |
+9.47 |
+2.48% |
+40.03% |
| Gold & Silver |
$XAU |
162.04 |
+7.12 |
+4.60% |
+30.84% |
| Bank |
$BKX |
44.43 |
+1.75 |
+4.10% |
+0.25% |
| Biotech |
$BTK |
838.64 |
+11.41 |
+1.38% |
+29.59% |
|
|
|
 |
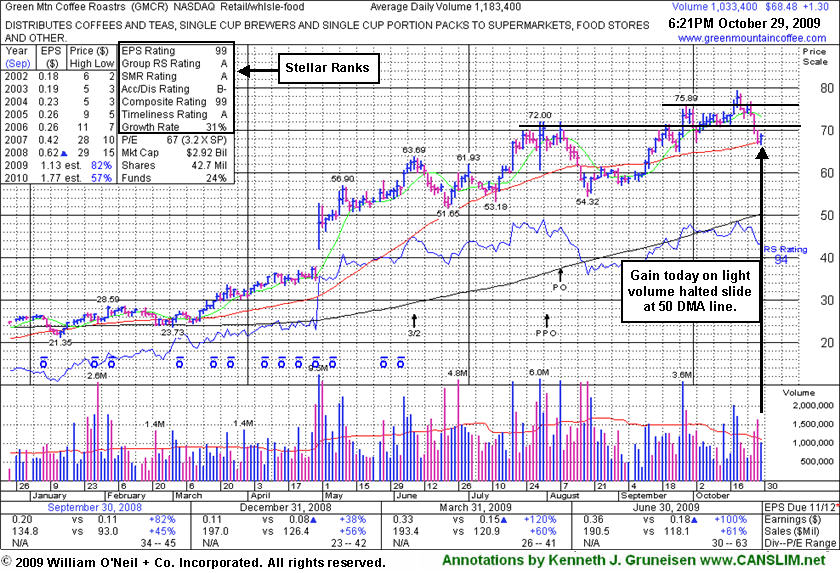
Light Volume Gain Halts Slide After Latest Breakout Failed
Kenneth J. Gruneisen - Passed the CAN SLIM® Master's Exam
Green Mountain Coffee Roasters (GMCR +$1.30 or +1.90% to $68.48) halted its slide right at its 50-day moving average line with today's gain on lighter volume following two damaging losses on higher volume. It has negated its recent breakout from a cup-with-high-handle pattern and slumped below its July highs. Disciplined investors always limit losses at any time a stock falls more than 7-8% from their buy price. If any add-on purchases were made after GMCR's later stage breakouts, those positions might need to be sold, meanwhile, shares of the stock bought at earlier levels might still be justifiable to hold. Any deterioration under recent chart lows would raise concerns, and subsequent losses under its 50 DMA line would trigger technical sell signals as more worrisome signs of weakness.
Do not be confused by the 3-for-2 split that occurred in the interim, as GMCR has traded up as much as +204% since appearing with an annotated graph under the headline "It May Soon Be Time To Go Green" when featured in the January 2009 CANSLIM.net News (read here).
|
|
|
Color Codes Explained :
Y - Better candidates highlighted by our
staff of experts.
G - Previously featured
in past reports as yellow but may no longer be buyable under the
guidelines.
***Last / Change / Volume quote data in this table corresponds with the timestamp on the note***
Symbol/Exchange
Company Name
Industry Group |
Last |
Chg. |
Vol
% DAV |
Date Featured |
Price Featured |
Latest Pivot Point
Featured |
Status |
| Latest Max Buy Price |
ARO
- NYSE
Aeropostale Inc
RETAIL - Apparel Stores
|
$38.96
|
+0.72
|
4,226,807
162% DAV
2,609,200
|
8/21/2009
(Date
Featured) |
$39.21
(Price
Featured) |
PP = $44.95 |
G |
| MB = $47.20 |
Most Recent Note - 10/29/2009 9:51:54 PM
G - Halted its slide with today's small gain on very heavy volume after 4 consecutive losses. Weak action indicative of heavy distributional pressure recently led to noted violations of its 50 DMA line and prior chart lows triggering technical sell signals. Any lower close could put it squarely back in its prior base, essentially negating its 8/21/09 technical breakout.
>>> The latest Featured Stock Update with an annotated graph appeared on 10/22/2009. click here.
|
|
C
A
S
I |
News |
Chart |
SEC
View all notes Alert
me of new notes
Company
Profile
|
ARST
-
|
$25.21
|
+1.01
|
548,890
82% DAV
670,900
|
9/1/2009
(Date
Featured) |
$19.91
(Price
Featured) |
PP = $20.90 |
G |
| MB = $21.95 |
Most Recent Note - 10/29/2009 9:55:40 PM
G - Gain today on lighter volume for its second highest close ever. It had been previously noted as "extended from its 9/04/09 'late stage' breakout." ARST was first featured in yellow at $19.91 in the 9/01/09 mid-day report with an annotated daily graph (read here).
>>> The latest Featured Stock Update with an annotated graph appeared on 10/21/2009. click here.
|
|
C
A
S
I |
News |
Chart |
SEC
View all notes Alert
me of new notes
Company
Profile
|
ASIA
-
|
$23.29
|
+3.43
|
3,251,986
404% DAV
805,700
|
10/14/2009
(Date
Featured) |
$23.05
(Price
Featured) |
PP = $22.19 |
Y |
| MB = $23.30 |
Most Recent Note - 10/29/2009 10:09:00 PM
Y - Gapped up today, rallying back above its pivot point for its third highest close ever after reporting solid earnings for the period ended Sept 30, 2009 that beat expectations as it also raised guidance. It found prompt support near its 50 DMA line (a textbook chart support level) after a 7 session losing streak with losses on high volume briefly negated its latest breakout. Color code is changed to yellow based on impressive fundamentals and technical strength. Featured 10/14/09 in the mid-day report (read here) as it gapped up for a new 52-week high with 5 times average volume, triggering a technical buy signal by blasting above its pivot point. First featured in the August 2009 CANSLIM.net News (read here).
>>> The latest Featured Stock Update with an annotated graph appeared on 10/14/2009. click here.
|
|
C
A
S
I |
News |
Chart |
SEC
View all notes Alert
me of new notes
Company
Profile
|
BIDU
- NASDAQ
Baidu Inc Ads
INTERNET - Internet Information Providers
|
$393.40
|
-3.43
|
2,499,145
129% DAV
1,932,400
|
9/8/2009
(Date
Featured) |
$351.80
(Price
Featured) |
PP = $368.59 |
G |
| MB = $387.02 |
Most Recent Note - 10/29/2009 10:05:57 PM
G - Loss today on average volume after bucking the market's widespread weakness on the prior session, posting a gain while rallying up from its 50 DMA line where it has found impressive and prompt support. Volume spiked to 5 times normal on 10/27/09 as it gapped down for a considerable loss following its latest earnings report, yet it rallied back from extreme lows below its 50 DMA line and closed just above it near the session high. As recently noted, "Choppy action has not allowed it to form a sound base in recent weeks." BIDU traded up as much as +23% from its price when featured in yellow in the 9/08/09 Mid-Day BreakOuts Report (read here).
>>> The latest Featured Stock Update with an annotated graph appeared on 10/28/2009. click here.
|
|
C
A
S
I |
News |
Chart |
SEC
View all notes Alert
me of new notes
Company
Profile
|
CACC
- NASDAQ
Credit Acceptance Corp
FINANCIAL SERVICES - Credit Services
|
$34.96
|
+0.22
|
26,605
70% DAV
38,200
|
9/29/2009
(Date
Featured) |
$33.48
(Price
Featured) |
PP = $32.60 |
G |
| MB = $34.23 |
Most Recent Note - 10/29/2009 10:10:00 PM
G - Held its ground admirably this week and posted a small gain today on light volume. It is still a little bit extended from prior chart highs and its 50 DMA line which now coincide in the $32 area, an important level to watch on pullbacks. The Finance - Consumer/Commercial Loans firm has maintained a great track record of annual and quarterly sales revenues and earnings increases. It was featured on 9/29/09 in yellow in the mid-day report (read here).
>>> The latest Featured Stock Update with an annotated graph appeared on 10/15/2009. click here.
|
|
C
A
S
I |
News |
Chart |
SEC
View all notes Alert
me of new notes
Company
Profile
|
CRM
- NYSE
Salesforce.com Inc
INTERNET - Internet Software & Services
|
$59.66
|
+1.74
|
1,329,743
66% DAV
2,012,800
|
8/16/2009
(Date
Featured) |
$47.12
(Price
Featured) |
PP = $45.59 |
G |
| MB = $47.87 |
Most Recent Note - 10/29/2009 10:11:07 PM
G - Small gain today on lighter than average halted its slide above its 50 DMA line as support arrived to prop it back above prior chart highs in the $59 area after briefly violating an upward trendline connecting its July, August and October chart lows.
>>> The latest Featured Stock Update with an annotated graph appeared on 10/27/2009. click here.
|
|
C
A
S
I |
News |
Chart |
SEC
View all notes Alert
me of new notes
Company
Profile
|
EBIX
- NASDAQ
Ebix Inc
COMPUTER SOFTWARE & SERVICES - Business Software & Services
|
$63.86
|
+4.94
|
314,140
140% DAV
223,700
|
8/28/2009
(Date
Featured) |
$45.86
(Price
Featured) |
PP = $45.35 |
G |
| MB = $47.62 |
Most Recent Note - 10/29/2009 10:13:10 PM
G - Considerable gain today on above average but lighter volume helped it rebound toward recent chart highs. Its negative reversal from all-time highs on 10/26/09 has been followed by more worrisome distributional pressure.
>>> The latest Featured Stock Update with an annotated graph appeared on 10/13/2009. click here.
|
|
C
A
S
I |
News |
Chart |
SEC
View all notes Alert
me of new notes
Company
Profile
|
GMCR
- NASDAQ
Green Mtn Coffee Roastrs
FOOD & BEVERAGE - Processed & Packaged Goods
|
$68.48
|
+1.30
|
1,033,774
85% DAV
1,213,500
|
10/5/2009
(Date
Featured) |
$71.11
(Price
Featured) |
PP = $75.89 |
G |
| MB = $79.68 |
Most Recent Note - 10/29/2009 10:15:11 PM
G - Small gain on lighter volume helped it bounce near its 50 DMA line ($67.34) which was previously noted as an important support level to watch.
>>> The latest Featured Stock Update with an annotated graph appeared on 10/29/2009. click here.
|
|
C
A
S
I |
News |
Chart |
SEC
View all notes Alert
me of new notes
Company
Profile
|
PEGA
- NASDAQ
Pegasystems Inc
COMPUTER SOFTWARE & SERVICES - Business Software & Services
|
$29.30
|
+0.95
|
483,417
152% DAV
318,600
|
9/9/2009
(Date
Featured) |
$31.14
(Price
Featured) |
PP = $33.35 |
G |
| MB = $35.02 |
Most Recent Note - 10/29/2009 10:16:29 PM
G - Gain today with lighter but still above average volume halted its steep slide. Violations of its 50 DMA line and upward trendline were previously noted as technical sell signals. Disciplined investors always limit losses when a stock falls more than 7% from their buy price. Its June highs, which were once resistance in the $27-28 area, are now being put to the test as a chart support level.
>>> The latest Featured Stock Update with an annotated graph appeared on 10/23/2009. click here.
|
|
C
A
S
I |
News |
Chart |
SEC
View all notes Alert
me of new notes
Company
Profile
|
|
|
|
THESE ARE NOT BUY RECOMMENDATIONS!
Comments contained in the body of this report are technical
opinions only. The material herein has been obtained
from sources believed to be reliable and accurate, however,
its accuracy and completeness cannot be guaranteed.
This site is not an investment advisor, hence it does
not endorse or recommend any securities or other investments.
Any recommendation contained in this report may not
be suitable for all investors and it is not to be deemed
an offer or solicitation on our part with respect to
the purchase or sale of any securities. All trademarks,
service marks and trade names appearing in this report
are the property of their respective owners, and are
likewise used for identification purposes only.
This report is a service available
only to active Paid Premium Members.
You may opt-out of receiving report notifications
at any time. Questions or comments may be submitted
by writing to Premium Membership Services 665 S.E. 10 Street, Suite 201 Deerfield Beach, FL 33441-5634 or by calling 1-800-965-8307
or 954-785-1121.
|
|
|


