You are not logged in.
This means you
CAN ONLY VIEW reports that were published prior to Monday, April 14, 2025.
You
MUST UPGRADE YOUR MEMBERSHIP if you want to see any current reports.
AFTER MARKET UPDATE - WEDNESDAY, OCTOBER 28TH, 2009
Previous After Market Report Next After Market Report >>>
|
|
|
|
DOW |
-119.48 |
9,762.69 |
-1.21% |
|
Volume |
1,678,481,810 |
+20% |
|
Volume |
2,807,672,520 |
+16% |
|
NASDAQ |
-56.48 |
2,059.61 |
-2.67% |
|
Advancers |
322 |
10% |
|
Advancers |
425 |
15% |
|
S&P 500 |
-20.78 |
1,042.63 |
-1.95% |
|
Decliners |
2,776 |
88% |
|
Decliners |
2,322 |
82% |
|
Russell 2000 |
-20.63 |
566.36 |
-3.51% |
|
52 Wk Highs |
28 |
|
|
52 Wk Highs |
10 |
|
|
S&P 600 |
-9.50 |
301.57 |
-3.05% |
|
52 Wk Lows |
16 |
|
|
52 Wk Lows |
36 |
|
|
 |
More Damaging Losses Effectively Bring End To Market's Strong 2009 Rally
Adam Sarhan, Contributing Writer,
All the major averages except for the Dow Jones Industrial Average sliced and closed below their respective 50-day moving average (DMA) lines which effectively ended the 34-week rally which began with confirmation on the March 12, 2009 follow-through day. Volume was reported higher on the NYSE and Nasdaq exchange,indicating large institutional selling. Decliners trumped advancers by over a 8-to-1 ratio on the NYSE and by over a 5-to-1 ratio on the Nasdaq exchange which illustrates how weak this market actually is. There were 0 high-ranked companies from the CANSLIM.net Leaders List making a new 52-week high and appearing on the CANSLIM.net BreakOuts Page, which marked the first time since May 15th that no Leaders List stocks reached new 52-week highs. New 52-week highs still outnumbered new 52-week lows on the NYSE, however new lows outnumbered new highs on Nasdaq exchange for the first time since August 17th.
Stocks plunged around the world as the US market officially slid into a correction, ending its robust 34-week long rally. This was one of the strongest sprints in the market's history! The small-cap Russell 2000 Index led the way higher and surged nearly +83% since its March lows! The tech-heavy Nasdaq Composite surged a very impressive +73% before hitting a near term top of 2190.54 on October 21, 2009. The S&P 500 Index jumped +65% during the past eight months while the Dow Jones Industrial Average rallied +56% during that period. Now that this robust rally is over one would be very wise to raise cash and return to a very defensive stance. The fact that all of the major averages except the Dow Jones Industrial Average have sliced below support suggests that the bears have gained the upper hand. A strong defense may be your best offense.
No one knows for sure how low this correction will take the market, so instead of guessing we shall simply continue to react intelligently to what we see happening. This simple, yet effective, strategy has served investors well through previous bearish periods. Better times will come, and trying to "force a trade" is rarely a good idea. Instead, be patient and let the market come to you.
In other news, the US dollar continued its week long advance which dragged a slew of stocks and commodities lower. On the economic front, the Commerce Department said new home sales slid -3.6% last month which sent a slew of housing stocks lower. So far, housing stocks have failed to make any sort of progress as they continue to make their way through one of the worst housing busts (i.e. housing depressions) since World War II. Norway's central bank was the first European central bank to raise interest rates since the credit crisis began in late 2007. Norway is the world's fifth-largest oil exporter and decided to raise rates a quarter point from a record low as it signaled that more increases may follow as the global economy continues to improve. This sparked fears that other central banks will follow suit as they prepare to remove their massive coordinated stimulus packages that topped $12 trillion, according to the International Monetary Fund.
PICTURED: The S&P 500 Index closed below its 50 DMA line and 8-month upward trendline, which signals the 34-week rally is over and the market is back in a correction.
|
|
|
 |
Bank Index Violating Prior Lows May Be An Ominous Sign
Kenneth J. Gruneisen - Passed the CAN SLIM® Master's Exam
The Gold & Silver Index ($XAU -5.09%) was smacked with a large loss, serving as a poor "safe haven" in a broadly declining market environment. The Oil Services Index ($OSX -4.28%) outpaced the Integrated Oil Index ($XOI -2.69%) to the downside while energy-related shares suffered as badly as any other group. The tech sector weakness put greater weight on the tech-heavy Nasdaq Composite Index as the Biotechnology Index ($BTK -3.97%), Semiconductor Index ($SOX -2.80%), Internet Index ($IIX -2.27%), and Networking Index ($NWX -1.25%) unanimously declined. The Healthcare Index ($HMO -2.35%) fell ill along with all other industry groups.
Longtime readers of this commentary should surely recognize the importance that is placed on following the action in the financial group of stocks. The Broker/Dealer Index ($XBD -2.77%) fell for its 8th time in the past 10 trading sessions.
Charts courtesy www.stockcharts.com

PICTURED: The Bank Index ($BKX -3.29%) fell for the 9th time in 10 trading sessions, closing -13.39% off its $49.28 high. It sent an ominous message by its technical violation of recent chart lows. That breach added emphasis to the rapidly deteriorating market environment (M criteria), since the financial group is such a reliable leading indicator.
| Oil Services |
$OSX |
190.10 |
-8.51 |
-4.28% |
+56.60% |
| Healthcare |
$HMO |
1,127.06 |
-27.17 |
-2.35% |
+17.38% |
| Integrated Oil |
$XOI |
1,065.13 |
-29.48 |
-2.69% |
+8.72% |
| Semiconductor |
$SOX |
300.78 |
-8.66 |
-2.80% |
+41.76% |
| Networking |
$NWX |
221.63 |
-2.80 |
-1.25% |
+54.03% |
| Internet |
$IIX |
213.48 |
-4.95 |
-2.27% |
+59.59% |
| Broker/Dealer |
$XBD |
112.12 |
-3.19 |
-2.77% |
+44.73% |
| Retail |
$RLX |
381.59 |
-8.60 |
-2.20% |
+36.64% |
| Gold & Silver |
$XAU |
154.92 |
-8.31 |
-5.09% |
+25.09% |
| Bank |
$BKX |
42.68 |
-1.45 |
-3.29% |
-3.70% |
| Biotech |
$BTK |
827.23 |
-34.17 |
-3.97% |
+27.82% |
|
|
|
 |
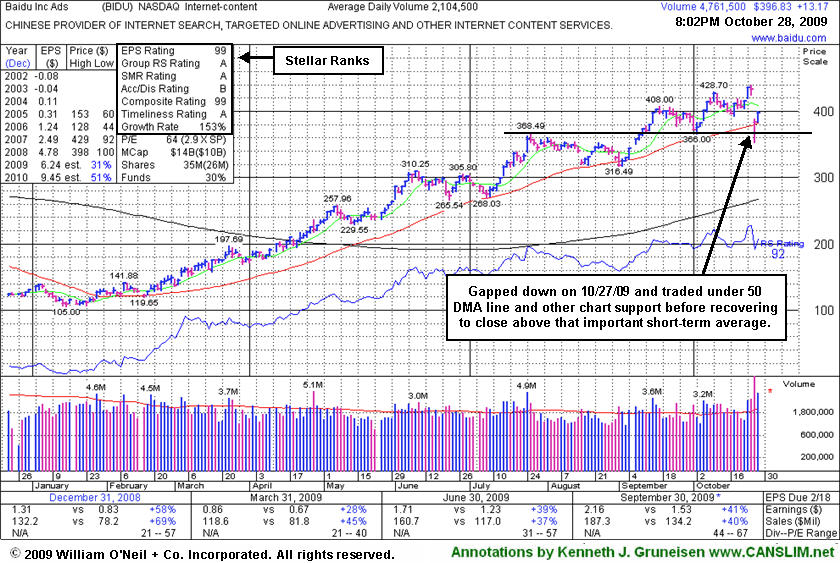
Chinese Internet Content Firm Gapped Down To Classic Chart Support Level
Kenneth J. Gruneisen - Passed the CAN SLIM® Master's Exam
Baidu.com, Inc. (BIDU +$13.17 or +3.21% to $396.83) bucked the market's widespread weakness today, posting a gain while rallying up from its 50-day moving average (DMA) line where it has found impressive and prompt support. Volume spiked to 5 times normal on 10/27/09 as it gapped down for a considerable loss following its latest earnings report, yet it rallied back from extreme lows below its 50 DMA line and other chart support to close just above its important short term average near the session high. However, whenever a stock which has made a many-fold run up in price flashes its largest point loss on the highest volume down day in more than 10 months, such clearly negative action may be considered a technical sell signal.
As recently noted, "Choppy action has not allowed it to form a sound base in recent weeks." BIDU traded up as much as +23% from its price when featured in yellow in the 9/08/09 Mid-Day BreakOuts Report (read here). Broader market (M criteria) weakness and distributional pressure now weighing on many leading issues is an increasing concern, since 3 out of 4 stocks tend to follow the general direction of the broader market averages. Such is the case, even while the number of top-rated funds owning BIDU's shares rose from 112 in Sept '08 to 159 in Jun '09, clear evidence its shares were being accumulated. An earlier FSU appearance described some of the more extensive prior coverage this Chinese Internet search provider has received (read here).
|
|
|
Color Codes Explained :
Y - Better candidates highlighted by our
staff of experts.
G - Previously featured
in past reports as yellow but may no longer be buyable under the
guidelines.
***Last / Change / Volume quote data in this table corresponds with the timestamp on the note***
Symbol/Exchange
Company Name
Industry Group |
Last |
Chg. |
Vol
% DAV |
Date Featured |
Price Featured |
Latest Pivot Point
Featured |
Status |
| Latest Max Buy Price |
ARO
- NYSE
Aeropostale Inc
RETAIL - Apparel Stores
|
$38.24
|
-2.05
|
3,388,467
130% DAV
2,609,200
|
8/21/2009
(Date
Featured) |
$39.21
(Price
Featured) |
PP = $44.95 |
G |
| MB = $47.20 |
Most Recent Note - 10/28/2009 6:24:58 PM
G - Today's considerable loss on higher volume was its 4th consecutive loss. The weak action is clearly indicative of heavy distributional pressure and, as noted previously, "violations of its 50 DMA line and recent chart lows triggered technical sell signals." It ended at the session low, closing just 2 cents above its July 20th close. A lower close would put it squarely back in its prior base, essentially negating its 8/21/09 technical breakout.
>>> The latest Featured Stock Update with an annotated graph appeared on 10/22/2009. click here.
|
|
C
A
S
I |
News |
Chart |
SEC
View all notes Alert
me of new notes
Company
Profile
|
ARST
-
|
$24.20
|
-0.56
|
1,024,535
153% DAV
670,900
|
9/1/2009
(Date
Featured) |
$19.91
(Price
Featured) |
PP = $20.90 |
G |
| MB = $21.95 |
Most Recent Note - 10/28/2009 6:28:30 PM
G - Gapped down today for a loss with above average volume, raising concerns, yet it rallied back encouragingly to close the widely negative trading session at the high end of its intra-day range. It had been previously noted as "extended from its 9/04/09 'late stage' breakout." ARST was first featured in yellow at $19.91 in the 9/01/09 mid-day report with an annotated daily graph (read here).
>>> The latest Featured Stock Update with an annotated graph appeared on 10/21/2009. click here.
|
|
C
A
S
I |
News |
Chart |
SEC
View all notes Alert
me of new notes
Company
Profile
|
ASIA
-
|
$19.86
|
-1.34
|
1,553,070
193% DAV
805,700
|
10/14/2009
(Date
Featured) |
$23.05
(Price
Featured) |
PP = $22.19 |
G |
| MB = $23.30 |
Most Recent Note - 10/28/2009 6:34:02 PM
G - Having negated its latest breakout with a wave of distributional pressure, it fell to important technical support at its 50 DMA line ($19.69). It was down considerably today for a 7th consecutive loss, then reported solid earnings after the close that beat expectations and the company raised guidance looking forward. It was highlighted in yellow in the 10/14/09 mid-day report (read here) as it gapped up for a new 52-week high with 5 times average volume, triggering a technical buy signal by blasting above its pivot point. First featured in the August 2009 CANSLIM.net News (read here).
>>> The latest Featured Stock Update with an annotated graph appeared on 10/14/2009. click here.
|
|
C
A
S
I |
News |
Chart |
SEC
View all notes Alert
me of new notes
Company
Profile
|
BIDU
- NASDAQ
Baidu Inc Ads
INTERNET - Internet Information Providers
|
$396.83
|
+13.17
|
4,778,678
247% DAV
1,932,400
|
9/8/2009
(Date
Featured) |
$351.80
(Price
Featured) |
PP = $368.59 |
G |
| MB = $387.02 |
Most Recent Note - 10/28/2009 6:48:41 PM
G - Bucked the market's widespread weakness today, posting a gain while rallying up from its 50 DMA line where it has found impressive and prompt support. Volume spiked to 5 times normal on 10/27/09 as it gapped down for a considerable loss following its latest earnings report, yet it rallied back from extreme lows below its 50 DMA line and closed just above it near the session high. As recently noted, "Choppy action has not allowed it to form a sound base in recent weeks." BIDU traded up as much as +23% from its price when featured in yellow in the 9/08/09 Mid-Day BreakOuts Report (read here).
>>> The latest Featured Stock Update with an annotated graph appeared on 10/28/2009. click here.
|
|
C
A
S
I |
News |
Chart |
SEC
View all notes Alert
me of new notes
Company
Profile
|
CACC
- NASDAQ
Credit Acceptance Corp
FINANCIAL SERVICES - Credit Services
|
$34.74
|
-0.26
|
39,345
103% DAV
38,200
|
9/29/2009
(Date
Featured) |
$33.48
(Price
Featured) |
PP = $32.60 |
G |
| MB = $34.23 |
Most Recent Note - 10/28/2009 6:52:12 PM
G - Pulled back from all-time highs for a 3rd consecutive losing session. It is still extended from prior chart highs and its 50 DMA line which now coincide in the $32 area, an important level to watch on pullbacks. The Finance - Consumer/Commercial Loans firm has maintained a great track record of annual and quarterly sales revenues and earnings increases. It was featured on 9/29/09 in yellow in the mid-day report (read here).
>>> The latest Featured Stock Update with an annotated graph appeared on 10/15/2009. click here.
|
|
C
A
S
I |
News |
Chart |
SEC
View all notes Alert
me of new notes
Company
Profile
|
CRM
- NYSE
Salesforce.com Inc
INTERNET - Internet Software & Services
|
$57.92
|
-1.44
|
1,618,302
80% DAV
2,012,800
|
8/16/2009
(Date
Featured) |
$47.12
(Price
Featured) |
PP = $45.59 |
G |
| MB = $47.87 |
Most Recent Note - 10/28/2009 6:56:09 PM
G - Loss today on near average but lighter volume raised concern while sinking below prior chart highs in the $59 area and also violating an upward trendline connecting its July, August and October chart lows. The action could be considered "early" technical sell signals. Meanwhile, the next important support level to watch is its nearby 50 DMA line (now $56.84).
>>> The latest Featured Stock Update with an annotated graph appeared on 10/27/2009. click here.
|
|
C
A
S
I |
News |
Chart |
SEC
View all notes Alert
me of new notes
Company
Profile
|
EBIX
- NASDAQ
Ebix Inc
COMPUTER SOFTWARE & SERVICES - Business Software & Services
|
$58.92
|
-3.58
|
523,420
234% DAV
223,700
|
8/28/2009
(Date
Featured) |
$45.86
(Price
Featured) |
PP = $45.35 |
G |
| MB = $47.62 |
Most Recent Note - 10/28/2009 6:57:32 PM
G - Closed near its session low after a gap down today for another considerable loss on higher volume which may be considered a technical sell signal. Its negative reversal from all-time highs on 10/26/09 has been followed by more worrisome distributional pressure.
>>> The latest Featured Stock Update with an annotated graph appeared on 10/13/2009. click here.
|
|
C
A
S
I |
News |
Chart |
SEC
View all notes Alert
me of new notes
Company
Profile
|
GMCR
- NASDAQ
Green Mtn Coffee Roastrs
FOOD & BEVERAGE - Processed & Packaged Goods
|
$67.18
|
-3.74
|
1,639,756
135% DAV
1,213,500
|
10/5/2009
(Date
Featured) |
$71.11
(Price
Featured) |
PP = $75.89 |
G |
| MB = $79.68 |
Most Recent Note - 10/28/2009 7:01:22 PM
G - Another considerable loss today with heavier volume led to a close just 10 cents above its 50 DMA line ($67.08) which was previously noted as an important support level to watch.
>>> The latest Featured Stock Update with an annotated graph appeared on 10/12/2009. click here.
|
|
C
A
S
I |
News |
Chart |
SEC
View all notes Alert
me of new notes
Company
Profile
|
PEGA
- NASDAQ
Pegasystems Inc
COMPUTER SOFTWARE & SERVICES - Business Software & Services
|
$28.35
|
-2.35
|
630,815
198% DAV
318,600
|
9/9/2009
(Date
Featured) |
$31.14
(Price
Featured) |
PP = $33.35 |
G |
| MB = $35.02 |
Most Recent Note - 10/28/2009 7:04:13 PM
G - Down today for a second consecutive considerable loss on very heavy volume. Violations of its 50 DMA line and upward trendline were previously noted as technical sell signals. Disciplined investors always limit losses when a stock falls more than 7% from their buy price. Its June highs, which were once resistance in the $27-28 area, are now being put to the test as a chart support level.
>>> The latest Featured Stock Update with an annotated graph appeared on 10/23/2009. click here.
|
|
C
A
S
I |
News |
Chart |
SEC
View all notes Alert
me of new notes
Company
Profile
|
|
|
|
THESE ARE NOT BUY RECOMMENDATIONS!
Comments contained in the body of this report are technical
opinions only. The material herein has been obtained
from sources believed to be reliable and accurate, however,
its accuracy and completeness cannot be guaranteed.
This site is not an investment advisor, hence it does
not endorse or recommend any securities or other investments.
Any recommendation contained in this report may not
be suitable for all investors and it is not to be deemed
an offer or solicitation on our part with respect to
the purchase or sale of any securities. All trademarks,
service marks and trade names appearing in this report
are the property of their respective owners, and are
likewise used for identification purposes only.
This report is a service available
only to active Paid Premium Members.
You may opt-out of receiving report notifications
at any time. Questions or comments may be submitted
by writing to Premium Membership Services 665 S.E. 10 Street, Suite 201 Deerfield Beach, FL 33441-5634 or by calling 1-800-965-8307
or 954-785-1121.
|
|
|


