You are not logged in.
This means you
CAN ONLY VIEW reports that were published prior to Monday, April 14, 2025.
You
MUST UPGRADE YOUR MEMBERSHIP if you want to see any current reports.
AFTER MARKET UPDATE - MONDAY, OCTOBER 27TH, 2014
Previous After Market Report Next After Market Report >>>
|
|
|
|
DOW |
+12.53 |
16,817.94 |
+0.07% |
|
Volume |
741,283,900 |
+6% |
|
Volume |
1,447,523,180 |
-11% |
|
NASDAQ |
+2.21 |
4,485.93 |
+0.05% |
|
Advancers |
1,319 |
41% |
|
Advancers |
1,261 |
44% |
|
S&P 500 |
-2.95 |
1,961.63 |
-0.15% |
|
Decliners |
1,757 |
55% |
|
Decliners |
1,470 |
52% |
|
Russell 2000 |
-1.35 |
1,117.48 |
-0.12% |
|
52 Wk Highs |
115 |
|
|
52 Wk Highs |
41 |
|
|
S&P 600 |
-0.59 |
645.21 |
-0.09% |
|
52 Wk Lows |
56 |
|
|
52 Wk Lows |
64 |
|
|
 |
Major Averages Lacked Decisiveness Ahead of Fed Meeting
Kenneth J. Gruneisen - Passed the CAN SLIM® Master's Exam
The major indices finished little changed on Monday. The Dow rose 13 points to 16,817. The S&P 500 slipped 3 points to 1,961. The NASDAQ Composite was 2 points higher at 4,485. The volume totals were reported mixed, higher than the prior session total on the NYSE but lighter on the Nasdaq exchange. Breadth was negative as decliners led advancers by almost a 3-2 margin on the NYSE and 7-6 on the Nasdaq exchange. There were 44 high-ranked companies from the CANSLIM.net Leaders List that made new 52-week highs and appeared on the CANSLIM.net BreakOuts Page, up from the prior session total of 35 stocks. New 52-week highs outnumbered new 52-week lows on the NYSE but new lows outnumbered new highs on the Nasdaq exchange. There were gains for 6 of the 9 high-ranked companies currently on the Featured Stocks Page, a list which gained a few new companies as broader market conditions improved. Disciplined investors know that new buying efforts may be made under the fact-based investment system only in stocks meeting all key criteria.
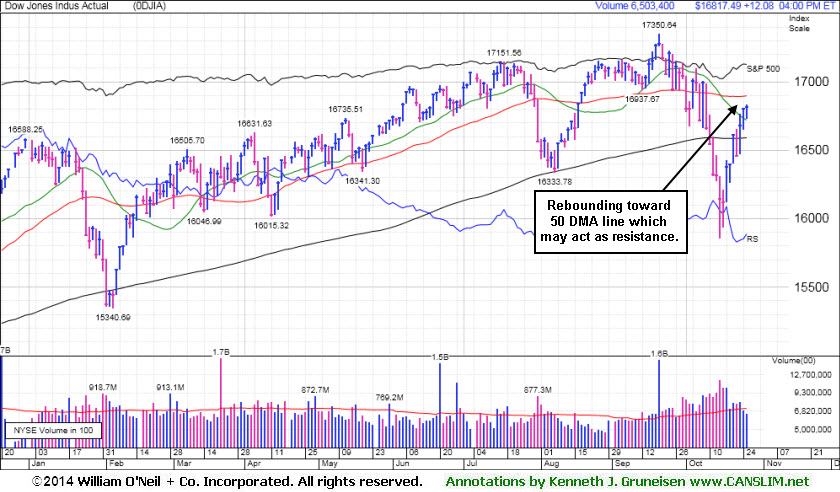
PICTURED: The Dow Jones Industrial Average is rebounding toward its 50-day moving average (DMA) line after recovering from a dip below its 200 DMA during the recent market "correction". The 50 DMA line is an important short-term average which may now act as resistance, while subsequent gains above the 50 DMA line would be a more reassuring sign that the recently confirmed new rally is strong and sustainable.
The major averages ended a choppy session mixed amid a cautious tone ahead of the start to the Fed's two-day policy meeting. Investors also appeared to weigh the latest corporate earnings and economic releases. Merck (MRK -2.01%) after reducing the top-end of its sales guidance. Seagate (STX +0.65%) rose as profits topped consensus estimates. Shares of Twitter (TWTR -2.78%) fell ahead of its quarterly results after the close. On the data front, reports showed the pace of activity in both the service and manufacturing sectors slowed in October. A separate release revealed pending home sales rose +0.3% in September, less than a projected +1% increase.
Energy was the worst performing sector on the session. Newfield Exploration (NFX -4.64%) and Halliburton (HAL -6.08%) fell in sympathy with a decline in crude oil. Telecom and consumer discretionary were the best performing groups with Verizon (VZ +1.33%) and Chipotle Mexican Grill (CMG +2.3%).
Treasuries rose with benchmark 10-year notes gaining 4/32 to yield 2.26%. In commodities, WTI crude oil recovered from a decline below $80/barrel to finish down 0.3% at $80.74. COMEX gold slipped 0.2% to $1,229.10/ounce
Large gains last Tuesday backed by higher volume totals while leadership (stocks hitting new 52-week highs) expanded met the definition of a "follow-through day" confirming a new uptrend for the market (M criteria). The S&P 500 Index, Nasdaq Composite Index, and the Dow Jones Industrial Average have collectively rebounded above their respective 200-day moving average (DMA) lines, technically putting the market in a "healthier" stance.
The CANSLIM.net Featured Stocks Page shows the most action-worthy candidates and their latest notes and a Headline Link directs members to the latest detailed analysis with data-packed graphs annotated by a Certified expert along with links to additional resources. The Premium Member Homepage includes "dynamic archives" to all prior pay reports published.
|
 Kenneth J. Gruneisen started out as a licensed stockbroker in August 1987, a couple of months prior to the historic stock market crash that took the Dow Jones Industrial Average down -22.6% in a single day. He has published daily fact-based fundamental and technical analysis on high-ranked stocks online for two decades. Through FACTBASEDINVESTING.COM, Kenneth provides educational articles, news, market commentary, and other information regarding proven investment systems that work in good times and bad.
Comments contained in the body of this report are technical opinions only and are not necessarily those of Gruneisen Growth Corp. The material herein has been obtained from sources believed to be reliable and accurate, however, its accuracy and completeness cannot be guaranteed. Our firm, employees, and customers may effect transactions, including transactions contrary to any recommendation herein, or have positions in the securities mentioned herein or options with respect thereto. Any recommendation contained in this report may not be suitable for all investors and it is not to be deemed an offer or solicitation on our part with respect to the purchase or sale of any securities. |
|
 |
Retail and Tech Gains Offset By Losses in Commodity-Linked Groups
Kenneth J. Gruneisen - Passed the CAN SLIM® Master's Exam
The Retail Index ($RLX +0.30%) was a positive influence on the major averages on Monday. Financial shares were little changed as the Bank Index ($BKX +0.12%) edged higher and the Broker/Dealer Index ($XBD -0.04%) finished flat. The Biotechnology Index ($BTK +1.06%) led the tech sector higher, and the Semiconductor Index ($SOX +0.36%) and Networking Index ($NWX +0.55%) both followed with smaller gains. Weakness in energy-related shares pressured the Oil Services Index ($OSX -3.37%) and the Integrated Oil Index ($XOI -1.88%). The Gold & Silver Index ($XAU -1.78%) also slumped.
Charts courtesy www.stockcharts.com
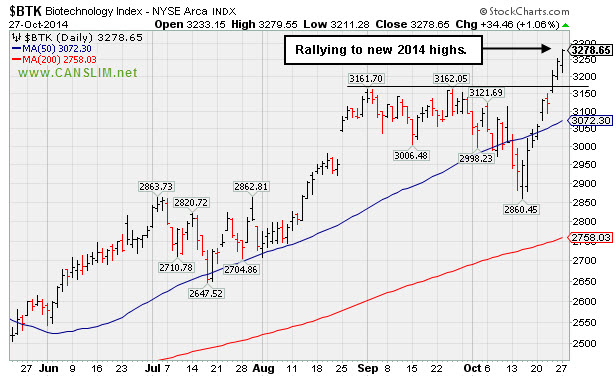
PICTURED: The Biotechnology Index ($BTK +1.06%) has rallied to new 2014 highs with a streak of 3 consecutive gains.
| Oil Services |
$OSX |
236.88 |
-8.26 |
-3.37% |
-15.71% |
| Integrated Oil |
$XOI |
1,427.28 |
-27.42 |
-1.88% |
-5.05% |
| Semiconductor |
$SOX |
614.23 |
+2.18 |
+0.36% |
+14.80% |
| Networking |
$NWX |
310.66 |
+1.70 |
+0.55% |
-4.10% |
| Broker/Dealer |
$XBD |
166.05 |
-0.07 |
-0.04% |
+3.42% |
| Retail |
$RLX |
929.09 |
+2.78 |
+0.30% |
-1.14% |
| Gold & Silver |
$XAU |
74.58 |
-1.35 |
-1.78% |
-11.37% |
| Bank |
$BKX |
69.48 |
+0.08 |
+0.12% |
+0.32% |
| Biotech |
$BTK |
3,278.65 |
+34.46 |
+1.06% |
+40.69% |
|
|
|
 |
No Resistance Remains; Perched at Secondary Buy Point
Kenneth J. Gruneisen - Passed the CAN SLIM® Master's Exam
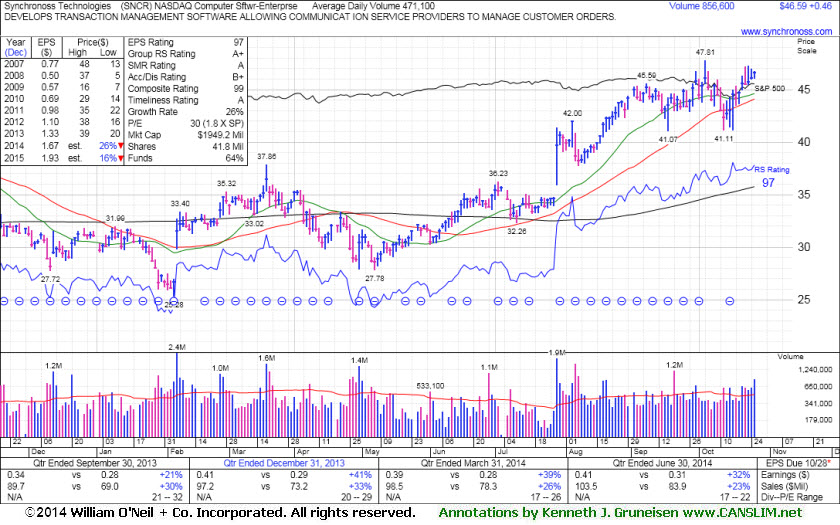
Synchronoss Technologies (SNCR +$0.46 or +1.00% to $46.59) was highlighted in yellow while perched near its 52-week high with an annotated weekly graph in the earlier mid-day report (read here). No resistance remains due to overhead supply. In the Certification they teach that a valid secondary buy point exists under the fact-based system up to +5% above the latest high following the first successful test of a stock's 10-week moving average (WMA) line after an earlier technical breakout. The mid-day report showed an annotated weekly graph which illustrated its successful test of the 10 WMA.
The high-ranked Computer Software - Enterprise firm is due to report Sep '14 quarterly earnings Tuesday morning. Volume and volatility often increase near earnings news. It was last noted with caution in the 8/20/14 mid-day report - "Patient investors may watch for a new base or secondary buy point to possibly develop and be noted in the weeks ahead. Quarterly earnings (C criteria) history through Jun '14 has been above the guidelines of the fact-based system and it has a strong annual earnings (A criteria) history."
The number of top-rated funds owning its shares rose from 277 in Mar '14 to 286 in Sep '14, a reassuring sign concerning the I criteria. Its current Up/Down Volume Ratio of 2.0 is an unbiased indication its shares have been under accumulation over the past 50 days.
|
|
|
Color Codes Explained :
Y - Better candidates highlighted by our
staff of experts.
G - Previously featured
in past reports as yellow but may no longer be buyable under the
guidelines.
***Last / Change / Volume data in this table is the closing quote data***
Symbol/Exchange
Company Name
Industry Group |
PRICE |
CHANGE
(%Change) |
Day High |
Volume
(% DAV)
(% 50 day avg vol) |
52 Wk Hi
% From Hi |
Featured
Date |
Price
Featured |
Pivot Featured |
|
Max Buy |
ACT
-
NYSE
Actavis plc
Medical-Generic Drugs
|
$237.75
|
-2.58
-1.07% |
$240.48
|
821,290
37.74% of 50 DAV
50 DAV is 2,176,000
|
$249.94
-4.88%
|
6/20/2014
|
$216.53
|
PP = $230.87
|
|
MB = $242.41
|
Most Recent Note - 10/21/2014 6:12:28 PM
Y - Color code is changed to yellow after rebounding above its 50 DMA line today helping its outlook improve. Found support at its 200 DMA line following damaging losses marked by volume. See the latest FSU analysis for more details and new annotated graphs.
>>> FEATURED STOCK ARTICLE : Quiet Gains Help Generic Drug Firm Rise Above 50-Day Average - 10/21/2014
View all notes |
Set NEW NOTE alert |
CANSLIM.net Company Profile |
SEC
News |
Chart |
Request a new note
C
A N
S L
I M


|
AFSI
-
NASDAQ
Amtrust Financial Svcs
INSURANCE - Property and; Casualty Insurance
|
$50.93
|
+1.56
3.16% |
$51.17
|
659,719
88.55% of 50 DAV
50 DAV is 745,000
|
$51.08
-0.29%
|
10/17/2014
|
$45.24
|
PP = $46.02
|
|
MB = $48.32
|
Most Recent Note - 10/22/2014 12:06:41 PM
G - Rallying further above its "max buy" level with today's 5th consecutive volume-driven gain. Finished at the session high with a gap up and considerable volume-driven gain on the prior session triggering a technical buy signal. Prior highs in the $46-47 area define support to watch on pullbacks.
>>> FEATURED STOCK ARTICLE : Perched Near High After Rebounding From 200-Day Average - 10/17/2014
View all notes |
Set NEW NOTE alert |
CANSLIM.net Company Profile |
SEC
News |
Chart |
Request a new note
C
A N
S L
I M
|
ALXN
-
NASDAQ
Alexion Pharmaceuticals
DRUGS - Drug Manufacturers - Other
|
$190.88
|
+0.59
0.31% |
$191.00
|
783,910
65.33% of 50 DAV
50 DAV is 1,200,000
|
$190.85
0.01%
|
10/23/2014
|
$184.01
|
PP = $185.53
|
|
MB = $194.81
|
Most Recent Note - 10/24/2014 4:36:51 PM
Y - Hit new 52-week and all-time highs with today's 2nd consecutive volume-driven gain and it finished near the session high. It was highlighted in yellow in the 10/23/14 mid-day report (read here) as solid volume-driven gains triggered a technical buy signal. Prior highs in the $180 area define initial support to watch on pullbacks. See the latest FSU analysis for more details and annotated graphs.
>>> FEATURED STOCK ARTICLE : Finished Strong After Gapping Up Above Prior High - 10/23/2014
View all notes |
Set NEW NOTE alert |
CANSLIM.net Company Profile |
SEC
News |
Chart |
Request a new note
C
A N
S L
I M
|
EPAM
-
NYSE
Epam Systems Inc
COMPUTER SOFTWARE and SERVICES - Information Technology Service
|
$47.31
|
+2.95
6.65% |
$47.31
|
837,780
212.63% of 50 DAV
50 DAV is 394,000
|
$46.70
1.30%
|
10/23/2014
|
$45.21
|
PP = $46.09
|
|
MB = $48.39
|
 Most Recent Note - 10/27/2014 12:13:43 PM
Y - Hitting a new high with today's volume-driven gain clearing the pivot point cited based on its 6/09/14 high plus 10 cents in the 10/23/14 mid-day report (read here). A strong finish may clinch a convincing technical buy signal. See the latest FSU analysis for more details and annotated graphs.
>>> FEATURED STOCK ARTICLE : Pulled Back After Challenging Prior Highs - 10/24/2014
View all notes |
Set NEW NOTE alert |
CANSLIM.net Company Profile |
SEC
News |
Chart |
Request a new note
C
A N
S L
I M
|
FB
-
NASDAQ
Facebook Inc Cl A
INTERNET
|
$80.37
|
-0.31
-0.38% |
$80.80
|
20,661,772
59.10% of 50 DAV
50 DAV is 34,962,000
|
$80.82
-0.56%
|
9/9/2014
|
$76.67
|
PP = $76.84
|
|
MB = $80.68
|
Most Recent Note - 10/23/2014 5:51:21 PM
Y - Wedged higher and hit another new 52-week high while approaching its "max buy" level with average volume behind today's gain. Rebound above the 50 DMA line helped its outlook improve and its color code was changed to yellow.
>>> FEATURED STOCK ARTICLE : Volume-Driven Losses Triggered Sell Signals After Slumping Into Prior Base - 10/16/2014
View all notes |
Set NEW NOTE alert |
CANSLIM.net Company Profile |
SEC
News |
Chart |
Request a new note
C
A N
S L
I M
|
Symbol/Exchange
Company Name
Industry Group |
PRICE |
CHANGE
(%Change) |
Day High |
Volume
(% DAV)
(% 50 day avg vol) |
52 Wk Hi
% From Hi |
Featured
Date |
Price
Featured |
Pivot Featured |
|
Max Buy |
ILMN
-
NASDAQ
Illumina Inc
DRUGS - Biotechnology
|
$191.36
|
+2.24
1.18% |
$192.49
|
812,920
65.24% of 50 DAV
50 DAV is 1,246,000
|
$190.86
0.26%
|
10/22/2014
|
$188.77
|
PP = $182.27
|
|
MB = $191.38
|
Most Recent Note - 10/24/2014 5:36:28 PM
Y - Perched at its 52-week high following today's 4th consecutive gain. Prior highs near $182 define near-term support to watch on pullbacks. See the latest FSU analysis for more details and annotated graphs.
>>> FEATURED STOCK ARTICLE : Breakout Cleared "Double Bottom" Base Pattern - 10/22/2014
View all notes |
Set NEW NOTE alert |
CANSLIM.net Company Profile |
SEC
News |
Chart |
Request a new note
C
A N
S L
I M
|
PANW
-
NYSE
Palo Alto Networks
Computer Sftwr-Security
|
$102.90
|
-5.16
-4.78% |
$103.90
|
2,434,082
110.74% of 50 DAV
50 DAV is 2,198,000
|
$108.50
-5.16%
|
7/30/2014
|
$84.21
|
PP = $85.88
|
|
MB = $90.17
|
Most Recent Note - 10/27/2014 12:25:37 PM
G - Gapped down today, retreating from its 52-week high. It is extended from any sound base. Recent low ($87.83 on 10/13/14) and 50 DMA line define important near-term support where violations would trigger technical sell signals.
>>> FEATURED STOCK ARTICLE : Prompt Rebound Above 50-Day Average an Encouraging Sign of Support - 10/14/2014
View all notes |
Set NEW NOTE alert |
CANSLIM.net Company Profile |
SEC
News |
Chart |
Request a new note
C
A N
S L
I M
|
SNCR
-
NASDAQ
Synchronoss Technologies
COMPUTER SOFTWARE andamp; SERVICES - Application Software
|
$46.32
|
+0.19
0.41% |
$46.80
|
480,250
101.96% of 50 DAV
50 DAV is 471,000
|
$47.81
-3.12%
|
10/27/2014
|
$46.40
|
PP = $47.81
|
|
MB = $50.20
|
Most Recent Note - 10/27/2014 12:59:18 PM
Y - Color code is changed to yellow while perched near its 52-week high. In the Certification they teach that a valid secondary buy point exists under the fact-based system up to +5% above the latest high following the first successful test of a stock's 10-week moving average (WMA) line after an earlier technical breakout. Due to report Sep '14 quarterly earnings tomorrow morning, and volume and volatility often increase near earnings news. Last noted in the 8/20/14 mid-day report - "Patient investors may watch for a new base or secondary buy point to possibly develop and be noted in the weeks ahead. Quarterly earnings (C criteria) history through Jun '14 has been above the guidelines of the fact-based system and it has a strong annual earnings (A criteria) history."
 There are no Featured Stock Updates™ available for this stock at this time. You may request one by clicking the Request a New Note link below
View all notes |
Set NEW NOTE alert |
CANSLIM.net Company Profile |
SEC
News |
Chart |
Request a new note
C
A N
S L
I M
|
STRT
-
NASDAQ
Strattec Security Corp
AUTOMOTIVE - Auto Parts
|
$98.17
|
+1.48
1.53% |
$101.53
|
31,153
119.82% of 50 DAV
50 DAV is 26,000
|
$97.44
0.75%
|
9/19/2014
|
$86.06
|
PP = $89.97
|
|
MB = $94.47
|
Most Recent Note - 10/27/2014 1:01:08 PM
G - Hit another new 52-week high with today's 3rd consecutive volume-driven gain, getting extended beyond its "max buy" level. Its 50 DMA line defines important near-term support. Reported +180% earnings on +54% sales revenues for the Sep '14 quarter, showing impressive sales and earnings acceleration in recent quarterly comparisons.
>>> FEATURED STOCK ARTICLE : Building Base-On-Base Pattern Ahead of Earnings News - 10/20/2014
View all notes |
Set NEW NOTE alert |
CANSLIM.net Company Profile |
SEC
News |
Chart |
Request a new note
C
A N
S L
I M
|
|
|
|
THESE ARE NOT BUY RECOMMENDATIONS!
Comments contained in the body of this report are technical
opinions only. The material herein has been obtained
from sources believed to be reliable and accurate, however,
its accuracy and completeness cannot be guaranteed.
This site is not an investment advisor, hence it does
not endorse or recommend any securities or other investments.
Any recommendation contained in this report may not
be suitable for all investors and it is not to be deemed
an offer or solicitation on our part with respect to
the purchase or sale of any securities. All trademarks,
service marks and trade names appearing in this report
are the property of their respective owners, and are
likewise used for identification purposes only.
This report is a service available
only to active Paid Premium Members.
You may opt-out of receiving report notifications
at any time. Questions or comments may be submitted
by writing to Premium Membership Services 665 S.E. 10 Street, Suite 201 Deerfield Beach, FL 33441-5634 or by calling 1-800-965-8307
or 954-785-1121.
|
|
|

