You are not logged in.
This means you
CAN ONLY VIEW reports that were published prior to Monday, April 14, 2025.
You
MUST UPGRADE YOUR MEMBERSHIP if you want to see any current reports.
AFTER MARKET UPDATE - FRIDAY, OCTOBER 26TH, 2012
Previous After Market Report Next After Market Report >>>
|
|
|
|
DOW |
+3.53 |
13,107.21 |
+0.03% |
|
Volume |
738,283,040 |
+6% |
|
Volume |
1,743,829,510 |
-4% |
|
NASDAQ |
+1.83 |
2,987.95 |
+0.06% |
|
Advancers |
1,219 |
39% |
|
Advancers |
1,032 |
40% |
|
S&P 500 |
-1.03 |
1,411.94 |
-0.07% |
|
Decliners |
1,767 |
56% |
|
Decliners |
1,408 |
55% |
|
Russell 2000 |
-3.57 |
813.25 |
-0.44% |
|
52 Wk Highs |
64 |
|
|
52 Wk Highs |
38 |
|
|
S&P 600 |
-1.96 |
454.44 |
-0.43% |
|
52 Wk Lows |
35 |
|
|
52 Wk Lows |
57 |
|
|
 |
Major Averages Quietly Ended Down For The Week
Kenneth J. Gruneisen - Passed the CAN SLIM® Master's Exam
For the week, the Dow Jones Industrial Average fell the hardest with a loss of -1.8%, the benchmark S&P 500 Index gave up -1.5%, and the Nasdaq Composite Index retreated -0.63%. On Friday's session the major averages finished flat after another volatile trading day. The volume totals were reported mixed, lighter on the NYSE and higher on the Nasdaq exchange versus the prior session's totals. Breadth was negative as decliners led advancers by a 3-2 margin on the NYSE and by a 7-5 margin on the Nasdaq exchange. The total number of stocks hitting new 52-week highs outnumbered new 52-week lows on the NYSE, but on the Nasdaq exchange new lows again outnumbered new highs. There were 26 high-ranked companies from the CANSLIM.net Leaders List making new 52-week highs and appearing on the CANSLIM.net BreakOuts Page, matching the prior session total of 26 stocks. There were gains for 11 of the 17 high-ranked companies currently included on the Featured Stocks Page, a more positive bias than was seen in the broader market.
Investors spent the day digesting a batch of mixed economic data and earnings reports. On the data front, the U.S. economy continued to expand at a modest pace in the third-quarter as GDP rose at an annual rate of 2% after a 1.3% advance in the second-quarter. In a separate report, the University of Michigan consumer sentiment index for October was lower than the preliminary reading, but managed to reach its highest level since September 2007.
Apple Inc (AAPL -0.91%) edged lower after a disappointing holiday sales outlook. Overall, nearly all sectors were lower. Financials were the worst performing group as Citigroup Inc (C -2.17%) and Bank of America Corp (BAC -1.30%) declined. Meanwhile, the defensive telecommunication stocks held onto gains and Verizon Communications Inc (VZ +1.08%) rose. Amazon.com Inc (AMZN +6.87%) also rallied after its operating loss was not as bad as expected.
In fixed-income, Treasuries gained ground with the 10-year note up 21/32 to yield 1.75%.
During market corrections the M criteria argues against new buying efforts and urges investors to take a defensive stance to protect precious capital. That stance can change back to a bullish stance where buying is encouraged when at least one of the three major averages produces a solid follow-through day (FTD). A FTD confirming a new rally requires substantial gains on higher (ideally above average) volume, coupled with healthy leadership and a respectable number of stocks hitting new 52-week highs. Historic studies have shown that a FTD occurring between Days 4-7 of a new rally effort has often signaled the beginning of the most substantial market rallies.
Investors should always limit losses if ever any stock falls more than -7% from their purchase price. Following strict sell rules is precisely how this fact-based investment system prompts investors to reduce exposure and protect cash during market downturns. Keep a watchlist of strong acting stocks with all-key criteria in anticipation of the next confirmed uptrend. See the noteworthy candidates included on the Featured Stocks Page.
Watch for an announcement via email concerning the Q3 2012 WEBCAST. The webcast will also be available via an updated link highlighted at the top of the Premium Member Homepage.
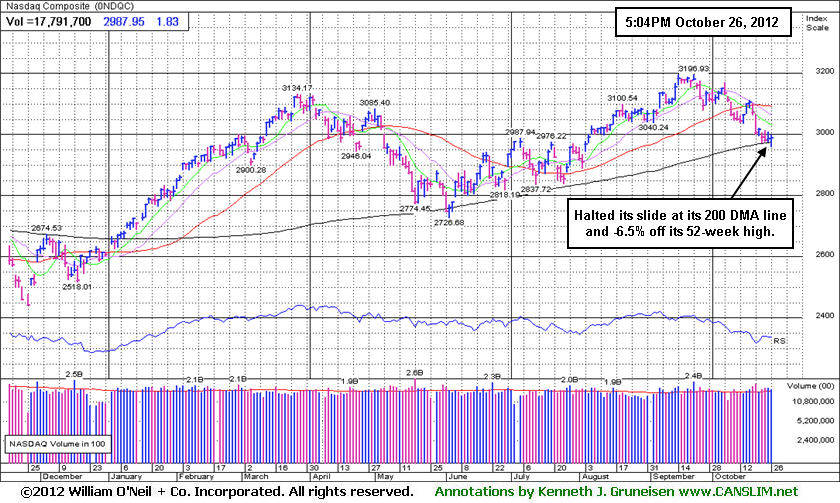
PICTURED: The Nasdaq Composite Index finished -6.5% off its 52-week high. It halted its slide at its 200-day moving average (DMA) line. Subsequent deterioration would not bode well for the broader market outlook. Further weakness would be a signal for investors to reduce market exposure if they are not already entirely in cash. In this commentary we will continue to watch closely for an eventual rally and confirming gains within the ideal window for a proper FTD, meanwhile caution and patience are required.
|
 Kenneth J. Gruneisen started out as a licensed stockbroker in August 1987, a couple of months prior to the historic stock market crash that took the Dow Jones Industrial Average down -22.6% in a single day. He has published daily fact-based fundamental and technical analysis on high-ranked stocks online for two decades. Through FACTBASEDINVESTING.COM, Kenneth provides educational articles, news, market commentary, and other information regarding proven investment systems that work in good times and bad.
Comments contained in the body of this report are technical opinions only and are not necessarily those of Gruneisen Growth Corp. The material herein has been obtained from sources believed to be reliable and accurate, however, its accuracy and completeness cannot be guaranteed. Our firm, employees, and customers may effect transactions, including transactions contrary to any recommendation herein, or have positions in the securities mentioned herein or options with respect thereto. Any recommendation contained in this report may not be suitable for all investors and it is not to be deemed an offer or solicitation on our part with respect to the purchase or sale of any securities. |
|
 |
Bank and Commodity-Linked Groups Fell; Retail and Tech Groups Rose
Kenneth J. Gruneisen - Passed the CAN SLIM® Master's Exam
The Bank Index ($BKX -0.91%) was a negative influence on the major averages, limiting their ability to rally on Friday. The Retail Index ($RLX +0.99%) posted an influential gain, and the tech sector finished with a positive bias as the Semiconductor Index ($SOX +0.49%), Networking Index ($NWX +0.73%), and the Internet Index ($IIX +0.93%) rose. Meanwhile, the Biotechnology Index ($BTK -1.86%) was a laggard and the Healthcare Index ($HMO -0.66%) also suffered a modest loss. Commodity-linked groups had a slightly negative bias as the Gold & Silver Index ($XAU -0.77%) and Oil Services Index ($OSX -0.71%) pulled back, meanwhile the Integrated Oil Index ($XOI +0.10%) held its ground.
Charts courtesy www.stockcharts.com
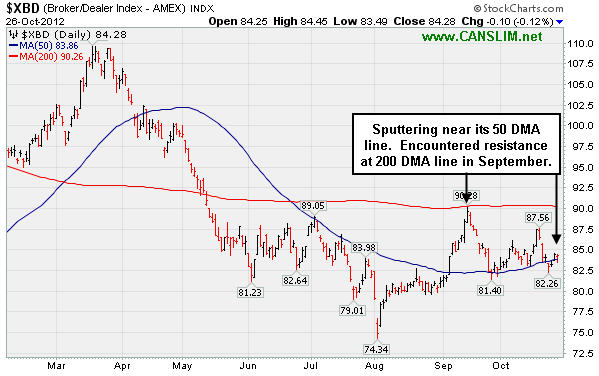
PICTURED: The Broker/Dealer Index ($XBD -0.12%) is sputtering near its 50-day moving average (DMA) line. It encountered resistance in September at its 200 DMA line.
| Oil Services |
$OSX |
219.81 |
-1.58 |
-0.71% |
+1.63% |
| Healthcare |
$HMO |
2,480.35 |
-16.47 |
-0.66% |
+8.71% |
| Integrated Oil |
$XOI |
1,227.38 |
+1.28 |
+0.10% |
-0.14% |
| Semiconductor |
$SOX |
367.28 |
+1.80 |
+0.49% |
+0.78% |
| Networking |
$NWX |
196.01 |
+1.42 |
+0.73% |
-8.90% |
| Internet |
$IIX |
304.91 |
+2.80 |
+0.93% |
+8.22% |
| Broker/Dealer |
$XBD |
84.28 |
-0.10 |
-0.12% |
+1.22% |
| Retail |
$RLX |
640.11 |
+6.25 |
+0.99% |
+22.35% |
| Gold & Silver |
$XAU |
182.72 |
-1.42 |
-0.77% |
+1.15% |
| Bank |
$BKX |
49.25 |
-0.45 |
-0.91% |
+25.06% |
| Biotech |
$BTK |
1,428.77 |
-27.07 |
-1.86% |
+30.91% |
|
|
|
 |
Sputtering Software Firm Rebounds for New 52-Week High Following Earnings
Kenneth J. Gruneisen - Passed the CAN SLIM® Master's Exam
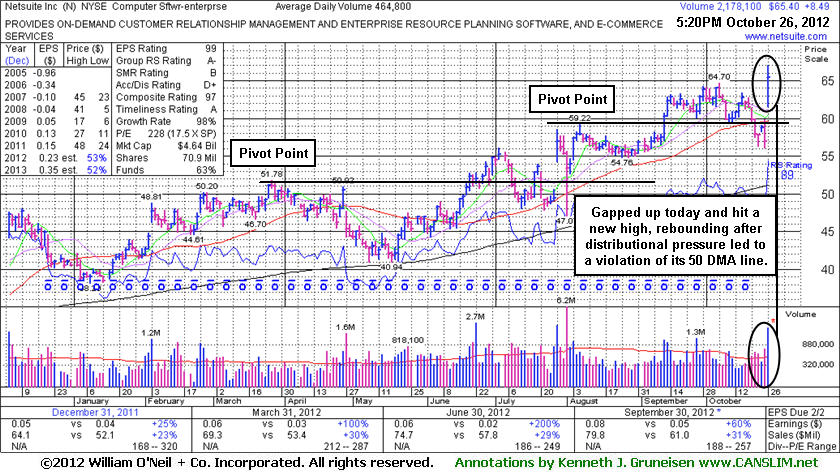
Netsuite Inc (N +$8.49 or +14.92% to $65.40) gapped up from below its 50-day moving average(DMA) line and blasted to new 52-week and all-time highs. It reported earnings +60% on +31% sales revenues for the quarter ended September 30, 2012 versus the year ago period. It was last shown in this FSU section on 9/24/12 with an annotated graph under the headline, "Consolidating Following Recent Technical Breakout". The rally above its pivot point with +85% above average volume on 9/12/12 had triggered a new (or add-on) technical buy signal. The high-ranked Computer Software -Enterprise firm did not form a sound new base pattern recently, in fact, distributional pressure had led to a violation of its 50 DMA line and a slump back into its prior base which had raised concerns and triggered technical sell signals. Additionally, keep in mind that until the major averages are back in a confirmed rally the M criteria argues against any new buying efforts.
It reported earnings above the +25% guideline (C criteria) in the 4 latest quarterly comparisons through Jun '12. Its annual earnings (A criteria) history improved from losses prior to FY '09. The number of top-rated funds owning its shares rose from 201 in Jun '11 to 275 in Sep '12, a reassuring sign concerning the I criteria. The Computer Software -Enterprise group has a Group Relative Strength Rating of A-, a reassuring sign concerning the L criteria.
Disciplined investors always limit losses by selling if any stock falls more than -7% from their purchase price. If a stock strengthens after it is sold it can always be bought back, but following strict selling rules is what keeps an investor from letting small losses become large losses. In a bullish market environment, leading stocks often flash numerous buy signals from multiple-bases.
|
|
|
Color Codes Explained :
Y - Better candidates highlighted by our
staff of experts.
G - Previously featured
in past reports as yellow but may no longer be buyable under the
guidelines.
***Last / Change / Volume data in this table is the closing quote data***
Symbol/Exchange
Company Name
Industry Group |
PRICE |
CHANGE
(%Change) |
Day High |
Volume
(% DAV)
(% 50 day avg vol) |
52 Wk Hi
% From Hi |
Featured
Date |
Price
Featured |
Pivot Featured |
|
Max Buy |
ASPS
-
NASDAQ
Altisource Ptf Sltns Sa
REAL ESTATE - Property Management/Developmen
|
$115.41
|
-0.49
-0.42% |
$116.59
|
312,759
148.30% of 50 DAV
50 DAV is 210,900
|
$129.72
-11.03%
|
9/24/2012
|
$87.24
|
PP = $92.39
|
|
MB = $97.01
|
Most Recent Note - 10/25/2012 11:56:58 AM
G - Perched at 52-week and all-time highs today following a considerable volume-driven gain on the prior session. Previously noted - "Very extended from its prior base, its prior highs in the $92 area define initial support to watch on pullbacks."
>>> The latest Featured Stock Update with an annotated graph appeared on 10/12/2012. Click here.
View all notes |
Alert me of new notes |
CANSLIM.net Company Profile |
SEC |
Zacks Reports |
StockTalk |
News |
Chart |
Request a new note
C
A N
S L
I M


|
BRLI
-
NASDAQ
Bio Reference Labs Inc
HEALTH SERVICES - Medical Laboratories and Researc
|
$28.02
|
-0.95
-3.28% |
$29.08
|
883,271
268.47% of 50 DAV
50 DAV is 329,000
|
$32.86
-14.73%
|
10/3/2012
|
$30.90
|
PP = $30.25
|
|
MB = $31.76
|
 Most Recent Note - 10/26/2012 4:24:20 PM
G - Damaging losses for 6 consecutive sessions undercut prior highs in the $30 area and violated its 50 DMA line triggering technical sell signals and raising serious concerns.
>>> The latest Featured Stock Update with an annotated graph appeared on 10/8/2012. Click here.
View all notes |
Alert me of new notes |
CANSLIM.net Company Profile |
SEC |
Zacks Reports |
StockTalk |
News |
Chart |
Request a new note
C
A N
S L
I M
|
CFNL
-
NASDAQ
Cardinal Financial Corp
BANKING - Regional - Southeast Banks
|
$15.80
|
+0.04
0.25% |
$15.94
|
134,527
133.46% of 50 DAV
50 DAV is 100,800
|
$15.80
0.00%
|
8/17/2012
|
$12.84
|
PP = $13.31
|
|
MB = $13.98
|
Most Recent Note - 10/25/2012 6:53:39 PM
G - Tallied a 3rd consecutive big gain with heavy volume and finished near the session high at a new 52-week high. Color code was changed to green after rallying more than +5% above its latest highs (9/24/12 high of $14.79). See the latest FSU analysis for more details and a new annotated weekly graph.
>>> The latest Featured Stock Update with an annotated graph appeared on 10/25/2012. Click here.
View all notes |
Alert me of new notes |
CANSLIM.net Company Profile |
SEC |
Zacks Reports |
StockTalk |
News |
Chart |
Request a new note
C
A N
S L
I M
|
CMCSA
-
NASDAQ
Comcast Corp Cl A
MEDIA - CATV Systems
|
$37.56
|
+1.20
3.30% |
$37.78
|
23,692,056
200.69% of 50 DAV
50 DAV is 11,805,100
|
$37.60
-0.11%
|
6/11/2012
|
$29.94
|
PP = $30.98
|
|
MB = $32.53
|
Most Recent Note - 10/26/2012 11:59:12 AM
G - Rallying near its 52-week high today. Upward trendline and 50 DMA line define near term support where violations would trigger technical sell signals. Fundamental concerns have been repeatedly noted - "Due to sub par sales and earnings growth in the Jun '12 quarter."
>>> The latest Featured Stock Update with an annotated graph appeared on 10/24/2012. Click here.
View all notes |
Alert me of new notes |
CANSLIM.net Company Profile |
SEC |
Zacks Reports |
StockTalk |
News |
Chart |
Request a new note
C
A N
S L
I M
|
DVA
-
NYSE
Davita Inc
HEALTH SERVICES - Specialized Health Services
|
$111.02
|
-0.39
-0.35% |
$112.84
|
812,620
104.48% of 50 DAV
50 DAV is 777,800
|
$113.48
-2.17%
|
9/5/2012
|
$102.92
|
PP = $100.62
|
|
MB = $105.65
|
Most Recent Note - 10/24/2012 4:03:29 PM
G - Hovering near its 52-week high, extended from its latest sound base. Prior highs near $100 and its 50 DMA line define near-term support to watch on pullbacks where violations may trigger technical sell signals.
>>> The latest Featured Stock Update with an annotated graph appeared on 10/10/2012. Click here.
View all notes |
Alert me of new notes |
CANSLIM.net Company Profile |
SEC |
Zacks Reports |
StockTalk |
News |
Chart |
Request a new note
C
A N
S L
I M
|
Symbol/Exchange
Company Name
Industry Group |
PRICE |
CHANGE
(%Change) |
Day High |
Volume
(% DAV)
(% 50 day avg vol) |
52 Wk Hi
% From Hi |
Featured
Date |
Price
Featured |
Pivot Featured |
|
Max Buy |
GPX
-
NYSE
G P Strategies Corp
DIVERSIFIED SERVICES - Education and Training Services
|
$19.69
|
+0.31
1.60% |
$19.70
|
19,872
33.80% of 50 DAV
50 DAV is 58,800
|
$20.67
-4.74%
|
10/8/2012
|
$20.00
|
PP = $20.77
|
|
MB = $21.81
|
Most Recent Note - 10/24/2012 4:06:49 PM
G - Gains have lacked volume conviction since violating its 50 DMA line, and its slump below its previously noted low ($18.82 on 10/04/12) raised more serious concerns and triggered a technical sell signal. Gains above its 50 DMA line are needed for its outlook to improve
>>> The latest Featured Stock Update with an annotated graph appeared on 10/16/2012. Click here.
View all notes |
Alert me of new notes |
CANSLIM.net Company Profile |
SEC |
Zacks Reports |
StockTalk |
News |
Chart |
Request a new note
C
A N
S L
I M
|
LKQ
-
NASDAQ
L K Q Corp
WHOLESALE - Auto Parts
|
$20.76
|
+0.71
3.54% |
$20.86
|
2,498,213
163.40% of 50 DAV
50 DAV is 1,528,900
|
$21.22
-2.14%
|
8/9/2012
|
$18.97
|
PP = $18.72
|
|
MB = $19.66
|
Most Recent Note - 10/26/2012 4:19:02 PM
G - Rallied with above average volume today following a pullback near its 50 DMA line on the prior session. Showed resilience after reporting earnings +6% on +30% sales revenues for the Sep '12 quarter, below the +25% minimum earnings guideline (C criteria), raising fundamental concerns. Still perched near its 52-week high, and no resistance remains due to overhead supply.
>>> The latest Featured Stock Update with an annotated graph appeared on 10/19/2012. Click here.
View all notes |
Alert me of new notes |
CANSLIM.net Company Profile |
SEC |
Zacks Reports |
StockTalk |
News |
Chart |
Request a new note
C
A N
S L
I M
|
MIDD
-
NASDAQ
Middleby Corp
MANUFACTURING - Diversified Machinery
|
$123.64
|
+0.23
0.19% |
$124.00
|
50,808
67.47% of 50 DAV
50 DAV is 75,300
|
$124.23
-0.47%
|
10/8/2012
|
$118.46
|
PP = $122.67
|
|
MB = $128.80
|
Most Recent Note - 10/26/2012 4:25:47 PM
Y - Finished just -0.5% off its 52-week high today. Volume totals have been below average in recent weeks while stubbornly holding its ground. Subsequent volume-driven gains above the pivot point may confirm a new (or add-on) technical buy signal. Its 50 DMA line and recent lows define near-term chart support to watch.
>>> The latest Featured Stock Update with an annotated graph appeared on 10/22/2012. Click here.
View all notes |
Alert me of new notes |
CANSLIM.net Company Profile |
SEC |
Zacks Reports |
StockTalk |
News |
Chart |
Request a new note
C
A N
S L
I M
|
N
-
NYSE
Netsuite Inc
DIVERSIFIED SERVICES - Business/Management Services
|
$65.40
|
+8.49
14.92% |
$67.02
|
2,178,172
468.63% of 50 DAV
50 DAV is 464,800
|
$64.70
1.08%
|
8/20/2012
|
$55.88
|
PP = $59.32
|
|
MB = $62.29
|
Most Recent Note - 10/26/2012 12:24:16 PM
G - Reported earnings +60% on +31% sales revenues for the Sep '12 quarter. Gapped up from below its 50 DMA line and hit new 52-week and all-time highs. It did not form a sound new base pattern. Until the major averages are back in a confirmed rally the M criteria argues against any new buying efforts.
>>> The latest Featured Stock Update with an annotated graph appeared on 10/26/2012. Click here.
View all notes |
Alert me of new notes |
CANSLIM.net Company Profile |
SEC |
Zacks Reports |
StockTalk |
News |
Chart |
Request a new note
C
A N
S L
I M
|
NSM
-
NYSE
Nationstar Mtg Hldgs Inc
FINANCIAL SERVICES - Credit Services
|
$34.23
|
+2.11
6.57% |
$34.98
|
2,356,859
160.09% of 50 DAV
50 DAV is 1,472,200
|
$37.20
-7.98%
|
8/29/2012
|
$27.96
|
PP = $28.85
|
|
MB = $30.29
|
Most Recent Note - 10/26/2012 4:16:25 PM
G - Rallied again today with above average volume, tallying a 2nd consecutive gain following a damaging loss on 10/24/12 with heavy volume that briefly violated its 50 DMA line.
>>> The latest Featured Stock Update with an annotated graph appeared on 10/11/2012. Click here.
View all notes |
Alert me of new notes |
CANSLIM.net Company Profile |
SEC |
Zacks Reports |
StockTalk |
News |
Chart |
Request a new note
C
A N
S L
I M
|
Symbol/Exchange
Company Name
Industry Group |
PRICE |
CHANGE
(%Change) |
Day High |
Volume
(% DAV)
(% 50 day avg vol) |
52 Wk Hi
% From Hi |
Featured
Date |
Price
Featured |
Pivot Featured |
|
Max Buy |
OSIS
-
NASDAQ
O S I Systems Inc
ELECTRONICS - Semiconductor Equipment and Mate
|
$79.76
|
-1.13
-1.40% |
$81.23
|
78,696
67.43% of 50 DAV
50 DAV is 116,700
|
$80.98
-1.51%
|
9/5/2012
|
$74.39
|
PP = $75.10
|
|
MB = $78.86
|
Most Recent Note - 10/23/2012 6:38:54 PM
G - Rallied with +44% above average volume today for a best-ever close, bucking a negative market backdrop. Found support at its 50 DMA line this week, and its color code is changed to green while getting extended from its prior base.
>>> The latest Featured Stock Update with an annotated graph appeared on 10/18/2012. Click here.
View all notes |
Alert me of new notes |
CANSLIM.net Company Profile |
SEC |
Zacks Reports |
StockTalk |
News |
Chart |
Request a new note
C
A N
S L
I M
|
RNF
-
NYSE
Rentech Nitrogen Ptnr Lp
CHEMICALS - Agricultural Chemicals
|
$37.77
|
+0.10
0.27% |
$37.98
|
302,094
82.58% of 50 DAV
50 DAV is 365,800
|
$40.05
-5.69%
|
7/27/2012
|
$29.58
|
PP = $30.60
|
|
MB = $32.13
|
Most Recent Note - 10/23/2012 1:09:16 PM
G - Consolidating near its 50 DMA line defining important near-term support after the previously noted upward trendline violation. Gains have lacked volume conviction after it halted its slide.
>>> The latest Featured Stock Update with an annotated graph appeared on 10/4/2012. Click here.
View all notes |
Alert me of new notes |
CANSLIM.net Company Profile |
SEC |
Zacks Reports |
StockTalk |
News |
Chart |
Request a new note
C
A N
S L
I M
|
TDG
-
NYSE
Transdigm Group Inc
AEROSPACE/DEFENSE - Aerospace/Defense Products and; Services
|
$135.44
|
+0.33
0.24% |
$137.69
|
576,326
113.25% of 50 DAV
50 DAV is 508,900
|
$139.31
-2.78%
|
8/16/2012
|
$132.23
|
PP = $136.44
|
|
MB = $143.26
|
Most Recent Note - 10/23/2012 6:30:51 PM
G - Gapped down today and undercut its 50 DMA line following a special dividend, yet it promptly rebounded back above that important short-term average. See latest FSU analysis for more details and a new annotated graph.
>>> The latest Featured Stock Update with an annotated graph appeared on 10/23/2012. Click here.
View all notes |
Alert me of new notes |
CANSLIM.net Company Profile |
SEC |
Zacks Reports |
StockTalk |
News |
Chart |
Request a new note
C
A N
S L
I M
|
ULTA
-
NASDAQ
Ulta Salon Cosm & Frag
SPECIALTY RETAIL - Specialty Retail, Other
|
$92.41
|
+0.14
0.15% |
$93.32
|
436,443
57.08% of 50 DAV
50 DAV is 764,600
|
$103.52
-10.73%
|
9/4/2012
|
$93.17
|
PP = $98.52
|
|
MB = $103.45
|
Most Recent Note - 10/24/2012 4:09:17 PM
G - Sputtering below its 50 DMA line with losses this week on lighter volume. A rebound above that important short-term average is needed for its outlook to improve. The latest FSU analysis discussed its waning Relative Strength under the headline "Relative Strength Line Did Not Provide Confirmation - Friday, October 05, 2012".
>>> The latest Featured Stock Update with an annotated graph appeared on 10/5/2012. Click here.
View all notes |
Alert me of new notes |
CANSLIM.net Company Profile |
SEC |
Zacks Reports |
StockTalk |
News |
Chart |
Request a new note
C
A N
S L
I M
|
ULTI
-
NASDAQ
Ultimate Software Group
INTERNET - Internet Software and Services
|
$96.93
|
+0.26
0.27% |
$97.36
|
106,569
72.25% of 50 DAV
50 DAV is 147,500
|
$106.40
-8.90%
|
8/27/2012
|
$98.36
|
PP = $99.19
|
|
MB = $104.15
|
Most Recent Note - 10/24/2012 4:10:36 PM
G - Halted its slide after recently undercutting prior lows in the $96 area and violating its 50 DMA line triggering technical sell signals. A rebound above its 50 DMA line is needed for its outlook to improve
>>> The latest Featured Stock Update with an annotated graph appeared on 9/27/2012. Click here.
View all notes |
Alert me of new notes |
CANSLIM.net Company Profile |
SEC |
Zacks Reports |
StockTalk |
News |
Chart |
Request a new note
C
A N
S L
I M
|
Symbol/Exchange
Company Name
Industry Group |
PRICE |
CHANGE
(%Change) |
Day High |
Volume
(% DAV)
(% 50 day avg vol) |
52 Wk Hi
% From Hi |
Featured
Date |
Price
Featured |
Pivot Featured |
|
Max Buy |
VSI
-
NYSE
Vitamin Shoppe Inc
SPECIALTY RETAIL - Specialty Retail, Other
|
$57.38
|
+0.01
0.02% |
$57.63
|
139,262
49.05% of 50 DAV
50 DAV is 283,900
|
$61.83
-7.19%
|
10/15/2012
|
$57.82
|
PP = $60.08
|
|
MB = $63.08
|
Most Recent Note - 10/24/2012 4:12:54 PM
G - Volume was below average while its slumped below its 50 DMA line today and its color code was changed to green. A rebound above that important short-term average would help its stance, and subsequent volume-driven gains are needed to trigger a new technical buy signal.
>>> The latest Featured Stock Update with an annotated graph appeared on 10/15/2012. Click here.
View all notes |
Alert me of new notes |
CANSLIM.net Company Profile |
SEC |
Zacks Reports |
StockTalk |
News |
Chart |
Request a new note
C
A N
S L
I M
|
WPI
-
NYSE
Watson Pharmaceuticals
DRUGS - Drugs - Generic
|
$86.64
|
-0.25
-0.29% |
$87.01
|
761,919
84.88% of 50 DAV
50 DAV is 897,600
|
$89.90
-3.63%
|
8/24/2012
|
$82.90
|
PP = $81.10
|
|
MB = $85.16
|
Most Recent Note - 10/23/2012 6:41:14 PM
G - Retreating from its 52-week high with another loss on below average volume. Its 50 DMA line defines important near-term support to watch.
>>> The latest Featured Stock Update with an annotated graph appeared on 9/28/2012. Click here.
View all notes |
Alert me of new notes |
CANSLIM.net Company Profile |
SEC |
Zacks Reports |
StockTalk |
News |
Chart |
Request a new note
C
A N
S L
I M
|
|
|
|
THESE ARE NOT BUY RECOMMENDATIONS!
Comments contained in the body of this report are technical
opinions only. The material herein has been obtained
from sources believed to be reliable and accurate, however,
its accuracy and completeness cannot be guaranteed.
This site is not an investment advisor, hence it does
not endorse or recommend any securities or other investments.
Any recommendation contained in this report may not
be suitable for all investors and it is not to be deemed
an offer or solicitation on our part with respect to
the purchase or sale of any securities. All trademarks,
service marks and trade names appearing in this report
are the property of their respective owners, and are
likewise used for identification purposes only.
This report is a service available
only to active Paid Premium Members.
You may opt-out of receiving report notifications
at any time. Questions or comments may be submitted
by writing to Premium Membership Services 665 S.E. 10 Street, Suite 201 Deerfield Beach, FL 33441-5634 or by calling 1-800-965-8307
or 954-785-1121.
|
|
|

