***Last / Change / Volume data in this table is the closing quote data***
Symbol/Exchange
Company Name
Industry Group |
PRICE |
CHANGE
(%Change) |
Day High |
Volume
(% DAV)
(% 50 day avg vol) |
52 Wk Hi
% From Hi |
Featured
Date |
Price
Featured |
Pivot Featured |
|
Max Buy |
AVG
-
NYSE
A V G Technologies N.V.
INTERNET - Internet Software and Services
|
$22.14
|
-1.25
-5.34% |
$23.76
|
986,378
123.61% of 50 DAV
50 DAV is 798,000
|
$26.56
-16.63%
|
9/13/2013
|
$23.06
|
PP = $23.88
|
|
MB = $25.07
|
 Most Recent Note - 10/25/2013 3:05:22 PM
G - Slumping further below its 50 DMA line with higher volume behind today's damaging loss. A rebound above its 50 DMA line is needed for its outlook to improve.
>>> FEATURED STOCK ARTICLE : Valid Secondary Buy Point After Resilient at 10-Week Moving Average - 10/21/2013
View all notes |
Set NEW NOTE alert |
CANSLIM.net Company Profile |
SEC
News |
Chart |
Request a new note
C
A N
S L
I M


|
BITA
-
NYSE
Bitauto Hldgs Ltd Ads
INTERNET - Internet Information Providers
|
$24.23
|
-1.61
-6.23% |
$25.91
|
3,061,295
425.65% of 50 DAV
50 DAV is 719,200
|
$28.48
-14.92%
|
9/24/2013
|
$16.40
|
PP = $17.31
|
|
MB = $18.18
|
Most Recent Note - 10/25/2013 2:54:57 PM
G - Down considerably with heavy volume today yet rebounding from the session's deeper lows. A finish in the upper third of its intra-day range would be a reassuring sign it is attracting prompt and solid support. Recently noted - "It may go on to produce more climactic gains, however it is very extended from its prior base. Prior highs in the $18 area define initial support to watch on pullbacks."
>>> FEATURED STOCK ARTICLE : Volume-Driven Gains Cleared Latest Pivot Point - 10/2/2013
View all notes |
Set NEW NOTE alert |
CANSLIM.net Company Profile |
SEC
News |
Chart |
Request a new note
C
A N
S L
I M
|
BLOX
-
NYSE
Infoblox Inc
COMPUTER HARDWARE - Networking and Communication Dev
|
$44.80
|
-0.88
-1.93% |
$46.45
|
650,313
81.74% of 50 DAV
50 DAV is 795,600
|
$48.97
-8.51%
|
10/11/2013
|
$43.02
|
PP = $45.60
|
|
MB = $47.88
|
Most Recent Note - 10/23/2013 12:01:47 PM
Y - Abruptly retreating from its new 52-week high with today's considerable loss. Prior highs in the $45 area define initial support to watch. Disciplined investors avoid chasing "extended" stocks and limit losses by selling any stock that falls more than -7% from their purchase price.
>>> FEATURED STOCK ARTICLE : Finished Another Week Higher With Volume Behind Gains - 10/11/2013
View all notes |
Set NEW NOTE alert |
CANSLIM.net Company Profile |
SEC
News |
Chart |
Request a new note
C
A N
S L
I M
|
CELG
-
NASDAQ
Celgene Corp
DRUGS - Drug Manufacturers - Major
|
$155.74
|
-2.22
-1.41% |
$159.29
|
3,225,235
121.49% of 50 DAV
50 DAV is 2,654,700
|
$161.64
-3.65%
|
9/12/2013
|
$149.50
|
PP = $150.02
|
|
MB = $157.52
|
Most Recent Note - 10/24/2013 5:35:24 PM
G - Encountered distributional pressure today yet remains perched near all-time highs. The recent low ($143.13 on 10/09/13) defines important near-term support where a subsequent violation may trigger a more worrisome technical sell signal.
>>> FEATURED STOCK ARTICLE : Volume-Driven Gain Challenging New Pivot Point - 9/20/2013
View all notes |
Set NEW NOTE alert |
CANSLIM.net Company Profile |
SEC
News |
Chart |
Request a new note
C
A N
S L
I M
|
EGBN
-
NASDAQ
Eagle Bancorp Inc
BANKING - Regional - Mid-Atlantic Banks
|
$27.49
|
-0.16
-0.58% |
$27.91
|
48,771
68.12% of 50 DAV
50 DAV is 71,600
|
$29.92
-8.12%
|
9/16/2013
|
$27.48
|
PP = $27.77
|
|
MB = $29.16
|
Most Recent Note - 10/23/2013 6:10:21 PM
G - Color code is changed to green after fundamental and technical deterioration has raised concerns. See the latest FSU analysis for more details and new annotated daily and weekly graphs. Recent lows and its 50 DMA line define near-term support.
>>> FEATURED STOCK ARTICLE : Fundamental and Technical Deterioration Raising Concerns - 10/23/2013
View all notes |
Set NEW NOTE alert |
CANSLIM.net Company Profile |
SEC
News |
Chart |
Request a new note
C
A N
S L
I M
|
Symbol/Exchange
Company Name
Industry Group |
PRICE |
CHANGE
(%Change) |
Day High |
Volume
(% DAV)
(% 50 day avg vol) |
52 Wk Hi
% From Hi |
Featured
Date |
Price
Featured |
Pivot Featured |
|
Max Buy |
EGOV
-
NASDAQ
N I C Inc
INTERNET - Internet Software and Services
|
$24.90
|
-0.26
-1.03% |
$25.45
|
205,743
69.46% of 50 DAV
50 DAV is 296,200
|
$25.99
-4.19%
|
10/18/2013
|
$25.17
|
PP = $23.66
|
|
MB = $24.84
|
Most Recent Note - 10/21/2013 6:40:54 PM
Y - Hit another new high today then reversed to close in the red, finishing near the session low with a loss on above average volume. See the latest FSU analysis for an annotated weekly graph. Volume was more than 3 times average behind the technical breakout from a "double bottom" base on the prior session.
>>> FEATURED STOCK ARTICLE : Technical Breakout From "Double Bottom" Base on 3 Times Average Volume - 10/18/2013
View all notes |
Set NEW NOTE alert |
CANSLIM.net Company Profile |
SEC
News |
Chart |
Request a new note
C
A N
S L
I M
|
FLT
-
NYSE
Fleetcor Technologies
DIVERSIFIED SERVICES - Business/Management Services
|
$109.58
|
-0.83
-0.75% |
$111.71
|
1,045,593
145.04% of 50 DAV
50 DAV is 720,900
|
$114.16
-4.01%
|
8/19/2013
|
$99.01
|
PP = $100.97
|
|
MB = $106.02
|
Most Recent Note - 10/23/2013 6:01:03 PM
G - Perched at its all-time high, extended from any sound base. Found prompt support near its 50 DMA line that helped its outlook after enduring distributional pressure.
>>> FEATURED STOCK ARTICLE : Extended After 13 Weekly Gains in Span of 14 Weeks - 10/7/2013
View all notes |
Set NEW NOTE alert |
CANSLIM.net Company Profile |
SEC
News |
Chart |
Request a new note
C
A N
S L
I M
|
GNRC
-
NYSE
Generac Hldgs Inc
CONSUMER DURABLES - Electronic Equipment
|
$50.44
|
+3.00
6.32% |
$52.32
|
3,027,091
406.92% of 50 DAV
50 DAV is 743,900
|
$48.50
4.00%
|
10/24/2013
|
$47.46
|
PP = $44.24
|
|
MB = $46.45
|
Most Recent Note - 10/25/2013 12:35:39 PM
G - Color code is changed to green after quickly getting very extended from its latest base. It was highlighted in yellow with new pivot point cited based on its 9/25/13 high in the prior mid-day report (read here) as a considerable "breakaway gap" triggered a technical buy signal after it gapped up from its 50 DMA line. Reported earnings +36% on +21% sales revenues for the Sep '13 quarter, continuing its strong earnings increases satisfying the C criteria.
>>> FEATURED STOCK ARTICLE : Pullback Following Friday's Technical Buy Signal - 9/23/2013
View all notes |
Set NEW NOTE alert |
CANSLIM.net Company Profile |
SEC
News |
Chart |
Request a new note
C
A N
S L
I M
|
JAZZ
-
NASDAQ
Jazz Pharmaceuticals Plc
DRUGS - Biotechnology
|
$92.70
|
-1.83
-1.94% |
$95.19
|
496,166
70.47% of 50 DAV
50 DAV is 704,100
|
$95.24
-2.67%
|
9/30/2013
|
$93.20
|
PP = $89.10
|
|
MB = $93.56
|
Most Recent Note - 10/24/2013 5:48:33 PM
G- Rallied to a new 52-week high today with its 7th consecutive gain, and its color code is changed to green after rising above its "max buy" level.
>>> FEATURED STOCK ARTICLE : Strong Finish With High Volume Indicative of Accumulation - 9/30/2013
View all notes |
Set NEW NOTE alert |
CANSLIM.net Company Profile |
SEC
News |
Chart |
Request a new note
C
A N
S L
I M
|
KORS
-
NYSE
Michael Kors Hldgs Ltd
RETAIL - Apparel Stores
|
$76.24
|
-0.70
-0.91% |
$77.77
|
1,920,416
63.58% of 50 DAV
50 DAV is 3,020,300
|
$78.83
-3.29%
|
8/6/2013
|
$69.66
|
PP = $66.28
|
|
MB = $69.59
|
Most Recent Note - 10/24/2013 5:37:01 PM
G - Pulling back on lighter volume after rallying to a new high with above average volume on 10/22/13. Recent low ($70.59 on 10/09/13) defines the next important near-term support area above prior highs in the $66 area.
>>> FEATURED STOCK ARTICLE : Extended From Base After Additional Volume-Driven Gains - 9/27/2013
View all notes |
Set NEW NOTE alert |
CANSLIM.net Company Profile |
SEC
News |
Chart |
Request a new note
C
A N
S L
I M
|
Symbol/Exchange
Company Name
Industry Group |
PRICE |
CHANGE
(%Change) |
Day High |
Volume
(% DAV)
(% 50 day avg vol) |
52 Wk Hi
% From Hi |
Featured
Date |
Price
Featured |
Pivot Featured |
|
Max Buy |
LOPE
-
NASDAQ
Grand Canyon Education
DIVERSIFIED SERVICES - Education and; Training Services
|
$44.04
|
-0.16
-0.36% |
$44.60
|
292,260
90.01% of 50 DAV
50 DAV is 324,700
|
$44.62
-1.30%
|
6/19/2013
|
$31.47
|
PP = $34.17
|
|
MB = $35.88
|
Most Recent Note - 10/23/2013 5:56:30 PM
G - Volume-driven gain today for another new all-time high. Fundamental concerns remain while technical action has been reassuring.
>>> FEATURED STOCK ARTICLE : Formed Advanced Base But Fundamental Concerns Remain - 10/14/2013
View all notes |
Set NEW NOTE alert |
CANSLIM.net Company Profile |
SEC
News |
Chart |
Request a new note
C
A N
S L
I M
|
MRLN
-
NASDAQ
Marlin Business Services
DIVERSIFIED SERVICES - Rental and Leasing Services
|
$27.36
|
-0.25
-0.89% |
$28.37
|
20,370
61.91% of 50 DAV
50 DAV is 32,900
|
$27.86
-1.81%
|
9/9/2013
|
$23.75
|
PP = $24.03
|
|
MB = $25.23
|
Most Recent Note - 10/24/2013 5:44:18 PM
G - Hit a new 52-week high today with another gain on light volume. Found support at its 50 DMA line on the last pullback. Subsequent losses below the recent low ($23.25) would trigger a more worrisome technical sell signal.
>>> FEATURED STOCK ARTICLE : Faring Better Than Others While Testing 50-Day Average Line - 10/8/2013
View all notes |
Set NEW NOTE alert |
CANSLIM.net Company Profile |
SEC
News |
Chart |
Request a new note
C
A N
S L
I M
|
NOAH
-
NYSE
Noah Holdings Ltd Ads
FINANCIAL SERVICES - Asset Management
|
$17.93
|
-0.88
-4.68% |
$19.12
|
929,961
124.71% of 50 DAV
50 DAV is 745,700
|
$22.99
-22.01%
|
10/15/2013
|
$19.10
|
PP = $18.33
|
|
MB = $19.25
|
Most Recent Note - 10/25/2013 3:15:19 PM
Y - Pulling back again today and raising concerns while slumping back into its prior base. Disciplined investors always limit losses by selling if any stock falls more than -7% from their purchase price. A "negative reversal" was noted at its 52-week high on 10/18/13.
>>> FEATURED STOCK ARTICLE : Finished Strong With Gain on 4 Times Average Volume - 10/15/2013
View all notes |
Set NEW NOTE alert |
CANSLIM.net Company Profile |
SEC
News |
Chart |
Request a new note
C
A N
S L
I M
|
NQ
-
NYSE
Nq Mobile Inc Ads
COMPUTER SOFTWARE and SERVICES - Application Software
|
$10.63
|
-1.46
-12.08% |
$13.38
|
31,695,817
756.61% of 50 DAV
50 DAV is 4,189,200
|
$25.90
-58.96%
|
10/22/2013
|
$23.31
|
PP = $26.00
|
|
MB = $27.30
|
Most Recent Note - 10/25/2013 3:11:49 PM
It will be dropped from the Featured Stocks list tonight. Down again today following an extended trading halt. This example may serve as a very vivid reminder to always make disciplined buy and sell decisions. Its shares were severely punished as technical damage mounted after questions were raised by analysts concerning its accounting practices. NQ did not trigger a technical buy signal after recently featured while forming an advanced "ascending base" type pattern. Furthermore, members were reminded, "As always, disciplined investors sell any stock that falls more than -7% from their purchase price, and that discipline is more important when dealing with advanced bases."
>>> FEATURED STOCK ARTICLE : Pullbacks Give Look of Advanced Ascending Base Pattern - 10/22/2013
View all notes |
Set NEW NOTE alert |
CANSLIM.net Company Profile |
SEC
News |
Chart |
Request a new note
C
A N
S L
I M
|
OII
-
NYSE
Oceaneering Intl Inc
ENERGY - Oil and Gas Drilling and Explorati
|
$83.69
|
+0.49
0.59% |
$83.70
|
483,836
76.56% of 50 DAV
50 DAV is 632,000
|
$87.64
-4.51%
|
10/16/2013
|
$83.08
|
PP = $84.74
|
|
MB = $88.98
|
Most Recent Note - 10/23/2013 6:15:29 PM
Y - Gapped down today and slumped back under its pivot point, closing back in the prior base and raising concerns. Prior highs in the $84 area define initial support to watch on pullbacks.
>>> FEATURED STOCK ARTICLE : Forming Set-Up Above 50-Day Moving Average Line - 10/16/2013
View all notes |
Set NEW NOTE alert |
CANSLIM.net Company Profile |
SEC
News |
Chart |
Request a new note
C
A N
S L
I M
|
Symbol/Exchange
Company Name
Industry Group |
PRICE |
CHANGE
(%Change) |
Day High |
Volume
(% DAV)
(% 50 day avg vol) |
52 Wk Hi
% From Hi |
Featured
Date |
Price
Featured |
Pivot Featured |
|
Max Buy |
PCLN
-
NASDAQ
Priceline.Com Inc
INTERNET - Internet Software and Services
|
$1,070.85
|
-9.55
-0.88% |
$1,088.66
|
575,489
105.42% of 50 DAV
50 DAV is 545,900
|
$1,098.70
-2.53%
|
9/13/2013
|
$966.82
|
PP = $995.08
|
|
MB = $1,044.83
|
Most Recent Note - 10/22/2013 12:51:42 PM
G - It is extended from any sound base. Found support near its 50 DMA line after enduring damaging distributional losses.
>>> FEATURED STOCK ARTICLE : Wedging to New Highs With Gains Lacking Volume Conviction - 9/19/2013
View all notes |
Set NEW NOTE alert |
CANSLIM.net Company Profile |
SEC
News |
Chart |
Request a new note
C
A N
S L
I M
|
PRAA
-
NASDAQ
Portfolio Recovery Assoc
DIVERSIFIED SERVICES - Business/Management Services
|
$61.17
|
-0.48
-0.78% |
$61.77
|
202,695
50.67% of 50 DAV
50 DAV is 400,000
|
$62.40
-1.97%
|
10/17/2013
|
$60.75
|
PP = $61.70
|
|
MB = $64.79
|
Most Recent Note - 10/18/2013 5:16:37 PM
Y - Wedged to a new 52-week high with today's 3rd consecutive gain lacking great volume conviction. Pivot point cited was based on its 9/26/13 high plus 10 cents after forming an advanced "3-weeks tight" base. Subsequent volume-driven gains may clinch a proper new (or add-on) technical buy signal.
>>> FEATURED STOCK ARTICLE : Wedging to New Highs With Gains Lacking Volume Conviction - 9/26/2013
View all notes |
Set NEW NOTE alert |
CANSLIM.net Company Profile |
SEC
News |
Chart |
Request a new note
C
A N
S L
I M
|
PRLB
-
NYSE
Proto Labs Inc
MANUFACTURING - Small Tools and Accessories
|
$86.16
|
-1.94
-2.20% |
$88.63
|
190,707
55.88% of 50 DAV
50 DAV is 341,300
|
$88.15
-2.26%
|
7/29/2013
|
$64.86
|
PP = $67.50
|
|
MB = $70.88
|
Most Recent Note - 10/24/2013 5:49:34 PM
G - Hit another new 52-week high today, getting more extended from a sound base. Steadily rallying since finding prompt support at its 50 DMA line.
>>> FEATURED STOCK ARTICLE : Extended Following Additional Volume-Driven Gains - 9/25/2013
View all notes |
Set NEW NOTE alert |
CANSLIM.net Company Profile |
SEC
News |
Chart |
Request a new note
C
A N
S L
I M
|
SFUN
-
NYSE
Soufun Hldgs Ltd Ads A
INTERNET - Internet Information Providers
|
$50.03
|
-3.23
-6.06% |
$54.50
|
2,115,650
152.51% of 50 DAV
50 DAV is 1,387,200
|
$59.50
-15.92%
|
10/17/2013
|
$58.02
|
PP = $53.87
|
|
MB = $56.56
|
Most Recent Note - 10/25/2013 2:59:26 PM
Y - Undercutting prior highs in the $53 area, slumping into its prior base and raising concerns while down considerably with heavy and ever-increasing volume behind today's 5th consecutive loss. Its 50 DMA line ($47.79 now) defines important near-term support to watch.
>>> FEATURED STOCK ARTICLE : Following Great Rally No New Base Has Been Formed - 10/1/2013
View all notes |
Set NEW NOTE alert |
CANSLIM.net Company Profile |
SEC
News |
Chart |
Request a new note
C
A N
S L
I M
|
SSNC
-
NASDAQ
S S & C Technologies
COMPUTER SOFTWARE and SERVICES - Application Software
|
$39.06
|
-0.05
-0.13% |
$39.47
|
159,844
39.34% of 50 DAV
50 DAV is 406,300
|
$39.94
-2.20%
|
10/22/2013
|
$39.17
|
PP = $40.04
|
|
MB = $42.04
|
Most Recent Note - 10/22/2013 7:37:42 PM
Y - New pivot point is cited based on its 9/18/13 high plus 10 cents and its color code is changed to yellow. Subsequent volume-driven gains above the pivot point may trigger a new (or add-on) technical buy signal. Perched near its 52-week high after 5 consecutive gains on light volume. Completed a Secondary Offering on 9/20/13 while perched at all-time highs.
>>> FEATURED STOCK ARTICLE : Finding Support Near 50-Day Average After Secondary Offering - 10/4/2013
View all notes |
Set NEW NOTE alert |
CANSLIM.net Company Profile |
SEC
News |
Chart |
Request a new note
C
A N
S L
I M
|
Symbol/Exchange
Company Name
Industry Group |
PRICE |
CHANGE
(%Change) |
Day High |
Volume
(% DAV)
(% 50 day avg vol) |
52 Wk Hi
% From Hi |
Featured
Date |
Price
Featured |
Pivot Featured |
|
Max Buy |
SSYS
-
NASDAQ
Stratasys Ltd
COMPUTER HARDWARE - Computer Peripherals
|
$108.01
|
-1.80
-1.64% |
$110.49
|
383,659
33.71% of 50 DAV
50 DAV is 1,138,000
|
$113.49
-4.83%
|
10/11/2013
|
$102.94
|
PP = $105.38
|
|
MB = $110.65
|
Most Recent Note - 10/22/2013 7:42:13 PM
Y - Recently paused near its "max buy" level after rallying from a "double bottom" base with gains backed by above average but not especially strong volume. Gains must have at least +40% above average volume to trigger a proper technical buy signal, so confirming gains with higher volume would be a welcome reassurance in the days to come.
>>> FEATURED STOCK ARTICLE : Faltering and Relative Strength Waning After Offering - 10/9/2013
View all notes |
Set NEW NOTE alert |
CANSLIM.net Company Profile |
SEC
News |
Chart |
Request a new note
C
A N
S L
I M
|
STMP
-
NASDAQ
Stamps.Com Inc
INTERNET - Internet Software and Services
|
$47.27
|
-0.56
-1.17% |
$49.40
|
252,827
236.73% of 50 DAV
50 DAV is 106,800
|
$48.13
-1.79%
|
9/24/2013
|
$45.54
|
PP = $46.57
|
|
MB = $48.90
|
Most Recent Note - 10/25/2013 12:59:04 PM
G - Hit another new 52-week high today then reversed into the red. Gapped up and touched a new 52-week high on the prior session, promptly repairing another brief 50 DMA line violation. Fundamental concerns were raised by waning sales revenues and earnings increases. Reported earnings +24% on +7% sales revenues for the Sep '13 quarter, just below the +25% minimum earnings guideline (C criteria).
>>> FEATURED STOCK ARTICLE : Forming New Set-Up After 50-Day Average Acted as Support - 9/24/2013
View all notes |
Set NEW NOTE alert |
CANSLIM.net Company Profile |
SEC
News |
Chart |
Request a new note
C
A N
S L
I M
|
TBBK
-
NASDAQ
Bancorp Inc
BANKING - Regional - Mid-Atlantic Banks
|
$16.93
|
-1.61
-8.68% |
$18.35
|
938,255
512.43% of 50 DAV
50 DAV is 183,100
|
$19.14
-11.55%
|
9/4/2013
|
$16.26
|
PP = $16.79
|
|
MB = $17.63
|
Most Recent Note - 10/25/2013 1:01:38 PM
G - Reported earnings +18% for the Sep '13 quarter, below the +25% minimum guideline (C criteria) for buy candidates raising concerns. Violated recent lows in the $17.25 area and its 50 DMA line with today's damaging volume-driven loss, yet it has recovered from early lows.
>>> FEATURED STOCK ARTICLE : Encountering Distributional Pressure While Consolidating Above Prior Highs - 10/3/2013
View all notes |
Set NEW NOTE alert |
CANSLIM.net Company Profile |
SEC
News |
Chart |
Request a new note
C
A N
S L
I M
|
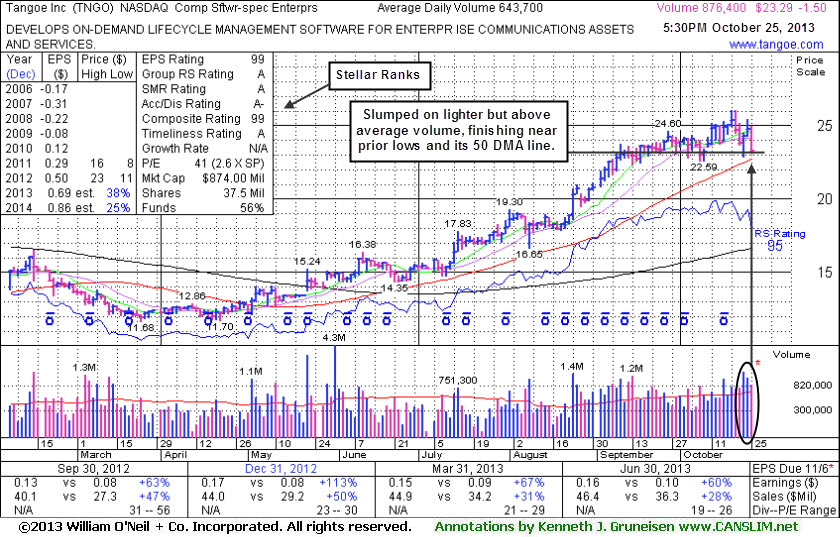
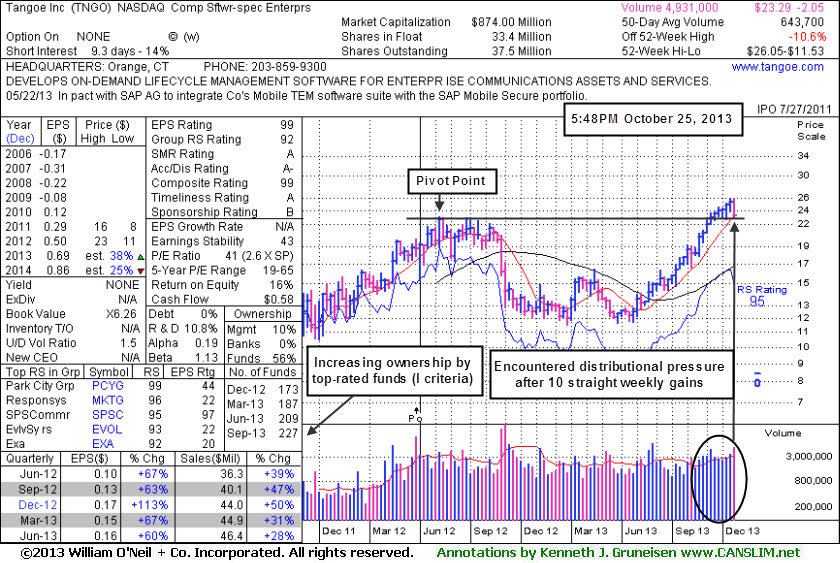
TNGO
-
NASDAQ
Tangoe Inc
COMPUTER SOFTWARE and SERVICES - Technical and System Software
|
$23.29
|
-1.50
-6.05% |
$25.00
|
880,284
136.75% of 50 DAV
50 DAV is 643,700
|
$26.05
-10.60%
|
9/12/2013
|
$21.30
|
PP = $23.15
|
|
MB = $24.31
|
Most Recent Note - 10/25/2013 3:03:36 PM
Y - Color code is changed to yellow while pulling back below its "max buy" level on lighter volume following recent gains with above average volume. Prior lows and its 50 DMA line define important near-term support in the $22.50 area where violations would raise serious concerns.
>>> FEATURED STOCK ARTICLE : Impressive Weekly Winning Streak Ends - 10/25/2013
View all notes |
Set NEW NOTE alert |
CANSLIM.net Company Profile |
SEC
News |
Chart |
Request a new note
C
A N
S L
I M
|
ULTI
-
NASDAQ
Ultimate Software Group
INTERNET - Internet Software and Services
|
$152.87
|
+0.07
0.05% |
$153.61
|
130,995
99.54% of 50 DAV
50 DAV is 131,600
|
$153.20
-0.22%
|
10/16/2013
|
$142.95
|
PP = $151.18
|
|
MB = $158.74
|
Most Recent Note - 10/24/2013 5:52:29 PM
Y - Hit a new 52-week high today with a gain on light volume. Subsequent volume-driven gains above the pivot point may clinch a proper technical buy signal.
>>> FEATURED STOCK ARTICLE : Hovering Less Than -5% From 52-Week High - 10/17/2013
View all notes |
Set NEW NOTE alert |
CANSLIM.net Company Profile |
SEC
News |
Chart |
Request a new note
C
A N
S L
I M
|
Symbol/Exchange
Company Name
Industry Group |
PRICE |
CHANGE
(%Change) |
Day High |
Volume
(% DAV)
(% 50 day avg vol) |
52 Wk Hi
% From Hi |
Featured
Date |
Price
Featured |
Pivot Featured |
|
Max Buy |
VRX
-
NYSE
Valeant Pharmaceuticals
DRUGS - Drug Manufacturers - Other
|
$112.57
|
-1.72
-1.50% |
$114.83
|
801,358
73.17% of 50 DAV
50 DAV is 1,095,200
|
$115.40
-2.45%
|
9/11/2013
|
$100.26
|
PP = $105.50
|
|
MB = $110.78
|
Most Recent Note - 10/24/2013 5:39:24 PM
G- Hovering near all-time highs, extended from any sound base. Found support above prior highs defining important support in the $105 area.
>>> FEATURED STOCK ARTICLE : Found Support Above Prior Highs on Pullback - 10/10/2013
View all notes |
Set NEW NOTE alert |
CANSLIM.net Company Profile |
SEC
News |
Chart |
Request a new note
C
A N
S L
I M
|
YNDX
-
NASDAQ
Yandex N V Class A
INTERNET - Internet Information Providers
|
$38.19
|
-2.60
-6.37% |
$40.84
|
3,575,466
140.34% of 50 DAV
50 DAV is 2,547,700
|
$42.00
-9.07%
|
9/5/2013
|
$34.24
|
PP = $34.79
|
|
MB = $36.53
|
Most Recent Note - 10/25/2013 3:01:29 PM
G - Down considerably today, retreating abruptly from new 52-week highs hit earlier this week. It is extended from any sound base. Found prompt support above prior highs in the $34 area and its 50 DMA line.
>>> FEATURED STOCK ARTICLE : Gains Lacked Volume Conviction While Hitting New Highs - 9/18/2013
View all notes |
Set NEW NOTE alert |
CANSLIM.net Company Profile |
SEC
News |
Chart |
Request a new note
C
A N
S L
I M
|