You are not logged in.
This means you
CAN ONLY VIEW reports that were published prior to Monday, April 14, 2025.
You
MUST UPGRADE YOUR MEMBERSHIP if you want to see any current reports.
AFTER MARKET UPDATE - THURSDAY, OCTOBER 24TH, 2013
Previous After Market Report Next After Market Report >>>
|
|
|
|
DOW |
+95.88 |
15,509.21 |
+0.62% |
|
Volume |
715,775,020 |
+1% |
|
Volume |
1,927,987,100 |
+6% |
|
NASDAQ |
+21.89 |
3,928.96 |
+0.56% |
|
Advancers |
1,751 |
56% |
|
Advancers |
1,577 |
60% |
|
S&P 500 |
+5.69 |
1,752.07 |
+0.33% |
|
Decliners |
1,276 |
41% |
|
Decliners |
963 |
36% |
|
Russell 2000 |
+7.91 |
1,118.84 |
+0.71% |
|
52 Wk Highs |
211 |
|
|
52 Wk Highs |
229 |
|
|
S&P 600 |
+4.20 |
636.28 |
+0.66% |
|
52 Wk Lows |
9 |
|
|
52 Wk Lows |
16 |
|
|
 |
Major Averages Rose With Better Volume and Breadth 3-2 Positive
Kenneth J. Gruneisen - Passed the CAN SLIM® Master's Exam
On Thursday the major averages spent the session trading in positive territory following a batch of encouraging earnings releases. Behind the gains the volume totals were reported higher on the NYSE and on the Nasdaq exchange. Breadth was positive as advancers led decliners by about a 3-2 margin on the NYSE and on the Nasdaq exchange. There were 72 high-ranked companies from the CANSLIM.net Leaders List that made new 52-week highs and appeared on the CANSLIM.net BreakOuts Page, up from 42 stocks on the prior session. The list of stocks hitting new 52-week highs outnumbered new lows on the NYSE and on the Nasdaq exchange. There were gains for 17 of the 27 high-ranked companies currently included on the Featured Stocks Page, a list that has recently been expanding.
Homebuilder Pulte Group Inc (PHM +7.01%) rose after quarterly results topped estimates. Ford Motor Co (F +1.37%) was higher and 3M Co (MMM +0.24%) inched higher after both posted earnings above consensus. The Dow Chemical Co(DOW -1.02% ) fell as revenues trailed estimates. Symantec Corp (SYMC -12.71%) plunged after lowering its sales forecast. Consumer discretionary was among the top performing groups as shares of McKesson (MCK +4.86%) rose after agreeing to acquire Germany's Celesio for $5.4 billion. Noble Energy (NBL +4.4%) rallied after upbeat earnings. Telecom was down the most on the session as AT&T Inc (T -1.84%) slumped.
One company recently added to the Featured Stocks list provided members a vivid reminder to always make disciplined buy and sell decisions. Nq Mobile Inc Ads (NQ -47.16%) shares were severely punished after technical damage mounted after questions were raised by analysts concerning its accounting practices. NQ did not trigger a technical buy signal since recently featured while forming an advanced "ascending base" type pattern. Furthermore, members were reminded, "As always, disciplined investors sell any stock that falls more than -7% from their purchase price, and that discipline is more important when dealing with advanced bases."
A better-than-expected preliminary report on Chinese manufacturing suggested manufacturing activity increased in October. On the U.S. economic front, weekly jobless claims fell 12,000 to 350,000 versus the consensus projection of 340,000. Another release showed the trade deficit widened slightly in August. Treasuries declined with the 10-year note down 3/32 to yield 2.51%.
The market (M criteria) has established a confirmed uptrend. Disciplined investors might watch for opportunities to make proper new buying efforts. The CANSLIM.net Featured Stocks Page shows the most action-worthy candidates and their latest notes and a new Headline Link directs members to the latest detailed analysis with data-packed graphs annotated by a Certified expert along with links to additional resources. The Premium Member Homepage - includes "dynamic archives" to all prior pay reports published. Watch for an announcement via email concerning the next WEBCAST.
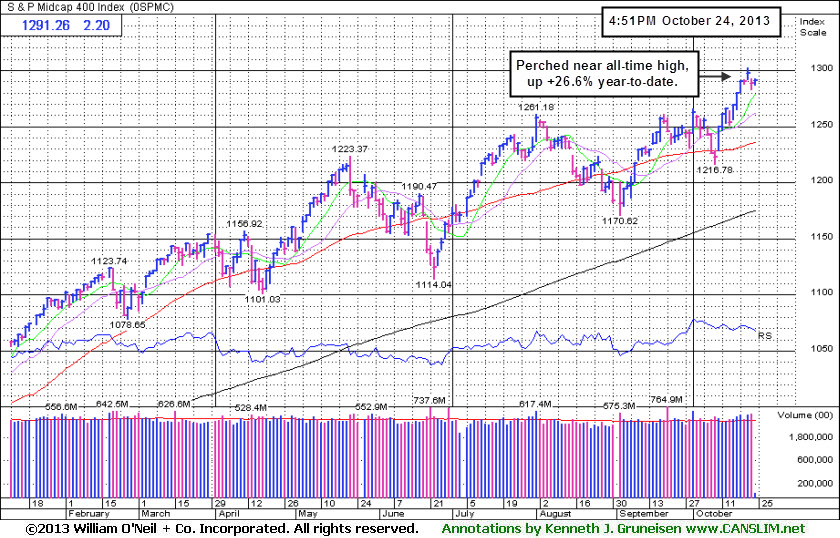
PICTURED: The S&P 400 Mid-Cap Index is perched near its all-time high, up +26.6% year-to-date.
|
 Kenneth J. Gruneisen started out as a licensed stockbroker in August 1987, a couple of months prior to the historic stock market crash that took the Dow Jones Industrial Average down -22.6% in a single day. He has published daily fact-based fundamental and technical analysis on high-ranked stocks online for two decades. Through FACTBASEDINVESTING.COM, Kenneth provides educational articles, news, market commentary, and other information regarding proven investment systems that work in good times and bad.
Comments contained in the body of this report are technical opinions only and are not necessarily those of Gruneisen Growth Corp. The material herein has been obtained from sources believed to be reliable and accurate, however, its accuracy and completeness cannot be guaranteed. Our firm, employees, and customers may effect transactions, including transactions contrary to any recommendation herein, or have positions in the securities mentioned herein or options with respect thereto. Any recommendation contained in this report may not be suitable for all investors and it is not to be deemed an offer or solicitation on our part with respect to the purchase or sale of any securities. |
|
 |
Gold & Silver, Retail, Semiconductor and Biotechs Led Group Gainers
Kenneth J. Gruneisen - Passed the CAN SLIM® Master's Exam
The Retail Index ($RLX +0.95%) posted a gain and was a positive influence on the major averages. Defensive groups were mixed as the Gold & Silver Index ($XAU +3.87%) bounced while the Healthcare Index ($HMO -1.57%) slumped. Energy-related shares were also mixed as the Oil Services Index ($OSX -1.00%) fell while the Integrated Oil Index ($XOI +0.71%) edged higher. The Broker/Dealer Index ($XBD +0.58%) helped with a modest gain while the Bank Index ($BKX -0.03%) finished flat. The Semiconductor Index ($SOX +0.82%) and Biotechnology Index ($BTK +1.16%) each posted a solid gain but the Internet Index ($IIX -0.08%) edged lower.
Charts courtesy www.stockcharts.com
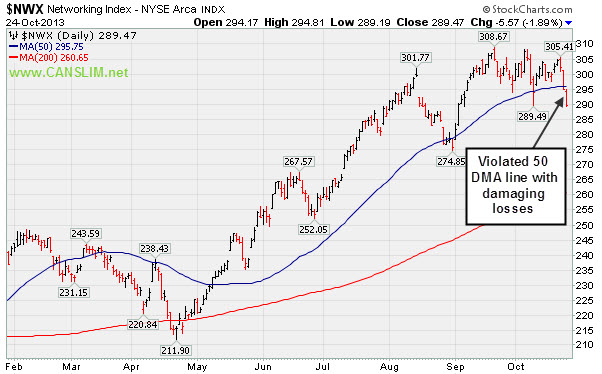
PICTURED: The Networking Index ($NWX -1.89%) violated its 50-day moving average (DMA) line with damaging losses.
| Oil Services |
$OSX |
280.58 |
-2.82 |
-1.00% |
+27.44% |
| Healthcare |
$HMO |
3,442.83 |
-54.86 |
-1.57% |
+36.94% |
| Integrated Oil |
$XOI |
1,455.41 |
+10.30 |
+0.71% |
+17.20% |
| Semiconductor |
$SOX |
494.15 |
+4.04 |
+0.82% |
+28.66% |
| Networking |
$NWX |
289.47 |
-5.57 |
-1.89% |
+27.77% |
| Internet |
$IIX |
426.32 |
-0.34 |
-0.08% |
+30.37% |
| Broker/Dealer |
$XBD |
141.55 |
+0.82 |
+0.58% |
+50.06% |
| Retail |
$RLX |
875.20 |
+8.23 |
+0.95% |
+34.02% |
| Gold & Silver |
$XAU |
99.04 |
+3.69 |
+3.87% |
-40.19% |
| Bank |
$BKX |
64.66 |
-0.02 |
-0.03% |
+26.09% |
| Biotech |
$BTK |
2,204.61 |
+25.25 |
+1.16% |
+42.51% |
|
|
|
 |
|
|
|
Color Codes Explained :
Y - Better candidates highlighted by our
staff of experts.
G - Previously featured
in past reports as yellow but may no longer be buyable under the
guidelines.
***Last / Change / Volume data in this table is the closing quote data***
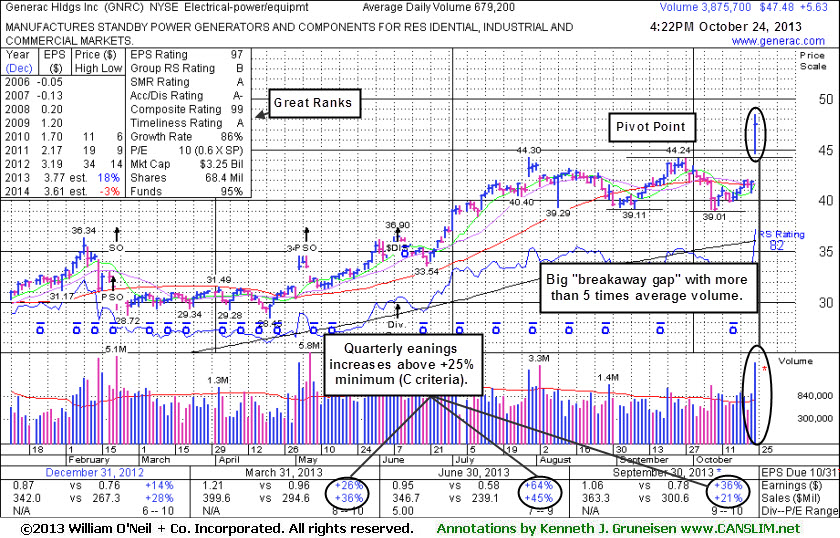
Generac Hldgs Inc (GNRC +$5.59 or +13.36% to $47.44) was highlighted in yellow n the earlier mid-day report (read here) with new pivot point cited based on its 9/25/13 high. Reported earnings +36% on +21% sales revenues for the Sep '13 quarter, continuing its strong earnings increases satisfying the C criteria. It found support near prior lows while forming a "double bottom" base as it slumped below its 50-day moving average (DMA) while consolidating. Today's considerable "breakaway gap" with more than 5 times average volume triggered a new (or add-on) technical buy signal as it gapped up from its 50 DMA line.
The high-ranked Electrical - Power/Equipment firm was last shown in this FSU section with an annotated graph on 9/23/13 under the headline, "Pullback Following Friday's Technical Buy Signal", pulling back with lighter but still above average volume.
Disciplined investors know that a "breakaway gap" has been noted as the one exception where the fact-based system allows chasing a stock more than +5% above their prior high ot pivot point. As always, limit losses by selling if any stock falls more than -7% from the purchase price.
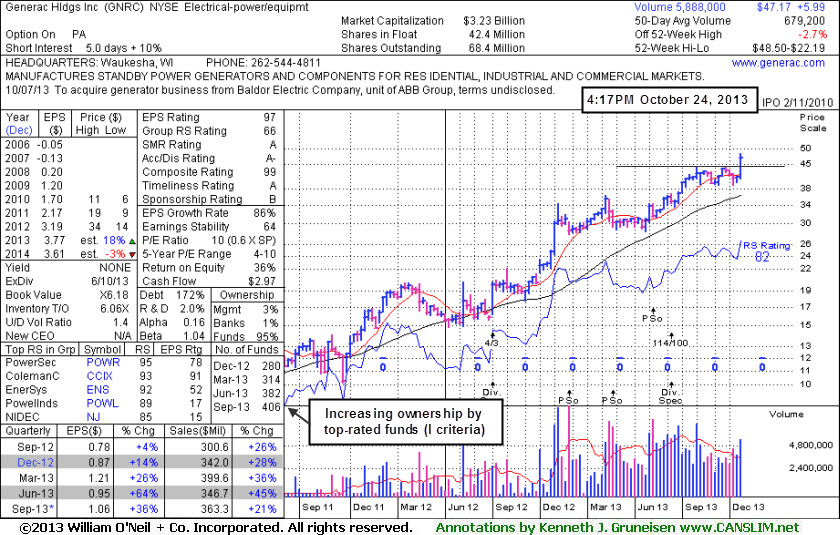
The number of top-rated funds owning its shares rose from 280 in Dec '12 to 379 in Jun '13, an encouraging sign concerning the I criteria. Its current Up/Down Volume Ratio of 1.4 is also an unbiased indication that it shares have been under accumulation over the past 50 days.
|
|
|
THESE ARE NOT BUY RECOMMENDATIONS!
Comments contained in the body of this report are technical
opinions only. The material herein has been obtained
from sources believed to be reliable and accurate, however,
its accuracy and completeness cannot be guaranteed.
This site is not an investment advisor, hence it does
not endorse or recommend any securities or other investments.
Any recommendation contained in this report may not
be suitable for all investors and it is not to be deemed
an offer or solicitation on our part with respect to
the purchase or sale of any securities. All trademarks,
service marks and trade names appearing in this report
are the property of their respective owners, and are
likewise used for identification purposes only.
This report is a service available
only to active Paid Premium Members.
You may opt-out of receiving report notifications
at any time. Questions or comments may be submitted
by writing to Premium Membership Services 665 S.E. 10 Street, Suite 201 Deerfield Beach, FL 33441-5634 or by calling 1-800-965-8307
or 954-785-1121.
|
|
|

