You are not logged in.
This means you
CAN ONLY VIEW reports that were published prior to Monday, April 14, 2025.
You
MUST UPGRADE YOUR MEMBERSHIP if you want to see any current reports.
AFTER MARKET UPDATE - MONDAY, OCTOBER 24TH, 2011
Previous After Market Report Next After Market Report >>>
|
|
|
|
DOW |
+104.83 |
11,913.62 |
+0.89% |
|
Volume |
927,315,610 |
-22% |
|
Volume |
1,834,238,360 |
-6% |
|
NASDAQ |
+61.98 |
2,699.44 |
+2.35% |
|
Advancers |
2,511 |
81% |
|
Advancers |
2,095 |
79% |
|
S&P 500 |
+15.94 |
1,254.19 |
+1.29% |
|
Decliners |
524 |
17% |
|
Decliners |
486 |
18% |
|
Russell 2000 |
+23.61 |
736.03 |
+3.31% |
|
52 Wk Highs |
83 |
|
|
52 Wk Highs |
62 |
|
|
S&P 600 |
+12.91 |
405.90 |
+3.29% |
|
52 Wk Lows |
2 |
|
|
52 Wk Lows |
22 |
|
|
 |
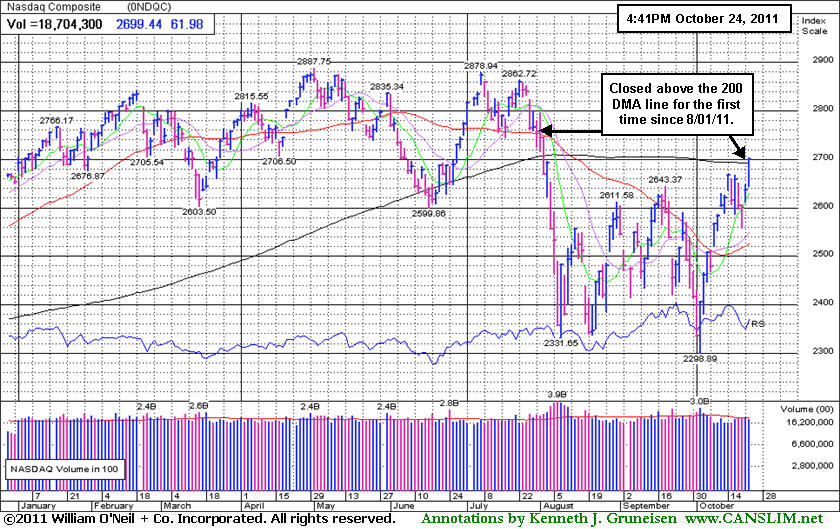
Nasdaq Composite Index Closed Above 200-Day Moving Average
Kenneth J. Gruneisen - Passed the CAN SLIM® Master's Exam
The major averages extended October’s rally on Monday. There were lighter trading volume totals reported on the NYSE and on the Nasdaq exchange versus the prior session, while it is fair to point out that Friday's totals were inflated by options expirations. Advancing issues beat decliners by more than 4-1 on the NYSE and on the Nasdaq exchange. New 52-week highs solidly outnumbered new 52-week lows on the NYSE and on the Nasdaq exchange. There were 58 high-ranked companies from the CANSLIM.net Leaders List that made new 52-week highs and appeared on the CANSLIM.net BreakOuts Page, up sharply again and nearly doubling the prior session total of 30 stocks. There were gains for 8 of the 9 high-ranked companies currently included on the Featured Stocks Page.
Stocks started off strong as they rose on Monday while benefiting from positive corporate earnings, M&A activity, and progress coming from the euro zone. Global markets were largely higher today following indications by German officials that the European bailout fund could top 1 billion Euros or about $1.4 trillion dollars.
Today’s advance by the Dow was led by Caterpillar Inc (CAT +5.01%) as the industrial machinery and equipment maker rallied after reporting third-quarter earnings that beat Wall Street analyst estimates. Branded apparel maker VF Corp (VFC +3.24%) rose after posting a strong increase in earnings from a year earlier.
Equity markets also benefitted from several M&A announcements. HealthSpring (HS +33.7%) jumped after Cigna (CI +1.43%) agreed to acquire the health care provider for approximately $3.8 billion. RightNow Technologies Inc (RNOW +19.41%) surged \after Oracle said it would buy the software maker for $43 a share or $1.5 billion in cash.
The October 2011 issue of our monthly newsletter CANSLIM.net News will be published soon with an informative review of current market conditions, leading groups, and best buy candidates. Via the Premium Member Homepage links to all prior reports and webcasts are always available.
PICTURED: The Nasdaq Composite Index rallied to a close above its 200-day moving average (DMA) line for the first time since August 1, 2011. The tech-heavy index is +11.8% on the month. By comparison, the Dow Jones Indistrial Average has advanced +9.2% in October, and the S&P 500 Index is higher by +10.9% on the month.
|
 Kenneth J. Gruneisen started out as a licensed stockbroker in August 1987, a couple of months prior to the historic stock market crash that took the Dow Jones Industrial Average down -22.6% in a single day. He has published daily fact-based fundamental and technical analysis on high-ranked stocks online for two decades. Through FACTBASEDINVESTING.COM, Kenneth provides educational articles, news, market commentary, and other information regarding proven investment systems that work in good times and bad.
Comments contained in the body of this report are technical opinions only and are not necessarily those of Gruneisen Growth Corp. The material herein has been obtained from sources believed to be reliable and accurate, however, its accuracy and completeness cannot be guaranteed. Our firm, employees, and customers may effect transactions, including transactions contrary to any recommendation herein, or have positions in the securities mentioned herein or options with respect thereto. Any recommendation contained in this report may not be suitable for all investors and it is not to be deemed an offer or solicitation on our part with respect to the purchase or sale of any securities. |
|
 |
Defensive, Tech, and Financial Groups Led Gains
Kenneth J. Gruneisen - Passed the CAN SLIM® Master's Exam
Defensive groups led Monday's widespread gains as the Gold & Silver Index ($XAU +4.34%) and Healthcare Index ($HMO +4.72%) charged higher. The Bank Index ($BKX +2.93%) and Broker/Dealer Index ($XBD +2.65%) had a positive bias that underpinned the major averages' gains. The Networking Index ($NWX +4.05%), Semiconductor Index ($SOX +3.37%), Biotechnology Index ($BTK +2.71%), and Internet Index ($IIX +2.79%) posted unanimous gains, yet the Retail Index ($RLX +1.19%) was not up as meaningfully on the day. The Oil Services Index ($OSX +3.84%) also posted a big gain while the Integrated Oil Index ($XOI +0.48%) lagged.
Charts courtesy www.stockcharts.com
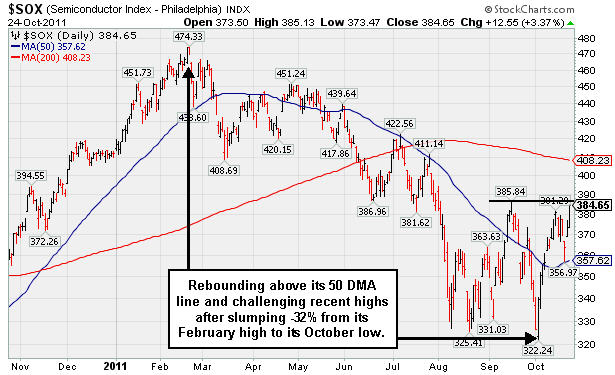
PICTURED: The Semiconductor Index ($SOX +3.37%) is rebounding above its 50-day moving average (DMA) line and challenging recent highs after slumping -32% from its February high to its October low.
| Oil Services |
$OSX |
226.98 |
+8.39 |
+3.84% |
-7.40% |
| Healthcare |
$HMO |
2,073.53 |
+93.42 |
+4.72% |
+22.55% |
| Integrated Oil |
$XOI |
1,211.57 |
+5.75 |
+0.48% |
-0.13% |
| Semiconductor |
$SOX |
384.65 |
+12.55 |
+3.37% |
-6.60% |
| Networking |
$NWX |
235.26 |
+9.15 |
+4.05% |
-16.15% |
| Internet |
$IIX |
300.07 |
+8.15 |
+2.79% |
-2.49% |
| Broker/Dealer |
$XBD |
90.13 |
+2.33 |
+2.65% |
-25.83% |
| Retail |
$RLX |
554.04 |
+6.52 |
+1.19% |
+8.98% |
| Gold & Silver |
$XAU |
192.89 |
+8.02 |
+4.34% |
-14.87% |
| Bank |
$BKX |
40.05 |
+1.14 |
+2.93% |
-23.29% |
| Biotech |
$BTK |
1,187.15 |
+31.32 |
+2.71% |
-8.51% |
|
|
|
 |
New Pivot Point Cited After Healthy Consolidation
Kenneth J. Gruneisen - Passed the CAN SLIM® Master's Exam
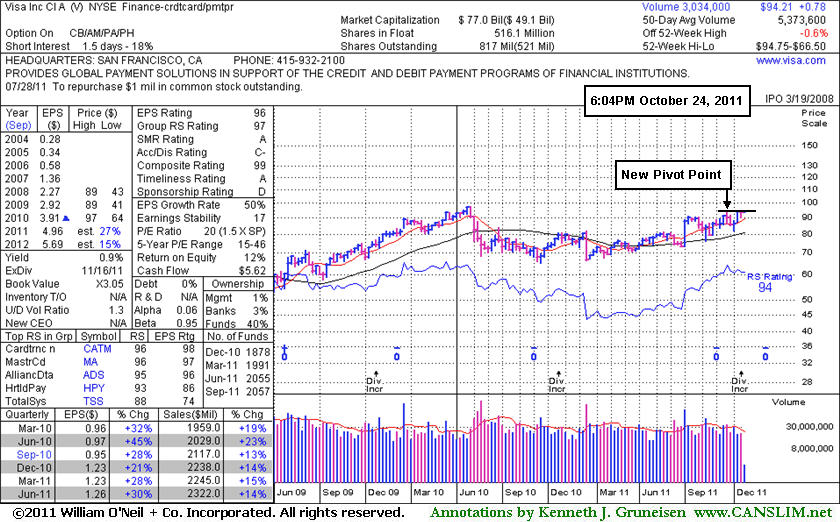
Visa Inc (V +$0.78 or +0.83% to $94.21) posted a 3rd consecutive small gain today with ever-lighter than average volume. A new pivot point is being cited based on its 52-week high plus 10 cents and its color code is changed to yellow while it is now working on the 6th week of a "square box" base pattern. A convincing breakout above the new pivot point with at least +50% above average or greater volume may trigger a new technical buy signal.
Its last appearance in this FSU section was on 10/10/11 with an annotated graph under the headline, "Volume Light Behind Rebound After Recently Failed Breakout". It found impressive support well above its prior chart lows and longer-term 200 DMA line, but likely prompted disciplined investors to sell and follow the system's loss-limiting rule with its sharp pullback. Gains thereafter have lacked great volume conviction while it continued to rebound and approached its 52-week high. Its quarterly and annual earnings history has been strong enough to satisfy the C and A criteria. The number of top-rated funds owning its shares rose from 1,878 in Dec '10 to 2,057 in Sep '11, a reassuring sign concerning the I criteria, however it is already well known by the institutional crowd. Leadership shown by at least one other well-known firm in the Finance - Credit Card Payment Processing firm (L criteria) has been a reassuring sign.
Keep in mind that the M criteria tells us that typically 3 out of 4 stocks move in the same direction of the major averages, and not a lot of examples worked out well in recent weeks while the broader market struggled. After the latest correction, the new rally attempt has produced a reassuring follow-through day coupled with an expansion in leadership (new 52-week highs) which suggests that investors' odds are again more favorable for success.
In a bullish market environment there is no shortage of action-worthy buy candidates, and many of the companies may form multiple sound base patterns throughout an ongoing advance. Disciplined investors always limit losses by selling if ever any stock falls -7% from their purchase price. Otherwise, if leaving the risk un-contained, the damage can become more severe and undisciplined investors must be prepared to suffer the painful consequences.
|
|
|
Color Codes Explained :
Y - Better candidates highlighted by our
staff of experts.
G - Previously featured
in past reports as yellow but may no longer be buyable under the
guidelines.
***Last / Change / Volume data in this table is the closing quote data***
Symbol/Exchange
Company Name
Industry Group |
PRICE |
CHANGE
(%Change) |
Day High |
Volume
(% DAV)
(% 50 day avg vol) |
52 Wk Hi
% From Hi |
Featured
Date |
Price
Featured |
Pivot Featured |
|
Max Buy |
AAPL
-
NASDAQ
Apple Inc
COMPUTER HARDWARE - Personal Computers
|
$405.77
|
+12.90
3.28% |
$406.50
|
17,926,359
81.27% of 50 DAV
50 DAV is 22,058,800
|
$426.70
-4.91%
|
9/16/2011
|
$399.14
|
PP = $404.60
|
|
MB = $424.83
|
 Most Recent Note - 10/24/2011 5:43:12 PM
G - Today it posted a gain on lighter than average volume following distributional losses last week. It has not formed a sound base pattern and ownership by top-rated funds has fallen some.
>>> The latest Featured Stock Update with an annotated graph appeared on 10/20/2011. Click here.
View all notes |
Alert me of new notes |
CANSLIM.net Company Profile |
SEC |
Zacks Reports |
StockTalk |
News |
Chart |
Request a new note
C
A N
S L
I M


|
ADS
-
NYSE
Alliance Data Sys Corp
COMPUTER SOFTWARE and SERVICES - Information and Delivery Service
|
$100.95
|
+2.96
3.02% |
$102.46
|
1,272,289
136.38% of 50 DAV
50 DAV is 932,900
|
$101.51
-0.55%
|
10/21/2011
|
$97.94
|
PP = $101.15
|
|
MB = $106.21
|
Most Recent Note - 10/24/2011 5:48:39 PM
Y - Posted a 3rd consecutive gain with above average volume today and finished at its best-ever close. Touched a new all-time high and traded above its pivot point intra-day, but it failed to close above that important threshold and the volume total on the session was not sufficient to trigger a proper technical buy signal. Subsequent volume-driven gains above its pivot point may confirm a more convincing technical buy signal. See the latest FSU analysis for more details and a new annotated graph.
>>> The latest Featured Stock Update with an annotated graph appeared on 10/21/2011. Click here.
View all notes |
Alert me of new notes |
CANSLIM.net Company Profile |
SEC |
Zacks Reports |
StockTalk |
News |
Chart |
Request a new note
C
A N
S L
I M
|
ALXN
-
NASDAQ
Alexion Pharmaceuticals
DRUGS - Drug Manufacturers - Other
|
$69.56
|
+1.18
1.73% |
$70.42
|
1,681,994
107.05% of 50 DAV
50 DAV is 1,571,200
|
$70.20
-0.91%
|
9/15/2011
|
$63.20
|
PP = $60.81
|
|
MB = $63.85
|
Most Recent Note - 10/24/2011 5:51:25 PM
G - Inched further into new high territory today without great volume conviction. Reported earnings +48% on +44% sales revenues for the quarter ended September 30, 2011 versus the year ago period. This high-ranked Medical - Biomed/Biotech group leader is extended from its prior base. Support to watch includes prior resistance in the $59-60 area and its upwardly tilted 50 DMA line.
>>> The latest Featured Stock Update with an annotated graph appeared on 10/18/2011. Click here.
View all notes |
Alert me of new notes |
CANSLIM.net Company Profile |
SEC |
Zacks Reports |
StockTalk |
News |
Chart |
Request a new note
C
A N
S L
I M
|
CELG
-
NASDAQ
Celgene Corp
DRUGS - Drug Manufacturers - Major
|
$67.86
|
+0.93
1.39% |
$68.25
|
3,120,167
80.81% of 50 DAV
50 DAV is 3,861,200
|
$67.37
0.73%
|
9/16/2011
|
$61.21
|
PP = $62.59
|
|
MB = $65.72
|
Most Recent Note - 10/24/2011 5:55:12 PM
G - Inched to a new 52-week high today with its 3rd consecutive gain on below average volume, getting more extended from its latest base.
>>> The latest Featured Stock Update with an annotated graph appeared on 10/14/2011. Click here.
View all notes |
Alert me of new notes |
CANSLIM.net Company Profile |
SEC |
Zacks Reports |
StockTalk |
News |
Chart |
Request a new note
C
A N
S L
I M
|
ISRG
-
NASDAQ
Intuitive Surgical Inc
HEALTH SERVICES - Medical Appliances and Equipment
|
$422.39
|
+6.76
1.63% |
$429.44
|
562,550
125.07% of 50 DAV
50 DAV is 449,800
|
$425.49
-0.73%
|
10/19/2011
|
$424.69
|
PP = $415.29
|
|
MB = $436.05
|
Most Recent Note - 10/24/2011 5:56:26 PM
Y - Hit a new all-time today with a gain backed by +25% above average volume after holding its ground since its 10/19/11 gap up gain on heavy volume triggered a technical buy signal. Prior highs define important support to watch on pullbacks.
>>> The latest Featured Stock Update with an annotated graph appeared on 10/19/2011. Click here.
View all notes |
Alert me of new notes |
CANSLIM.net Company Profile |
SEC |
Zacks Reports |
StockTalk |
News |
Chart |
Request a new note
C
A N
S L
I M
|
Symbol/Exchange
Company Name
Industry Group |
PRICE |
CHANGE
(%Change) |
Day High |
Volume
(% DAV)
(% 50 day avg vol) |
52 Wk Hi
% From Hi |
Featured
Date |
Price
Featured |
Pivot Featured |
|
Max Buy |
LABL
-
NASDAQ
Multi Color Corp
CONSUMER NON-DURABLES - Packaging and Containers
|
$27.17
|
+0.18
0.67% |
$27.51
|
28,980
50.49% of 50 DAV
50 DAV is 57,400
|
$28.00
-2.96%
|
10/17/2011
|
$27.81
|
PP = $28.10
|
|
MB = $29.51
|
Most Recent Note - 10/24/2011 5:58:30 PM
Y - Volume totals have recently cooled and it is now perched -3.0% off its 52-week high. Little overhead supply remains to act as resistance. Subsequent volume-driven gains into new high ground may trigger a technical buy signal. Annual earnings (A criteria) history included a slight dip in FY '09 earnings.
>>> The latest Featured Stock Update with an annotated graph appeared on 10/17/2011. Click here.
View all notes |
Alert me of new notes |
CANSLIM.net Company Profile |
SEC |
Zacks Reports |
StockTalk |
News |
Chart |
Request a new note
C
A N
S L
I M
|
MG
-
NYSE
Mistras Group Inc
DIVERSIFIED SERVICES - Bulding and Faci;ity Management Services
|
$22.49
|
-0.51
-2.22% |
$23.13
|
186,889
83.73% of 50 DAV
50 DAV is 223,200
|
$23.51
-4.34%
|
8/10/2011
|
$17.89
|
PP = $17.58
|
|
MB = $18.46
|
Most Recent Note - 10/24/2011 5:59:30 PM
G - Holding its ground near its all-time high today, extended from its prior base pattern. Prior highs in the $20-21 area define initial chart support to watch above its 50 DMA line.
>>> The latest Featured Stock Update with an annotated graph appeared on 10/12/2011. Click here.
View all notes |
Alert me of new notes |
CANSLIM.net Company Profile |
SEC |
Zacks Reports |
StockTalk |
News |
Chart |
Request a new note
C
A N
S L
I M
|
OPNT
-
NASDAQ
Opnet Technologies
INTERNET - Internet Software and Services
|
$44.97
|
+2.29
5.37% |
$45.92
|
694,746
431.79% of 50 DAV
50 DAV is 160,900
|
$42.77
5.14%
|
10/11/2011
|
$38.45
|
PP = $42.02
|
|
MB = $44.12
|
Most Recent Note - 10/24/2011 6:00:16 PM
G - Blasted beyond its "max buy" level with today's 3rd consecutive gain backed by ever increasing volume and its color code was changed to green after getting extended from its prior base. Triggered a technical buy signal with its volume-driven gain on 10/21, ten days after it was first featured in yellow. Due to report earnings on Wednesday, November 9th.
>>> The latest Featured Stock Update with an annotated graph appeared on 10/11/2011. Click here.
View all notes |
Alert me of new notes |
CANSLIM.net Company Profile |
SEC |
Zacks Reports |
StockTalk |
News |
Chart |
Request a new note
C
A N
S L
I M
|
V
-
NYSE
Visa Inc Cl A
DIVERSIFIED SERVICES - Business/Management Services
|
$94.21
|
+0.78
0.83% |
$94.41
|
3,034,565
55.28% of 50 DAV
50 DAV is 5,489,700
|
$94.75
-0.57%
|
10/24/2011
|
$94.21
|
PP = $94.85
|
|
MB = $99.59
|
Most Recent Note - 10/24/2011 6:34:58 PM
Y - New pivot point is cited based on its 52-week high plus 10 cents and its color code is changed to yellow. Subsequent volume-driven gains may trigger a new technical buy signal. See the latest FSU analysis for more details and a new annotated weekly graph illustrating the latest base.
>>> The latest Featured Stock Update with an annotated graph appeared on 10/24/2011. Click here.
View all notes |
Alert me of new notes |
CANSLIM.net Company Profile |
SEC |
Zacks Reports |
StockTalk |
News |
Chart |
Request a new note
C
A N
S L
I M
|
|
|
|
THESE ARE NOT BUY RECOMMENDATIONS!
Comments contained in the body of this report are technical
opinions only. The material herein has been obtained
from sources believed to be reliable and accurate, however,
its accuracy and completeness cannot be guaranteed.
This site is not an investment advisor, hence it does
not endorse or recommend any securities or other investments.
Any recommendation contained in this report may not
be suitable for all investors and it is not to be deemed
an offer or solicitation on our part with respect to
the purchase or sale of any securities. All trademarks,
service marks and trade names appearing in this report
are the property of their respective owners, and are
likewise used for identification purposes only.
This report is a service available
only to active Paid Premium Members.
You may opt-out of receiving report notifications
at any time. Questions or comments may be submitted
by writing to Premium Membership Services 665 S.E. 10 Street, Suite 201 Deerfield Beach, FL 33441-5634 or by calling 1-800-965-8307
or 954-785-1121.
|
|
|

