***Last / Change / Volume data in this table is the closing quote data***
Symbol/Exchange
Company Name
Industry Group |
PRICE |
CHANGE
(%Change) |
Day High |
Volume
(% DAV)
(% 50 day avg vol) |
52 Wk Hi
% From Hi |
Featured
Date |
Price
Featured |
Pivot Featured |
|
Max Buy |
AVG
-
NYSE
A V G Technologies N.V.
INTERNET - Internet Software and Services
|
$23.14
|
-1.21
-4.97% |
$24.24
|
611,124
76.49% of 50 DAV
50 DAV is 799,000
|
$26.56
-12.86%
|
9/13/2013
|
$23.06
|
PP = $23.88
|
|
MB = $25.07
|
 Most Recent Note - 10/23/2013 6:12:54 PM
G - Violated its 50 DMA line with today's loss on light volume, finishing -12.9% off its 52-week high. Color code is changed to green and a rebound above its 50 DMA line is again needed for its outlook to improve.
>>> FEATURED STOCK ARTICLE : Valid Secondary Buy Point After Resilient at 10-Week Moving Average - 10/21/2013
View all notes |
Set NEW NOTE alert |
CANSLIM.net Company Profile |
SEC
News |
Chart |
Request a new note
C
A N
S L
I M


|
BITA
-
NYSE
Bitauto Hldgs Ltd Ads
INTERNET - Internet Information Providers
|
$25.61
|
-0.28
-1.08% |
$26.25
|
865,183
128.18% of 50 DAV
50 DAV is 675,000
|
$26.52
-3.43%
|
9/24/2013
|
$16.40
|
PP = $17.31
|
|
MB = $18.18
|
Most Recent Note - 10/22/2013 12:08:19 PM
G - Churning above average volume today and it touched yet another new high. Recently noted - "It may go on to produce more climactic gains, however it is very extended from its prior base. Prior highs in the $18 area define initial support to watch on pullbacks."
>>> FEATURED STOCK ARTICLE : Volume-Driven Gains Cleared Latest Pivot Point - 10/2/2013
View all notes |
Set NEW NOTE alert |
CANSLIM.net Company Profile |
SEC
News |
Chart |
Request a new note
C
A N
S L
I M
|
BLOX
-
NYSE
Infoblox Inc
COMPUTER HARDWARE - Networking and Communication Dev
|
$45.78
|
-2.29
-4.76% |
$47.90
|
1,081,089
138.46% of 50 DAV
50 DAV is 780,800
|
$48.97
-6.51%
|
10/11/2013
|
$43.02
|
PP = $45.60
|
|
MB = $47.88
|
Most Recent Note - 10/23/2013 12:01:47 PM
Y - Abruptly retreating from its new 52-week high with today's considerable loss. Prior highs in the $45 area define initial support to watch. Disciplined investors avoid chasing "extended" stocks and limit losses by selling any stock that falls more than -7% from their purchase price.
>>> FEATURED STOCK ARTICLE : Finished Another Week Higher With Volume Behind Gains - 10/11/2013
View all notes |
Set NEW NOTE alert |
CANSLIM.net Company Profile |
SEC
News |
Chart |
Request a new note
C
A N
S L
I M
|
CELG
-
NASDAQ
Celgene Corp
DRUGS - Drug Manufacturers - Major
|
$160.00
|
-0.84
-0.52% |
$160.67
|
2,381,968
91.05% of 50 DAV
50 DAV is 2,616,000
|
$161.64
-1.02%
|
9/12/2013
|
$149.50
|
PP = $150.02
|
|
MB = $157.52
|
Most Recent Note - 10/17/2013 4:08:28 PM
G - Wedged above its "max buy" level and its color code is changed to green after inching higher on light volume for a 6th consecutive small gain and a new all-time high. Found support at its 50 DMA line last week as it did on prior pullbacks. The recent low ($143.13 on 10/09/13) defines important near-term support where a subsequent violation may trigger a more worrisome technical sell signal.
>>> FEATURED STOCK ARTICLE : Volume-Driven Gain Challenging New Pivot Point - 9/20/2013
View all notes |
Set NEW NOTE alert |
CANSLIM.net Company Profile |
SEC
News |
Chart |
Request a new note
C
A N
S L
I M
|
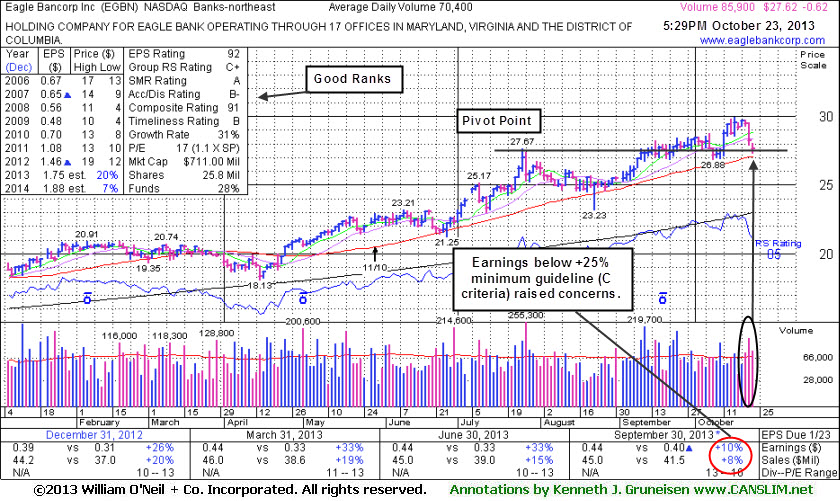
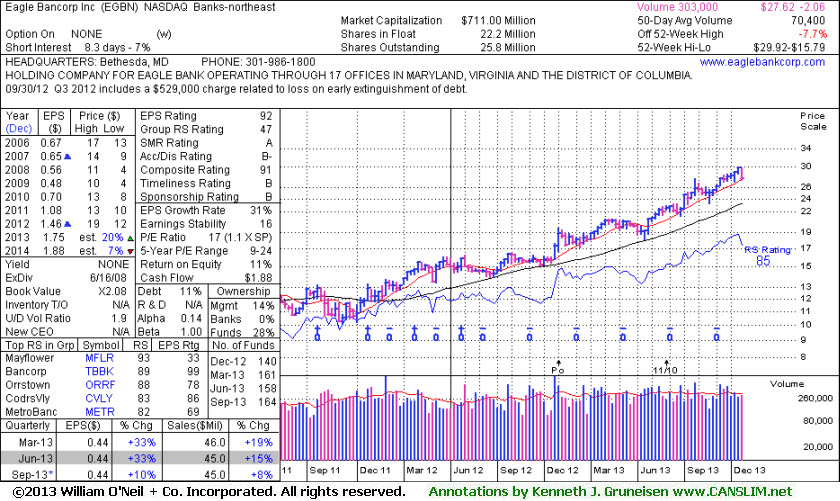
EGBN
-
NASDAQ
Eagle Bancorp Inc
BANKING - Regional - Mid-Atlantic Banks
|
$27.62
|
-0.62
-2.20% |
$28.06
|
85,909
122.03% of 50 DAV
50 DAV is 70,400
|
$29.92
-7.69%
|
9/16/2013
|
$27.48
|
PP = $27.77
|
|
MB = $29.16
|
Most Recent Note - 10/23/2013 6:10:21 PM
G - Color code is changed to green after fundamental and technical deterioration has raised concerns. See the latest FSU analysis for more details and new annotated daily and weekly graphs. Recent lows and its 50 DMA line define near-term support.
>>> FEATURED STOCK ARTICLE : Fundamental and Technical Deterioration Raising Concerns - 10/23/2013
View all notes |
Set NEW NOTE alert |
CANSLIM.net Company Profile |
SEC
News |
Chart |
Request a new note
C
A N
S L
I M
|
Symbol/Exchange
Company Name
Industry Group |
PRICE |
CHANGE
(%Change) |
Day High |
Volume
(% DAV)
(% 50 day avg vol) |
52 Wk Hi
% From Hi |
Featured
Date |
Price
Featured |
Pivot Featured |
|
Max Buy |
EGOV
-
NASDAQ
N I C Inc
INTERNET - Internet Software and Services
|
$24.67
|
-0.05
-0.20% |
$24.85
|
223,784
73.86% of 50 DAV
50 DAV is 303,000
|
$25.99
-5.08%
|
10/18/2013
|
$25.17
|
PP = $23.66
|
|
MB = $24.84
|
Most Recent Note - 10/21/2013 6:40:54 PM
Y - Hit another new high today then reversed to close in the red, finishing near the session low with a loss on above average volume. See the latest FSU analysis for an annotated weekly graph. Volume was more than 3 times average behind the technical breakout from a "double bottom" base on the prior session.
>>> FEATURED STOCK ARTICLE : Technical Breakout From "Double Bottom" Base on 3 Times Average Volume - 10/18/2013
View all notes |
Set NEW NOTE alert |
CANSLIM.net Company Profile |
SEC
News |
Chart |
Request a new note
C
A N
S L
I M
|
FLT
-
NYSE
Fleetcor Technologies
DIVERSIFIED SERVICES - Business/Management Services
|
$111.09
|
-2.27
-2.00% |
$112.52
|
604,630
84.98% of 50 DAV
50 DAV is 711,500
|
$114.16
-2.69%
|
8/19/2013
|
$99.01
|
PP = $100.97
|
|
MB = $106.02
|
Most Recent Note - 10/23/2013 6:01:03 PM
G - Perched at its all-time high, extended from any sound base. Found prompt support near its 50 DMA line that helped its outlook after enduring distributional pressure.
>>> FEATURED STOCK ARTICLE : Extended After 13 Weekly Gains in Span of 14 Weeks - 10/7/2013
View all notes |
Set NEW NOTE alert |
CANSLIM.net Company Profile |
SEC
News |
Chart |
Request a new note
C
A N
S L
I M
|
GNRC
-
NYSE
Generac Hldgs Inc
CONSUMER DURABLES - Electronic Equipment
|
$41.85
|
+0.30
0.72% |
$41.93
|
959,128
143.82% of 50 DAV
50 DAV is 666,900
|
$44.30
-5.53%
|
9/12/2013
|
$41.40
|
PP = $43.27
|
|
MB = $45.43
|
Most Recent Note - 10/17/2013 12:35:53 PM
G - Prior lows in $39 area define important near-term support. Wedging higher with gains lacking great volume conviction, approaching its 50 DMA line which is now downward sloping and may act as resistance. A rebound above the 50 DMA line is needed to help its outlook and technical stance improve. Its Relative Strength rank has slumped to 79, below the 80+ minimum guideline for buy candidates. Disciplined investors limit losses by selling if any stock falls more than -7% from their purchase price.
>>> FEATURED STOCK ARTICLE : Pullback Following Friday's Technical Buy Signal - 9/23/2013
View all notes |
Set NEW NOTE alert |
CANSLIM.net Company Profile |
SEC
News |
Chart |
Request a new note
C
A N
S L
I M
|
JAZZ
-
NASDAQ
Jazz Pharmaceuticals Plc
DRUGS - Biotechnology
|
$91.63
|
+1.12
1.24% |
$92.43
|
748,815
107.37% of 50 DAV
50 DAV is 697,400
|
$93.84
-2.36%
|
9/30/2013
|
$93.20
|
PP = $89.10
|
|
MB = $93.56
|
Most Recent Note - 10/22/2013 4:04:03 PM
Y- Rebounded above its 50 DMA line with above average volume behind today's 5th consecutive gain and its color code is changed to yellow as its technical stance has improved. Held its ground after a damaging loss and technical sell signal noted on 10/08/13.
>>> FEATURED STOCK ARTICLE : Strong Finish With High Volume Indicative of Accumulation - 9/30/2013
View all notes |
Set NEW NOTE alert |
CANSLIM.net Company Profile |
SEC
News |
Chart |
Request a new note
C
A N
S L
I M
|
KORS
-
NYSE
Michael Kors Hldgs Ltd
RETAIL - Apparel Stores
|
$77.60
|
-1.10
-1.40% |
$78.49
|
2,829,682
93.41% of 50 DAV
50 DAV is 3,029,200
|
$78.83
-1.56%
|
8/6/2013
|
$69.66
|
PP = $66.28
|
|
MB = $69.59
|
Most Recent Note - 10/17/2013 4:04:11 PM
G - Churned heavy volume today and finished with a loss while consolidating near its 50 DMA line. Found prompt support near that short-term average after a damaging loss on 10/08/13 triggered a technical sell signal. Recent low ($70.59 on 10/09/13) defines the next important near-term support area above prior highs in the $66 area.
>>> FEATURED STOCK ARTICLE : Extended From Base After Additional Volume-Driven Gains - 9/27/2013
View all notes |
Set NEW NOTE alert |
CANSLIM.net Company Profile |
SEC
News |
Chart |
Request a new note
C
A N
S L
I M
|
Symbol/Exchange
Company Name
Industry Group |
PRICE |
CHANGE
(%Change) |
Day High |
Volume
(% DAV)
(% 50 day avg vol) |
52 Wk Hi
% From Hi |
Featured
Date |
Price
Featured |
Pivot Featured |
|
Max Buy |
LOPE
-
NASDAQ
Grand Canyon Education
DIVERSIFIED SERVICES - Education and; Training Services
|
$43.66
|
+1.04
2.44% |
$44.05
|
551,504
174.14% of 50 DAV
50 DAV is 316,700
|
$43.15
1.19%
|
6/19/2013
|
$31.47
|
PP = $34.17
|
|
MB = $35.88
|
Most Recent Note - 10/23/2013 5:56:30 PM
G - Volume-driven gain today for another new all-time high. Fundamental concerns remain while technical action has been reassuring.
>>> FEATURED STOCK ARTICLE : Formed Advanced Base But Fundamental Concerns Remain - 10/14/2013
View all notes |
Set NEW NOTE alert |
CANSLIM.net Company Profile |
SEC
News |
Chart |
Request a new note
C
A N
S L
I M
|
MRLN
-
NASDAQ
Marlin Business Services
DIVERSIFIED SERVICES - Rental and Leasing Services
|
$26.44
|
-0.30
-1.12% |
$27.31
|
29,519
90.00% of 50 DAV
50 DAV is 32,800
|
$27.38
-3.43%
|
9/9/2013
|
$23.75
|
PP = $24.03
|
|
MB = $25.23
|
Most Recent Note - 10/23/2013 5:58:37 PM
G - Paused today at its 52-week high after 5 consecutive gains without great volume conviction. Found support at its 50 DMA line on the last pullback. Subsequent losses below the recent low ($23.25) would trigger a more worrisome technical sell signal.
>>> FEATURED STOCK ARTICLE : Faring Better Than Others While Testing 50-Day Average Line - 10/8/2013
View all notes |
Set NEW NOTE alert |
CANSLIM.net Company Profile |
SEC
News |
Chart |
Request a new note
C
A N
S L
I M
|
NOAH
-
NYSE
Noah Holdings Ltd Ads
FINANCIAL SERVICES - Asset Management
|
$19.64
|
+0.27
1.39% |
$20.55
|
1,284,767
175.75% of 50 DAV
50 DAV is 731,000
|
$22.99
-14.57%
|
10/15/2013
|
$19.10
|
PP = $18.33
|
|
MB = $19.25
|
Most Recent Note - 10/22/2013 3:54:01 PM
Y - Pulling back today for a 3rd consecutive loss following a "negative reversal" at its 52-week high after an impressive streak of volume-driven gains. Prior highs in the $18 area define initial support to watch.
>>> FEATURED STOCK ARTICLE : Finished Strong With Gain on 4 Times Average Volume - 10/15/2013
View all notes |
Set NEW NOTE alert |
CANSLIM.net Company Profile |
SEC
News |
Chart |
Request a new note
C
A N
S L
I M
|
NQ
-
NYSE
Nq Mobile Inc Ads
COMPUTER SOFTWARE and SERVICES - Application Software
|
$22.88
|
-0.96
-4.03% |
$23.71
|
4,638,286
122.76% of 50 DAV
50 DAV is 3,778,400
|
$25.90
-11.66%
|
10/22/2013
|
$23.31
|
PP = $26.00
|
|
MB = $27.30
|
Most Recent Note - 10/23/2013 6:14:13 PM
Y - Pulled back today for a 3rd consecutive loss while forming an advanced "ascending base" pattern. Subsequent volume-driven gains above its pivot point cited may trigger a technical buy signal. See the latest FSU analysis for more details with annotated daily and weekly graphs.
>>> FEATURED STOCK ARTICLE : Pullbacks Give Look of Advanced Ascending Base Pattern - 10/22/2013
View all notes |
Set NEW NOTE alert |
CANSLIM.net Company Profile |
SEC
News |
Chart |
Request a new note
C
A N
S L
I M
|
OII
-
NYSE
Oceaneering Intl Inc
ENERGY - Oil and Gas Drilling and Explorati
|
$83.00
|
-3.03
-3.52% |
$85.07
|
638,889
102.88% of 50 DAV
50 DAV is 621,000
|
$87.64
-5.29%
|
10/16/2013
|
$83.08
|
PP = $84.74
|
|
MB = $88.98
|
Most Recent Note - 10/23/2013 6:15:29 PM
Y - Gapped down today and slumped back under its pivot point, closing back in the prior base and raising concerns. Prior highs in the $84 area define initial support to watch on pullbacks.
>>> FEATURED STOCK ARTICLE : Forming Set-Up Above 50-Day Moving Average Line - 10/16/2013
View all notes |
Set NEW NOTE alert |
CANSLIM.net Company Profile |
SEC
News |
Chart |
Request a new note
C
A N
S L
I M
|
Symbol/Exchange
Company Name
Industry Group |
PRICE |
CHANGE
(%Change) |
Day High |
Volume
(% DAV)
(% 50 day avg vol) |
52 Wk Hi
% From Hi |
Featured
Date |
Price
Featured |
Pivot Featured |
|
Max Buy |
PCLN
-
NASDAQ
Priceline.Com Inc
INTERNET - Internet Software and Services
|
$1,065.97
|
-9.66
-0.90% |
$1,078.06
|
484,298
86.99% of 50 DAV
50 DAV is 556,700
|
$1,098.70
-2.98%
|
9/13/2013
|
$966.82
|
PP = $995.08
|
|
MB = $1,044.83
|
Most Recent Note - 10/22/2013 12:51:42 PM
G - It is extended from any sound base. Found support near its 50 DMA line after enduring damaging distributional losses.
>>> FEATURED STOCK ARTICLE : Wedging to New Highs With Gains Lacking Volume Conviction - 9/19/2013
View all notes |
Set NEW NOTE alert |
CANSLIM.net Company Profile |
SEC
News |
Chart |
Request a new note
C
A N
S L
I M
|
PRAA
-
NASDAQ
Portfolio Recovery Assoc
DIVERSIFIED SERVICES - Business/Management Services
|
$61.18
|
-0.47
-0.76% |
$61.74
|
209,934
48.95% of 50 DAV
50 DAV is 428,900
|
$62.40
-1.96%
|
10/17/2013
|
$60.75
|
PP = $61.70
|
|
MB = $64.79
|
Most Recent Note - 10/18/2013 5:16:37 PM
Y - Wedged to a new 52-week high with today's 3rd consecutive gain lacking great volume conviction. Pivot point cited was based on its 9/26/13 high plus 10 cents after forming an advanced "3-weeks tight" base. Subsequent volume-driven gains may clinch a proper new (or add-on) technical buy signal.
>>> FEATURED STOCK ARTICLE : Wedging to New Highs With Gains Lacking Volume Conviction - 9/26/2013
View all notes |
Set NEW NOTE alert |
CANSLIM.net Company Profile |
SEC
News |
Chart |
Request a new note
C
A N
S L
I M
|
PRLB
-
NYSE
Proto Labs Inc
MANUFACTURING - Small Tools and Accessories
|
$84.12
|
+0.69
0.83% |
$84.38
|
352,450
103.72% of 50 DAV
50 DAV is 339,800
|
$87.93
-4.33%
|
7/29/2013
|
$64.86
|
PP = $67.50
|
|
MB = $70.88
|
Most Recent Note - 10/22/2013 3:55:55 PM
G - Hit a new 52-week high today then reversed into the red for a loss with above average volume after 3 consecutive gains into new high territory. Extended from a sound base after rallying since finding prompt support at its 50 DMA line.
>>> FEATURED STOCK ARTICLE : Extended Following Additional Volume-Driven Gains - 9/25/2013
View all notes |
Set NEW NOTE alert |
CANSLIM.net Company Profile |
SEC
News |
Chart |
Request a new note
C
A N
S L
I M
|
SFUN
-
NYSE
Soufun Hldgs Ltd Ads A
INTERNET - Internet Information Providers
|
$53.87
|
-0.68
-1.25% |
$54.10
|
1,746,285
127.88% of 50 DAV
50 DAV is 1,365,600
|
$59.50
-9.46%
|
10/17/2013
|
$58.02
|
PP = $53.87
|
|
MB = $56.56
|
Most Recent Note - 10/21/2013 6:37:38 PM
Y - Pulled back today on lighter than average volume following considerable volume-driven gains to new highs. Prior highs in the $53 area define initial support to watch.
>>> FEATURED STOCK ARTICLE : Following Great Rally No New Base Has Been Formed - 10/1/2013
View all notes |
Set NEW NOTE alert |
CANSLIM.net Company Profile |
SEC
News |
Chart |
Request a new note
C
A N
S L
I M
|
SSNC
-
NASDAQ
S S & C Technologies
COMPUTER SOFTWARE and SERVICES - Application Software
|
$38.81
|
-0.36
-0.92% |
$38.89
|
131,579
32.34% of 50 DAV
50 DAV is 406,800
|
$39.94
-2.83%
|
10/22/2013
|
$39.17
|
PP = $40.04
|
|
MB = $42.04
|
Most Recent Note - 10/22/2013 7:37:42 PM
Y - New pivot point is cited based on its 9/18/13 high plus 10 cents and its color code is changed to yellow. Subsequent volume-driven gains above the pivot point may trigger a new (or add-on) technical buy signal. Perched near its 52-week high after 5 consecutive gains on light volume. Completed a Secondary Offering on 9/20/13 while perched at all-time highs.
>>> FEATURED STOCK ARTICLE : Finding Support Near 50-Day Average After Secondary Offering - 10/4/2013
View all notes |
Set NEW NOTE alert |
CANSLIM.net Company Profile |
SEC
News |
Chart |
Request a new note
C
A N
S L
I M
|
Symbol/Exchange
Company Name
Industry Group |
PRICE |
CHANGE
(%Change) |
Day High |
Volume
(% DAV)
(% 50 day avg vol) |
52 Wk Hi
% From Hi |
Featured
Date |
Price
Featured |
Pivot Featured |
|
Max Buy |
SSYS
-
NASDAQ
Stratasys Ltd
COMPUTER HARDWARE - Computer Peripherals
|
$107.32
|
-2.08
-1.90% |
$108.58
|
616,866
53.70% of 50 DAV
50 DAV is 1,148,700
|
$113.49
-5.43%
|
10/11/2013
|
$102.94
|
PP = $105.38
|
|
MB = $110.65
|
Most Recent Note - 10/22/2013 7:42:13 PM
Y - Recently paused near its "max buy" level after rallying from a "double bottom" base with gains backed by above average but not especially strong volume. Gains must have at least +40% above average volume to trigger a proper technical buy signal, so confirming gains with higher volume would be a welcome reassurance in the days to come.
>>> FEATURED STOCK ARTICLE : Faltering and Relative Strength Waning After Offering - 10/9/2013
View all notes |
Set NEW NOTE alert |
CANSLIM.net Company Profile |
SEC
News |
Chart |
Request a new note
C
A N
S L
I M
|
STMP
-
NASDAQ
Stamps.Com Inc
INTERNET - Internet Software and Services
|
$42.34
|
-2.79
-6.18% |
$45.09
|
198,616
201.03% of 50 DAV
50 DAV is 98,800
|
$47.21
-10.32%
|
9/24/2013
|
$45.54
|
PP = $46.57
|
|
MB = $48.90
|
Most Recent Note - 10/23/2013 6:08:26 PM
G - Color code is changed to green as it violated its 50 DMA line today with a damaging volume-driven loss triggering a technical sell signal, and it ended near the session low while slumping badly in the final half hour. Although no resistance remains due to overhead supply, it has retreated into the prior base after a recent technical buy signal was noted.
>>> FEATURED STOCK ARTICLE : Forming New Set-Up After 50-Day Average Acted as Support - 9/24/2013
View all notes |
Set NEW NOTE alert |
CANSLIM.net Company Profile |
SEC
News |
Chart |
Request a new note
C
A N
S L
I M
|
TBBK
-
NASDAQ
Bancorp Inc
BANKING - Regional - Mid-Atlantic Banks
|
$18.58
|
-0.16
-0.85% |
$18.80
|
76,845
42.41% of 50 DAV
50 DAV is 181,200
|
$19.14
-2.93%
|
9/4/2013
|
$16.26
|
PP = $16.79
|
|
MB = $17.63
|
Most Recent Note - 10/22/2013 7:43:14 PM
G - Touched a new 52-week high today then reversed into the red. Recent lows in the $17.25 area define near-term support above its 50 DMA line.
>>> FEATURED STOCK ARTICLE : Encountering Distributional Pressure While Consolidating Above Prior Highs - 10/3/2013
View all notes |
Set NEW NOTE alert |
CANSLIM.net Company Profile |
SEC
News |
Chart |
Request a new note
C
A N
S L
I M
|
TNGO
-
NASDAQ
Tangoe Inc
COMPUTER SOFTWARE and SERVICES - Technical and System Software
|
$24.30
|
+0.45
1.89% |
$24.51
|
1,437,296
236.20% of 50 DAV
50 DAV is 608,500
|
$26.05
-6.72%
|
9/12/2013
|
$21.30
|
PP = $23.15
|
|
MB = $24.31
|
Most Recent Note - 10/23/2013 1:05:29 PM
Y - Gapped down today yet managed a positive reversal and it is trading near its "max buy" level. Prior lows and its 50 DMA line define important near-term support in the $22.50 area where violations would raise serious concerns.
>>> FEATURED STOCK ARTICLE : Gains Today Lacked Volume Conviction of Institutional Demand - 9/17/2013
View all notes |
Set NEW NOTE alert |
CANSLIM.net Company Profile |
SEC
News |
Chart |
Request a new note
C
A N
S L
I M
|
ULTI
-
NASDAQ
Ultimate Software Group
INTERNET - Internet Software and Services
|
$149.17
|
-1.35
-0.90% |
$150.56
|
118,131
89.22% of 50 DAV
50 DAV is 132,400
|
$152.55
-2.22%
|
10/16/2013
|
$142.95
|
PP = $151.18
|
|
MB = $158.74
|
Most Recent Note - 10/18/2013 5:12:48 PM
Y - Rallied near its best-ever close with and finished near the session high with a solid gain backed by +36% above average volume. Subsequent volume-driven gains above the pivot point may trigger a technical buy signal. See the latest FSU analysis for more details and annotated daily and weekly graphs.
>>> FEATURED STOCK ARTICLE : Hovering Less Than -5% From 52-Week High - 10/17/2013
View all notes |
Set NEW NOTE alert |
CANSLIM.net Company Profile |
SEC
News |
Chart |
Request a new note
C
A N
S L
I M
|
Symbol/Exchange
Company Name
Industry Group |
PRICE |
CHANGE
(%Change) |
Day High |
Volume
(% DAV)
(% 50 day avg vol) |
52 Wk Hi
% From Hi |
Featured
Date |
Price
Featured |
Pivot Featured |
|
Max Buy |
VRX
-
NYSE
Valeant Pharmaceuticals
DRUGS - Drug Manufacturers - Other
|
$114.37
|
+1.84
1.64% |
$114.60
|
1,162,377
104.78% of 50 DAV
50 DAV is 1,109,400
|
$115.40
-0.89%
|
9/11/2013
|
$100.26
|
PP = $105.50
|
|
MB = $110.78
|
Most Recent Note - 10/17/2013 4:00:18 PM
G- Inching higher with light volume, poised for a best-ever close and its color code is changed to green. Found support above prior highs defining important support in the $105 area.
>>> FEATURED STOCK ARTICLE : Found Support Above Prior Highs on Pullback - 10/10/2013
View all notes |
Set NEW NOTE alert |
CANSLIM.net Company Profile |
SEC
News |
Chart |
Request a new note
C
A N
S L
I M
|
YNDX
-
NASDAQ
Yandex N V Class A
INTERNET - Internet Information Providers
|
$41.00
|
+0.33
0.81% |
$41.20
|
2,679,958
107.63% of 50 DAV
50 DAV is 2,489,900
|
$42.00
-2.38%
|
9/5/2013
|
$34.24
|
PP = $34.79
|
|
MB = $36.53
|
Most Recent Note - 10/18/2013 5:14:19 PM
G - Hit another new 52-week high today with a gap up and volume-driven gain. Extended from any sound base. Found prompt support above prior highs in the $34 area and its 50 DMA line.
>>> FEATURED STOCK ARTICLE : Gains Lacked Volume Conviction While Hitting New Highs - 9/18/2013
View all notes |
Set NEW NOTE alert |
CANSLIM.net Company Profile |
SEC
News |
Chart |
Request a new note
C
A N
S L
I M
|