***Last / Change / Volume data in this table is the closing quote data***
Symbol/Exchange
Company Name
Industry Group |
PRICE |
CHANGE
(%Change) |
Day High |
Volume
(% DAV)
(% 50 day avg vol) |
52 Wk Hi
% From Hi |
Featured
Date |
Price
Featured |
Pivot Featured |
|
Max Buy |
ALXN
-
NASDAQ
Alexion Pharmaceuticals
DRUGS - Drug Manufacturers - Other
|
$104.03
|
-3.59
-3.34% |
$107.18
|
2,633,823
282.18% of 50 DAV
50 DAV is 933,400
|
$119.54
-12.97%
|
8/23/2012
|
$103.70
|
PP = $110.06
|
|
MB = $115.56
|
 Most Recent Note - 10/22/2012 6:06:19 PM
Down today with heavy volume slumping deeper below its 50 DMA line and undercutting prior highs in the $109-110 area raising more serious concerns. Based on weak action it will be dropped from the Featured Stocks list tonight. Only a prompt rebound above its 50 DMA line would help its outlook.
>>> The latest Featured Stock Update with an annotated graph appeared on 9/26/2012. Click here.
View all notes |
Alert me of new notes |
CANSLIM.net Company Profile |
SEC |
Zacks Reports |
StockTalk |
News |
Chart |
Request a new note
C
A N
S L
I M


|
ASPS
-
NASDAQ
Altisource Ptf Sltns Sa
REAL ESTATE - Property Management/Developmen
|
$112.03
|
+0.11
0.10% |
$115.65
|
190,713
110.82% of 50 DAV
50 DAV is 172,100
|
$118.48
-5.44%
|
9/24/2012
|
$87.24
|
PP = $92.39
|
|
MB = $97.01
|
Most Recent Note - 10/18/2012 4:00:07 PM
G - Pulling back today on near average volume for 2nd consecutive loss while retreating from its all-time high. Very extended from its prior base, its prior highs in the $92 area define initial support to watch on pullbacks.
>>> The latest Featured Stock Update with an annotated graph appeared on 10/12/2012. Click here.
View all notes |
Alert me of new notes |
CANSLIM.net Company Profile |
SEC |
Zacks Reports |
StockTalk |
News |
Chart |
Request a new note
C
A N
S L
I M
|
BRLI
-
NASDAQ
Bio Reference Labs Inc
HEALTH SERVICES - Medical Laboratories and Researc
|
$30.98
|
-0.09
-0.29% |
$31.71
|
184,879
60.20% of 50 DAV
50 DAV is 307,100
|
$32.86
-5.72%
|
10/3/2012
|
$30.90
|
PP = $30.25
|
|
MB = $31.76
|
Most Recent Note - 10/19/2012 4:25:07 PM
G - Loss today with above average volume, retreating near prior highs in the $30 area defining initial chart support above its 50 DMA line.
>>> The latest Featured Stock Update with an annotated graph appeared on 10/8/2012. Click here.
View all notes |
Alert me of new notes |
CANSLIM.net Company Profile |
SEC |
Zacks Reports |
StockTalk |
News |
Chart |
Request a new note
C
A N
S L
I M
|
CFNL
-
NASDAQ
Cardinal Financial Corp
BANKING - Regional - Southeast Banks
|
$13.67
|
-0.01
-0.07% |
$13.94
|
49,711
58.01% of 50 DAV
50 DAV is 85,700
|
$14.79
-7.57%
|
8/17/2012
|
$12.84
|
PP = $13.31
|
|
MB = $13.98
|
Most Recent Note - 10/19/2012 4:27:53 PM
G - Managed a positive reversal today after overcoming early weakness, fighting back to a close just above its 50 DMA line ($13.65 now). Subsequent deterioration below that short-term average would raise more serious concerns.
>>> The latest Featured Stock Update with an annotated graph appeared on 9/25/2012. Click here.
View all notes |
Alert me of new notes |
CANSLIM.net Company Profile |
SEC |
Zacks Reports |
StockTalk |
News |
Chart |
Request a new note
C
A N
S L
I M
|
CMCSA
-
NASDAQ
Comcast Corp Cl A
MEDIA - CATV Systems
|
$37.03
|
+0.08
0.22% |
$37.17
|
10,543,029
90.17% of 50 DAV
50 DAV is 11,691,900
|
$37.60
-1.52%
|
6/11/2012
|
$29.94
|
PP = $30.98
|
|
MB = $32.53
|
Most Recent Note - 10/19/2012 12:28:36 PM
G - Pulling back today after a streak of 5 consecutive gains to new 52-week high territory. Found support while consolidating above prior highs in the $35 area and its 50 DMA line. Violations would trigger technical sell signals. Fundamental concerns have been repeatedly noted - "Due to sub par sales and earnings growth in the Jun '12 quarter."
>>> The latest Featured Stock Update with an annotated graph appeared on 9/21/2012. Click here.
View all notes |
Alert me of new notes |
CANSLIM.net Company Profile |
SEC |
Zacks Reports |
StockTalk |
News |
Chart |
Request a new note
C
A N
S L
I M
|
Symbol/Exchange
Company Name
Industry Group |
PRICE |
CHANGE
(%Change) |
Day High |
Volume
(% DAV)
(% 50 day avg vol) |
52 Wk Hi
% From Hi |
Featured
Date |
Price
Featured |
Pivot Featured |
|
Max Buy |
DVA
-
NYSE
Davita Inc
HEALTH SERVICES - Specialized Health Services
|
$112.00
|
+1.28
1.16% |
$112.20
|
597,164
78.04% of 50 DAV
50 DAV is 765,200
|
$113.48
-1.30%
|
9/5/2012
|
$102.92
|
PP = $100.62
|
|
MB = $105.65
|
Most Recent Note - 10/18/2012 10:22:20 AM
G - Hitting another new 52-week high today, getting more extended from its latest sound base. Prior highs near $100 and its 50 DMA line define near-term support to watch on pullbacks where violations may trigger technical sell signals.
>>> The latest Featured Stock Update with an annotated graph appeared on 10/10/2012. Click here.
View all notes |
Alert me of new notes |
CANSLIM.net Company Profile |
SEC |
Zacks Reports |
StockTalk |
News |
Chart |
Request a new note
C
A N
S L
I M
|
GPX
-
NYSE
G P Strategies Corp
DIVERSIFIED SERVICES - Education and Training Services
|
$18.52
|
-0.26
-1.38% |
$18.93
|
48,368
76.65% of 50 DAV
50 DAV is 63,100
|
$20.67
-10.40%
|
10/8/2012
|
$20.00
|
PP = $20.77
|
|
MB = $21.81
|
Most Recent Note - 10/18/2012 4:39:01 PM
G - Slumped below its 50 DMA line today on light volume and finished at the session low and near recent lows. Losses exceeding its recent low ($18.82 on 10/04/12) would raise more serious concerns and trigger technical sell signals. Volume driven gains above the pivot point have not triggered a new (or add-on) technical buy signal.
>>> The latest Featured Stock Update with an annotated graph appeared on 10/16/2012. Click here.
View all notes |
Alert me of new notes |
CANSLIM.net Company Profile |
SEC |
Zacks Reports |
StockTalk |
News |
Chart |
Request a new note
C
A N
S L
I M
|
LKQ
-
NASDAQ
L K Q Corp
WHOLESALE - Auto Parts
|
$20.46
|
+0.03
0.14% |
$20.74
|
1,518,055
104.85% of 50 DAV
50 DAV is 1,447,800
|
$21.22
-3.56%
|
8/9/2012
|
$18.97
|
PP = $18.72
|
|
MB = $19.66
|
Most Recent Note - 10/19/2012 6:22:23 PM
G - Perched near its all-time high today. Recently rallied well above its "max buy" level with no resistance remaining due to overhead supply. See latest FSU analysis for more details and a new annotated graph.
>>> The latest Featured Stock Update with an annotated graph appeared on 10/19/2012. Click here.
View all notes |
Alert me of new notes |
CANSLIM.net Company Profile |
SEC |
Zacks Reports |
StockTalk |
News |
Chart |
Request a new note
C
A N
S L
I M
|
LULU
-
NASDAQ
Lululemon Athletica
MANUFACTURING - Textile Manufacturing
|
$68.28
|
-0.75
-1.09% |
$69.27
|
2,455,449
102.84% of 50 DAV
50 DAV is 2,387,600
|
$81.09
-15.80%
|
10/2/2012
|
$74.89
|
PP = $78.97
|
|
MB = $82.92
|
Most Recent Note - 10/22/2012 6:33:35 PM
Trading near its 200 DMA line which may act as support. Based on weak action it will be dropped from the Featured Stocks list tonight. Last week it violated its 50 DMA line with a damaging loss on heavy volume, and only a prompt rebound above that important short-term average would help its outlook improve.
>>> The latest Featured Stock Update with an annotated graph appeared on 10/2/2012. Click here.
View all notes |
Alert me of new notes |
CANSLIM.net Company Profile |
SEC |
Zacks Reports |
StockTalk |
News |
Chart |
Request a new note
C
A N
S L
I M
|
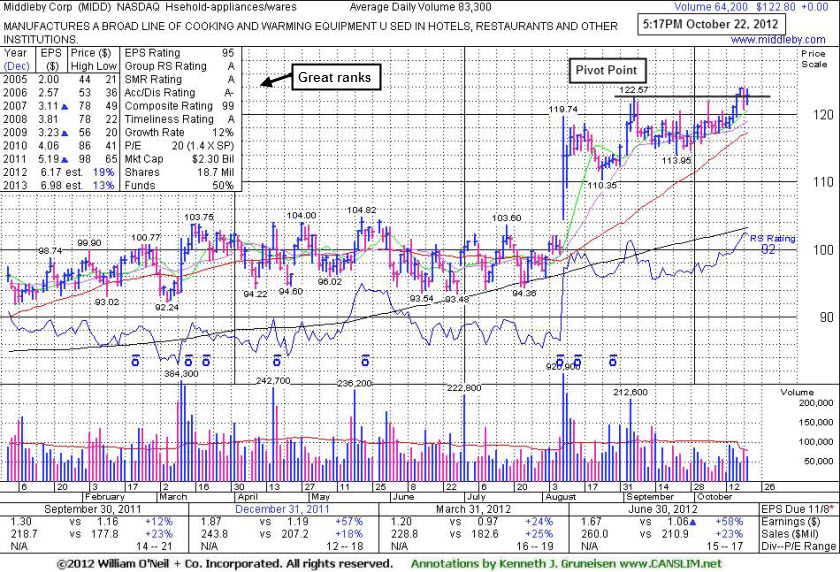
MIDD
-
NASDAQ
Middleby Corp
MANUFACTURING - Diversified Machinery
|
$122.80
|
+0.00
0.00% |
$123.75
|
65,803
79.00% of 50 DAV
50 DAV is 83,300
|
$123.95
-0.93%
|
10/8/2012
|
$118.46
|
PP = $122.67
|
|
MB = $128.80
|
Most Recent Note - 10/22/2012 6:52:50 PM
Y - Finished just -0.9% off its 52-week high today. Volume totals have been below average in recent weeks while stubbornly holding its ground. Subsequent volume-driven gains above the pivot point may trigger a new (or add-on) technical buy signal. Its 50 DMA line and recent lows define near-term chart support to watch. See the latest FSU analysis for more details and a new annotated graph.
>>> The latest Featured Stock Update with an annotated graph appeared on 10/22/2012. Click here.
View all notes |
Alert me of new notes |
CANSLIM.net Company Profile |
SEC |
Zacks Reports |
StockTalk |
News |
Chart |
Request a new note
C
A N
S L
I M
|
Symbol/Exchange
Company Name
Industry Group |
PRICE |
CHANGE
(%Change) |
Day High |
Volume
(% DAV)
(% 50 day avg vol) |
52 Wk Hi
% From Hi |
Featured
Date |
Price
Featured |
Pivot Featured |
|
Max Buy |
N
-
NYSE
Netsuite Inc
DIVERSIFIED SERVICES - Business/Management Services
|
$57.95
|
-1.92
-3.21% |
$60.01
|
606,299
134.58% of 50 DAV
50 DAV is 450,500
|
$64.70
-10.43%
|
8/20/2012
|
$55.88
|
PP = $59.32
|
|
MB = $62.29
|
Most Recent Note - 10/22/2012 6:54:40 PM
G - Color code is changed to green after violating its prior highs in the $59 area and sinking below its 50 DMA line with higher volume today triggering technical sell signals.
>>> The latest Featured Stock Update with an annotated graph appeared on 9/24/2012. Click here.
View all notes |
Alert me of new notes |
CANSLIM.net Company Profile |
SEC |
Zacks Reports |
StockTalk |
News |
Chart |
Request a new note
C
A N
S L
I M
|
NSM
-
NYSE
Nationstar Mtg Hldgs Inc
FINANCIAL SERVICES - Credit Services
|
$34.34
|
+1.76
5.40% |
$34.38
|
987,444
81.65% of 50 DAV
50 DAV is 1,209,400
|
$37.20
-7.69%
|
8/29/2012
|
$27.96
|
PP = $28.85
|
|
MB = $30.29
|
Most Recent Note - 10/22/2012 1:46:12 PM
G - Rallying today after slumping near a previously noted steep upward trendline connecting July-September lows which defines a near-term support level to watch above its 50 DMA line.
>>> The latest Featured Stock Update with an annotated graph appeared on 10/11/2012. Click here.
View all notes |
Alert me of new notes |
CANSLIM.net Company Profile |
SEC |
Zacks Reports |
StockTalk |
News |
Chart |
Request a new note
C
A N
S L
I M
|
OSIS
-
NASDAQ
O S I Systems Inc
ELECTRONICS - Semiconductor Equipment and Mate
|
$76.83
|
+1.21
1.60% |
$77.26
|
145,663
118.04% of 50 DAV
50 DAV is 123,400
|
$79.90
-3.84%
|
9/5/2012
|
$74.39
|
PP = $75.10
|
|
MB = $78.86
|
Most Recent Note - 10/19/2012 4:32:02 PM
Y - Gapped down today for a loss with near average volume, slumping near its 50 DMA line. Touched a new 52-week high on the prior session then reversed into the red for a quiet loss. See the latest FSU analysis for more details and a new annotated graph.
>>> The latest Featured Stock Update with an annotated graph appeared on 10/18/2012. Click here.
View all notes |
Alert me of new notes |
CANSLIM.net Company Profile |
SEC |
Zacks Reports |
StockTalk |
News |
Chart |
Request a new note
C
A N
S L
I M
|
RNF
-
NYSE
Rentech Nitrogen Ptnr Lp
CHEMICALS - Agricultural Chemicals
|
$36.52
|
+0.12
0.33% |
$37.25
|
240,455
60.04% of 50 DAV
50 DAV is 400,500
|
$40.05
-8.81%
|
7/27/2012
|
$29.58
|
PP = $30.60
|
|
MB = $32.13
|
Most Recent Note - 10/16/2012 12:58:19 PM
G - Considerable gain today, rallying from its 50 DMA line defining important near-term support after the previously noted upward trendline violation. Gains have lacked volume conviction after it halted its slide.
>>> The latest Featured Stock Update with an annotated graph appeared on 10/4/2012. Click here.
View all notes |
Alert me of new notes |
CANSLIM.net Company Profile |
SEC |
Zacks Reports |
StockTalk |
News |
Chart |
Request a new note
C
A N
S L
I M
|
TDG
-
NYSE
Transdigm Group Inc
AEROSPACE/DEFENSE - Aerospace/Defense Products and; Services
|
$147.39
|
+1.69
1.16% |
$147.91
|
644,690
148.72% of 50 DAV
50 DAV is 433,500
|
$152.62
-3.43%
|
8/16/2012
|
$132.23
|
PP = $136.44
|
|
MB = $143.26
|
Most Recent Note - 10/19/2012 4:44:04 PM
G - Traded above average volume behind a 3rd consecutive loss today. Its 50 DMA line defines near-term support to watch above recent lows in the $138 area where violations may trigger technical sell signals.
>>> The latest Featured Stock Update with an annotated graph appeared on 9/20/2012. Click here.
View all notes |
Alert me of new notes |
CANSLIM.net Company Profile |
SEC |
Zacks Reports |
StockTalk |
News |
Chart |
Request a new note
C
A N
S L
I M
|
Symbol/Exchange
Company Name
Industry Group |
PRICE |
CHANGE
(%Change) |
Day High |
Volume
(% DAV)
(% 50 day avg vol) |
52 Wk Hi
% From Hi |
Featured
Date |
Price
Featured |
Pivot Featured |
|
Max Buy |
ULTA
-
NASDAQ
Ulta Salon Cosm & Frag
SPECIALTY RETAIL - Specialty Retail, Other
|
$95.01
|
+0.23
0.24% |
$95.04
|
597,421
75.79% of 50 DAV
50 DAV is 788,300
|
$103.52
-8.22%
|
9/4/2012
|
$93.17
|
PP = $98.52
|
|
MB = $103.45
|
Most Recent Note - 10/18/2012 1:13:56 PM
G - Color code is changed to green while encountering distributional pressure and sputtering near its 50 DMA line. Its Relative Strength Rating has slumped to 77, below the 80+ minimum rank for ideal buy candidates under the fact-based investment system. The latest FSU analysis discussed its waning Relative Strength under the headline "Relative Strength Line Did Not Provide Confirmation - Friday, October 05, 2012".
>>> The latest Featured Stock Update with an annotated graph appeared on 10/5/2012. Click here.
View all notes |
Alert me of new notes |
CANSLIM.net Company Profile |
SEC |
Zacks Reports |
StockTalk |
News |
Chart |
Request a new note
C
A N
S L
I M
|
ULTI
-
NASDAQ
Ultimate Software Group
INTERNET - Internet Software and Services
|
$96.10
|
-0.31
-0.32% |
$96.60
|
214,136
148.40% of 50 DAV
50 DAV is 144,300
|
$106.40
-9.68%
|
8/27/2012
|
$98.36
|
PP = $99.19
|
|
MB = $104.15
|
Most Recent Note - 10/22/2012 12:57:44 PM
G - Up from today's earlier lows following 5 consecutive losses. Raised concerns as it undercut prior lows in the $96 area after violating its 50 DMA line, triggering technical sell signals. A rebound above its 50 DMA line is needed for its outlook to improve
>>> The latest Featured Stock Update with an annotated graph appeared on 9/27/2012. Click here.
View all notes |
Alert me of new notes |
CANSLIM.net Company Profile |
SEC |
Zacks Reports |
StockTalk |
News |
Chart |
Request a new note
C
A N
S L
I M
|
VSI
-
NYSE
Vitamin Shoppe Inc
SPECIALTY RETAIL - Specialty Retail, Other
|
$57.63
|
+0.10
0.17% |
$57.66
|
162,426
53.18% of 50 DAV
50 DAV is 305,400
|
$61.83
-6.79%
|
10/15/2012
|
$57.82
|
PP = $60.08
|
|
MB = $63.08
|
Most Recent Note - 10/19/2012 4:48:44 PM
Y - Volume totals have been below average in recent weeks while consolidating near its 50 DMA line. Color code was changed to yellow while still building on a new base, and subsequent volume-driven gains are needed to trigger a new technical buy signal.
>>> The latest Featured Stock Update with an annotated graph appeared on 10/15/2012. Click here.
View all notes |
Alert me of new notes |
CANSLIM.net Company Profile |
SEC |
Zacks Reports |
StockTalk |
News |
Chart |
Request a new note
C
A N
S L
I M
|
WPI
-
NYSE
Watson Pharmaceuticals
DRUGS - Drugs - Generic
|
$87.44
|
+0.53
0.61% |
$87.75
|
828,119
91.06% of 50 DAV
50 DAV is 909,400
|
$89.90
-2.74%
|
8/24/2012
|
$82.90
|
PP = $81.10
|
|
MB = $85.16
|
Most Recent Note - 10/16/2012 1:00:49 PM
G - Hitting new 52-week highs today with a big gain on below average volume. It is getting more extended from its prior base, and its 50 DMA line defines important support to watch on pullbacks.
>>> The latest Featured Stock Update with an annotated graph appeared on 9/28/2012. Click here.
View all notes |
Alert me of new notes |
CANSLIM.net Company Profile |
SEC |
Zacks Reports |
StockTalk |
News |
Chart |
Request a new note
C
A N
S L
I M
|