You are not logged in.
This means you
CAN ONLY VIEW reports that were published prior to Monday, April 14, 2025.
You
MUST UPGRADE YOUR MEMBERSHIP if you want to see any current reports.
AFTER MARKET UPDATE - TUESDAY, OCTOBER 21ST, 2014
Previous After Market Report Next After Market Report >>>
|
|
|
|
DOW |
+215.14 |
16,614.81 |
+1.31% |
|
Volume |
795,889,750 |
+10% |
|
Volume |
1,822,042,620 |
+17% |
|
NASDAQ |
+103.41 |
4,419.48 |
+2.40% |
|
Advancers |
2,592 |
81% |
|
Advancers |
2,181 |
74% |
|
S&P 500 |
+37.27 |
1,941.28 |
+1.96% |
|
Decliners |
536 |
17% |
|
Decliners |
668 |
23% |
|
Russell 2000 |
+17.88 |
1,112.85 |
+1.63% |
|
52 Wk Highs |
78 |
|
|
52 Wk Highs |
43 |
|
|
S&P 600 |
+10.51 |
642.39 |
+1.66% |
|
52 Wk Lows |
22 |
|
|
52 Wk Lows |
28 |
|
|
 |
Big Gains With More Leadership and Volume Confirm a New Market Rally
Kenneth J. Gruneisen - Passed the CAN SLIM® Master's Exam
Considerable gains helped the Dow Jones Industrial Average and the S&P 500 Index both join the Nasdaq Composite Index in rebounding above their respective 200-day moving average (DMA) lines. The Dow gained 215 points to 16,614. The S&P advanced 37 points to 1,941. The NASDAQ was up 103 points to 4,419. The large gains on Tuesday were backed by higher volume totals while leadership (stocks hitting new 52-week highs) expanded, making it a solid "follow-through day" confirming a new rally for the market (M criteria). Breadth was positive as advancers led decliners by nearly a 5-1 margin on the NYSE and 3-1 on the Nasdaq exchange. Leadership expanded as there were 27 high-ranked companies from the CANSLIM.net Leaders List that made new 52-week highs and appeared on the CANSLIM.net BreakOuts Page, up from the prior session total of 6 stocks. New 52-week highs outnumbered new 52-week lows on the NYSE and on the Nasdaq exchange. There were gains for all of the 5 high-ranked companies currently included on the Featured Stocks Page, a list that has waned as market conditions eroded. Disciplined investors know that new buying efforts may be made under the fact-based investment system only in stocks meeting all key criteria.
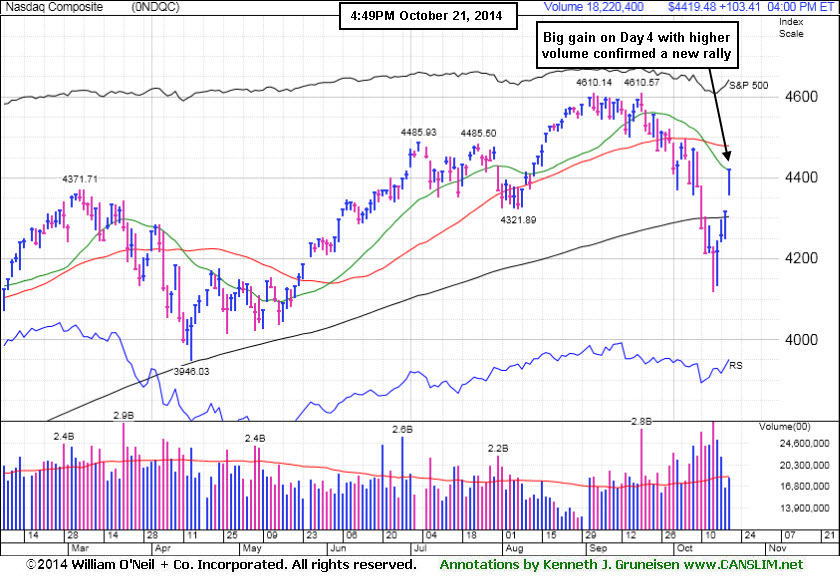
PICTURED: The Nasdaq Composite Index posted a +2.4% gain on higher volume while leadership expanded on Day 4 of the rally attempt - meeting the requirements for a convincing "follow-through day" which confirmed a new uptrend for the market (M criteria).
The major averages rallied as investors focused on company earnings and central bank activity. At the close all 10 sectors in the S&P 500 were in positive territory. Apple (AAPL +2.72%) rose following a positive earnings report and upward revisions to forward guidance. United Technologies (UTX +0.49%) edged higher after topping earnings estimates. The energy sector was up the most as the price of WTI crude extended Monday's gain by +0.1% to $82.81 per barrel. Marathon Petroleum (MPC +5.34%) and Halliburton (HAL +5.10%) both rallied. The defensive utilities sector was the relative underperformer with Duke Energy (DUK -0.53%) among decliners. Profit tallies will stay in focus after close with notable releases due out from Yahoo!,(YHOO +2.29%), Discover Financial (DFS +2.68%), and Broadcom (BRCM +2.84%).
On the economic front, existing home sales unexpectedly increased by +2.4% in September to a one-year high. In other news, the ECB purchased fixed income securities in France, Spain, and Italy, while reports surfaced that the asset purchases may encompass corporate fixed income as early as December.
Treasuries ended the session lower. The benchmark 10-year note was off by 8/32 to yield 2.22%.
The CANSLIM.net Featured Stocks Page shows the most action-worthy candidates and their latest notes and a Headline Link directs members to the latest detailed analysis with data-packed graphs annotated by a Certified expert along with links to additional resources. The Premium Member Homepage includes "dynamic archives" to all prior pay reports published.
|
 Kenneth J. Gruneisen started out as a licensed stockbroker in August 1987, a couple of months prior to the historic stock market crash that took the Dow Jones Industrial Average down -22.6% in a single day. He has published daily fact-based fundamental and technical analysis on high-ranked stocks online for two decades. Through FACTBASEDINVESTING.COM, Kenneth provides educational articles, news, market commentary, and other information regarding proven investment systems that work in good times and bad.
Comments contained in the body of this report are technical opinions only and are not necessarily those of Gruneisen Growth Corp. The material herein has been obtained from sources believed to be reliable and accurate, however, its accuracy and completeness cannot be guaranteed. Our firm, employees, and customers may effect transactions, including transactions contrary to any recommendation herein, or have positions in the securities mentioned herein or options with respect thereto. Any recommendation contained in this report may not be suitable for all investors and it is not to be deemed an offer or solicitation on our part with respect to the purchase or sale of any securities. |
|
 |
Tech, Energy, Retail, and Financial Groups Post Solid Gains
Kenneth J. Gruneisen - Passed the CAN SLIM® Master's Exam
The Semiconductor Index ($SOX +3.61%) led the tech sector higher while the Biotechnology Index ($BTK +2.49%) and the Networking Index ($NWX +2.70%) also tallied solid gains on Tuesday. Strength in energy-related shares led to big gains for the Integrated Oil Index ($XOI +2.75%) and the Oil Services Index ($OSX +3.24%). The Retail Index ($RLX +2.38%) was a positive influence on the major averages along with financial shares as the Broker/Dealer Index ($XBD +1.75%) and the Bank Index ($BKX +2.11%) rose. The Gold & Silver Index ($XAU +0.25%) was a laggard as it barely inched higher.
Charts courtesy www.stockcharts.com
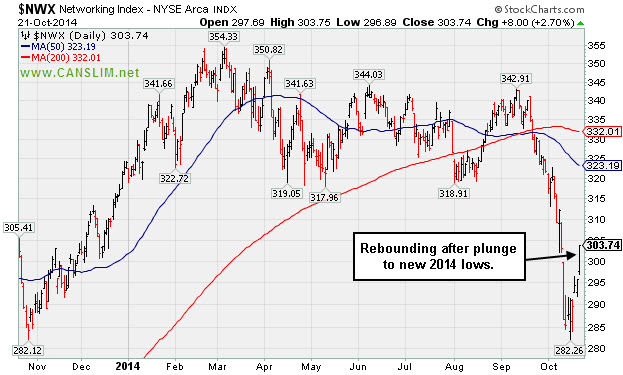
PICTURED: The Networking Index ($NWX +2.70%) is rebounding after a plunge to new 2014 lows.
| Oil Services |
$OSX |
251.47 |
+7.90 |
+3.24% |
-10.52% |
| Integrated Oil |
$XOI |
1,460.71 |
+39.15 |
+2.75% |
-2.82% |
| Semiconductor |
$SOX |
605.25 |
+21.10 |
+3.61% |
+13.12% |
| Networking |
$NWX |
303.74 |
+8.00 |
+2.70% |
-6.24% |
| Broker/Dealer |
$XBD |
164.81 |
+2.84 |
+1.75% |
+2.65% |
| Retail |
$RLX |
929.10 |
+21.58 |
+2.38% |
-1.14% |
| Gold & Silver |
$XAU |
78.75 |
+0.20 |
+0.25% |
-6.42% |
| Bank |
$BKX |
68.62 |
+1.42 |
+2.11% |
-0.92% |
| Biotech |
$BTK |
3,131.39 |
+75.99 |
+2.49% |
+34.37% |
|
|
|
 |
Quiet Gains Help Generic Drug Firm Rise Above 50-Day Average
Kenneth J. Gruneisen - Passed the CAN SLIM® Master's Exam
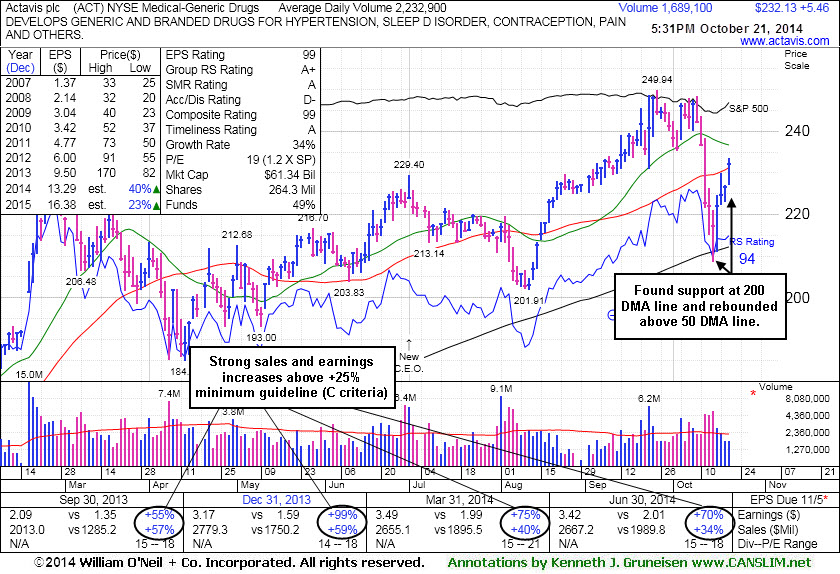
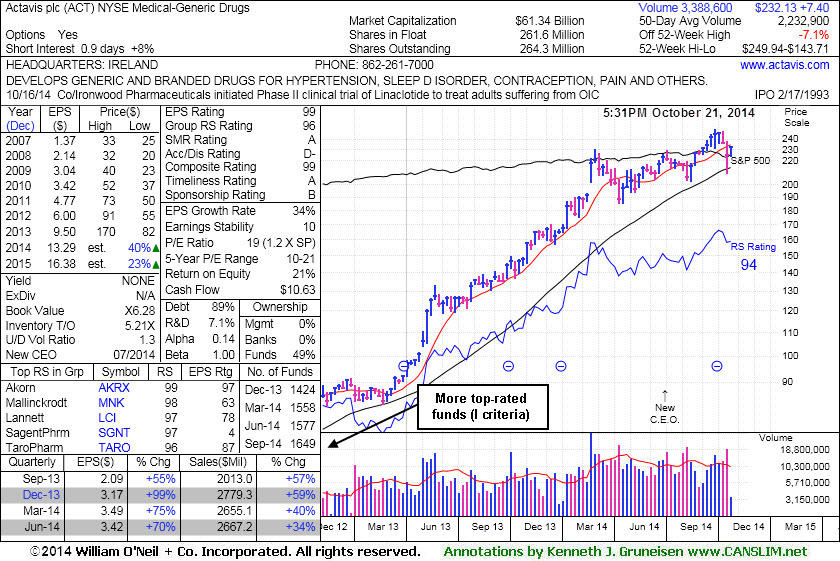
Actavis plc (ACT +$5.46 or +2.41% to $232.13) quietly rebounded above its 50-day moving average (DMA) line today helping its outlook improve. It found support at its 200 DMA line after a damaging streak of 5 consecutive losses marked by volume triggered technical sell signals. It was last shown in this FSU section on 10/08/14 with annotated graphs under the headline, "Held Ground Above Prior Highs Defining Near-Term Support".
Its current Accumulation/Distribution Rating is D- which is not a reassuring sign. Its streak of gains and rebound above its 50-day moving average (DMA) line lacked great volume conviction versus that of prior losses.
It was first highlighted in yellow in the 6/20/14 mid-day report (read here) with a pivot point based on its 2/26/14 high plus 10 cents. The Medical - Generic Drugs industry group currently has a 96 Group Relative Strength Rating, up from a 66 when shown on 8/28/14. Leadership from other issues in the group is also a reassuring sign concerning the L criteria. It reported earnings +70% on +34% sales revenues for the Jun '14 quarter, and its strong record satisfies the C criteria. Its annual earnings (A criteria) history has also been strong. The number of top-rated funds owning its shares has been on the rise, up from 1,219 in Sep '13 to 1,649 in Sep '14, a reassuring sign concerning the I criteria. Its current Up/Down Volume Ratio of 1.3 is an unbiased indication its shares have been under accumulation over the past 50 days.
|
|
|
Color Codes Explained :
Y - Better candidates highlighted by our
staff of experts.
G - Previously featured
in past reports as yellow but may no longer be buyable under the
guidelines.
***Last / Change / Volume data in this table is the closing quote data***
Symbol/Exchange
Company Name
Industry Group |
PRICE |
CHANGE
(%Change) |
Day High |
Volume
(% DAV)
(% 50 day avg vol) |
52 Wk Hi
% From Hi |
Featured
Date |
Price
Featured |
Pivot Featured |
|
Max Buy |
ACT
-
NYSE
Actavis plc
Medical-Generic Drugs
|
$232.13
|
+5.46
2.41% |
$233.50
|
1,670,997
74.56% of 50 DAV
50 DAV is 2,241,000
|
$249.94
-7.13%
|
6/20/2014
|
$216.53
|
PP = $230.87
|
|
MB = $242.41
|
 Most Recent Note - 10/21/2014 6:12:28 PM
Y - Color code is changed to yellow after rebounding above its 50 DMA line today helping its outlook improve. Found support at its 200 DMA line following damaging losses marked by volume. See the latest FSU analysis for more details and new annotated graphs.
>>> FEATURED STOCK ARTICLE : Quiet Gains Help Generic Drug Firm Rise Above 50-Day Average - 10/21/2014
View all notes |
Set NEW NOTE alert |
CANSLIM.net Company Profile |
SEC
News |
Chart |
Request a new note
C
A N
S L
I M


|
AFSI
-
NASDAQ
Amtrust Financial Svcs
INSURANCE - Property and; Casualty Insurance
|
$49.95
|
+4.52
9.95% |
$50.00
|
1,230,432
184.75% of 50 DAV
50 DAV is 666,000
|
$47.10
6.05%
|
10/17/2014
|
$45.24
|
PP = $46.02
|
|
MB = $48.32
|
Most Recent Note - 10/21/2014 6:01:21 PM
G - Color code is changed to green after rallying above its "max buy" level. Finished at the session high with a gap up and considerable volume-driven gain today hitting a new 52-week high and triggering a technical buy signal.
>>> FEATURED STOCK ARTICLE : Perched Near High After Rebounding From 200-Day Average - 10/17/2014
View all notes |
Set NEW NOTE alert |
CANSLIM.net Company Profile |
SEC
News |
Chart |
Request a new note
C
A N
S L
I M
|
FB
-
NASDAQ
Facebook Inc Cl A
INTERNET
|
$78.69
|
+1.74
2.26% |
$78.74
|
31,988,013
93.93% of 50 DAV
50 DAV is 34,054,000
|
$79.71
-1.28%
|
9/9/2014
|
$76.67
|
PP = $76.84
|
|
MB = $80.68
|
Most Recent Note - 10/21/2014 6:05:13 PM
Y - Wedged near its 52-week high with below average volume behind today's gain. Rebound above the 50 DMA line ($75.83) helped its outlook improve and its color code was changed to yellow.
>>> FEATURED STOCK ARTICLE : Volume-Driven Losses Triggered Sell Signals After Slumping Into Prior Base - 10/16/2014
View all notes |
Set NEW NOTE alert |
CANSLIM.net Company Profile |
SEC
News |
Chart |
Request a new note
C
A N
S L
I M
|
PANW
-
NYSE
Palo Alto Networks
Computer Sftwr-Security
|
$104.68
|
+3.80
3.77% |
$104.88
|
2,166,845
101.40% of 50 DAV
50 DAV is 2,137,000
|
$106.79
-1.98%
|
7/30/2014
|
$84.21
|
PP = $85.88
|
|
MB = $90.17
|
Most Recent Note - 10/21/2014 6:07:07 PM
G - Rallied near its best-ever close with today's 6th consecutive gain. Recent low ($87.83 on 10/13/14) and 50 DMA line define important near-term support where violations would trigger technical sell signals.
>>> FEATURED STOCK ARTICLE : Prompt Rebound Above 50-Day Average an Encouraging Sign of Support - 10/14/2014
View all notes |
Set NEW NOTE alert |
CANSLIM.net Company Profile |
SEC
News |
Chart |
Request a new note
C
A N
S L
I M
|
STRT
-
NASDAQ
Strattec Security Corp
AUTOMOTIVE - Auto Parts
|
$82.82
|
+3.28
4.12% |
$82.84
|
17,829
74.29% of 50 DAV
50 DAV is 24,000
|
$89.87
-7.85%
|
9/19/2014
|
$86.06
|
PP = $89.97
|
|
MB = $94.47
|
Most Recent Note - 10/21/2014 6:08:10 PM
Y - Consolidating above its 50 DMA line where it found prompt support. Recent low ($72.13 on 10/15/14) defines important near-term support to watch. Reporting Sep '14 quarterly earnings on Thursday.
>>> FEATURED STOCK ARTICLE : Building Base-On-Base Pattern Ahead of Earnings News - 10/20/2014
View all notes |
Set NEW NOTE alert |
CANSLIM.net Company Profile |
SEC
News |
Chart |
Request a new note
C
A N
S L
I M
|
Symbol/Exchange
Company Name
Industry Group |
PRICE |
CHANGE
(%Change) |
Day High |
Volume
(% DAV)
(% 50 day avg vol) |
52 Wk Hi
% From Hi |
Featured
Date |
Price
Featured |
Pivot Featured |
|
Max Buy |
|
|
|
THESE ARE NOT BUY RECOMMENDATIONS!
Comments contained in the body of this report are technical
opinions only. The material herein has been obtained
from sources believed to be reliable and accurate, however,
its accuracy and completeness cannot be guaranteed.
This site is not an investment advisor, hence it does
not endorse or recommend any securities or other investments.
Any recommendation contained in this report may not
be suitable for all investors and it is not to be deemed
an offer or solicitation on our part with respect to
the purchase or sale of any securities. All trademarks,
service marks and trade names appearing in this report
are the property of their respective owners, and are
likewise used for identification purposes only.
This report is a service available
only to active Paid Premium Members.
You may opt-out of receiving report notifications
at any time. Questions or comments may be submitted
by writing to Premium Membership Services 665 S.E. 10 Street, Suite 201 Deerfield Beach, FL 33441-5634 or by calling 1-800-965-8307
or 954-785-1121.
|
|
|

