***Last / Change / Volume data in this table is the closing quote data***
Symbol/Exchange
Company Name
Industry Group |
PRICE |
CHANGE
(%Change) |
Day High |
Volume
(% DAV)
(% 50 day avg vol) |
52 Wk Hi
% From Hi |
Featured
Date |
Price
Featured |
Pivot Featured |
|
Max Buy |
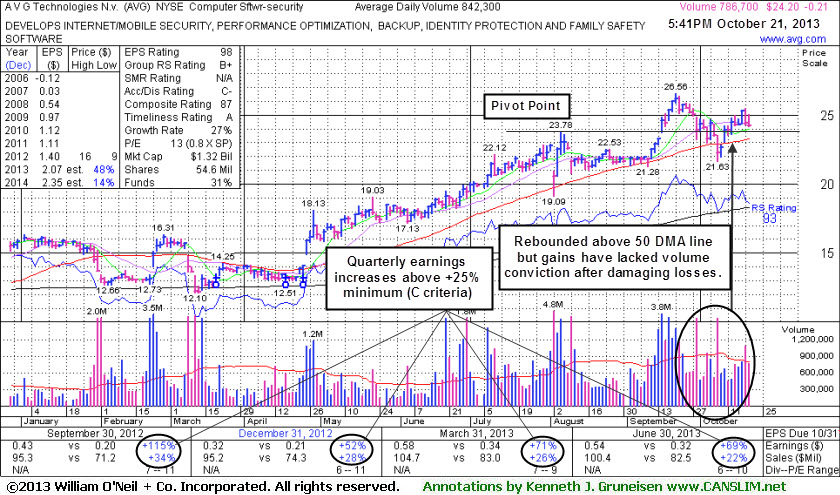
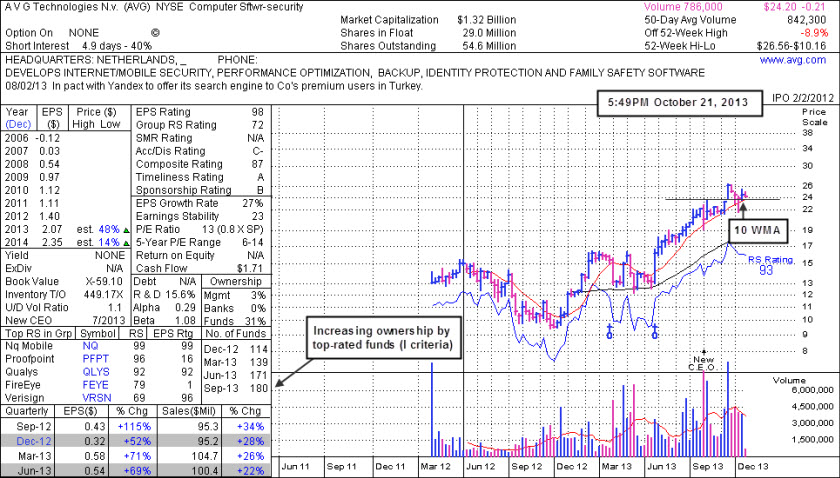
AVG
-
NYSE
A V G Technologies N.V.
INTERNET - Internet Software and Services
|
$24.20
|
-0.21
-0.86% |
$25.05
|
787,352
93.48% of 50 DAV
50 DAV is 842,300
|
$26.56
-8.87%
|
9/13/2013
|
$23.06
|
PP = $23.88
|
|
MB = $25.07
|
 Most Recent Note - 10/21/2013 6:30:30 PM
Y - Consolidating -8.9% off its 52-week high. Wedged higher with gains lacking volume conviction while rebounding after a recent shakeout below its 50 DMA line. See the latest FSU analysis for more details and new annotated daily and weekly graphs.
>>> FEATURED STOCK ARTICLE : Valid Secondary Buy Point After Resilient at 10-Week Moving Average - 10/21/2013
View all notes |
Set NEW NOTE alert |
CANSLIM.net Company Profile |
SEC
News |
Chart |
Request a new note
C
A N
S L
I M


|
BITA
-
NYSE
Bitauto Hldgs Ltd Ads
INTERNET - Internet Information Providers
|
$25.29
|
+0.97
3.99% |
$26.24
|
914,108
136.35% of 50 DAV
50 DAV is 670,400
|
$25.97
-2.61%
|
9/24/2013
|
$16.40
|
PP = $17.31
|
|
MB = $18.18
|
Most Recent Note - 10/21/2013 1:29:11 PM
G - Hitting yet another new high today. Recently noted - "It may go on to produce more climactic gains, however it is very extended from its prior base. Prior highs in the $18 area define initial support to watch on pullbacks."
>>> FEATURED STOCK ARTICLE : Volume-Driven Gains Cleared Latest Pivot Point - 10/2/2013
View all notes |
Set NEW NOTE alert |
CANSLIM.net Company Profile |
SEC
News |
Chart |
Request a new note
C
A N
S L
I M
|
BLOX
-
NYSE
Infoblox Inc
COMPUTER HARDWARE - Networking and Communication Dev
|
$46.46
|
-0.71
-1.51% |
$47.35
|
729,366
95.28% of 50 DAV
50 DAV is 765,500
|
$47.87
-2.95%
|
10/11/2013
|
$43.02
|
PP = $45.60
|
|
MB = $47.88
|
Most Recent Note - 10/17/2013 4:15:13 PM
Y - Hit another new 52-week high today with a 2nd consecutive volume-driven gain while rising above its pivot point clinching a technical buy signal. Highlighted in yellow while building on a flat base in the 10/11/13 mid-day report (read here) and noted - "Subsequent volume-driven gains for new highs may trigger a technical buy signal."
>>> FEATURED STOCK ARTICLE : Finished Another Week Higher With Volume Behind Gains - 10/11/2013
View all notes |
Set NEW NOTE alert |
CANSLIM.net Company Profile |
SEC
News |
Chart |
Request a new note
C
A N
S L
I M
|
CELG
-
NASDAQ
Celgene Corp
DRUGS - Drug Manufacturers - Major
|
$159.23
|
-1.32
-0.82% |
$161.64
|
1,949,176
75.62% of 50 DAV
50 DAV is 2,577,700
|
$160.58
-0.84%
|
9/12/2013
|
$149.50
|
PP = $150.02
|
|
MB = $157.52
|
Most Recent Note - 10/17/2013 4:08:28 PM
G - Wedged above its "max buy" level and its color code is changed to green after inching higher on light volume for a 6th consecutive small gain and a new all-time high. Found support at its 50 DMA line last week as it did on prior pullbacks. The recent low ($143.13 on 10/09/13) defines important near-term support where a subsequent violation may trigger a more worrisome technical sell signal.
>>> FEATURED STOCK ARTICLE : Volume-Driven Gain Challenging New Pivot Point - 9/20/2013
View all notes |
Set NEW NOTE alert |
CANSLIM.net Company Profile |
SEC
News |
Chart |
Request a new note
C
A N
S L
I M
|
EGBN
-
NASDAQ
Eagle Bancorp Inc
BANKING - Regional - Mid-Atlantic Banks
|
$29.49
|
-0.19
-0.64% |
$29.75
|
79,262
115.71% of 50 DAV
50 DAV is 68,500
|
$29.92
-1.44%
|
9/16/2013
|
$27.48
|
PP = $27.77
|
|
MB = $29.16
|
Most Recent Note - 10/17/2013 4:09:32 PM
G - Pulled back today on lighter volume. Hit a new 52-week high on the prior session with a considerable gain backed by only +11% above average volume. Color code was changed to green while getting extended from the prior base. Recent lows and 50 DMA line define near-term support.
>>> FEATURED STOCK ARTICLE : Finished Lower After "Negative Reversal" - 9/16/2013
View all notes |
Set NEW NOTE alert |
CANSLIM.net Company Profile |
SEC
News |
Chart |
Request a new note
C
A N
S L
I M
|
Symbol/Exchange
Company Name
Industry Group |
PRICE |
CHANGE
(%Change) |
Day High |
Volume
(% DAV)
(% 50 day avg vol) |
52 Wk Hi
% From Hi |
Featured
Date |
Price
Featured |
Pivot Featured |
|
Max Buy |
EGOV
-
NASDAQ
N I C Inc
INTERNET - Internet Software and Services
|
$24.80
|
-0.19
-0.76% |
$25.99
|
516,547
172.93% of 50 DAV
50 DAV is 298,700
|
$25.62
-3.20%
|
10/18/2013
|
$25.17
|
PP = $23.66
|
|
MB = $24.84
|
Most Recent Note - 10/21/2013 6:40:54 PM
Y - Hit another new high today then reversed to close in the red, finishing near the session low with a loss on above average volume. See the latest FSU analysis for an annotated weekly graph. Volume was more than 3 times average behind the technical breakout from a "double bottom" base on the prior session.
>>> FEATURED STOCK ARTICLE : Technical Breakout From "Double Bottom" Base on 3 Times Average Volume - 10/18/2013
View all notes |
Set NEW NOTE alert |
CANSLIM.net Company Profile |
SEC
News |
Chart |
Request a new note
C
A N
S L
I M
|
FLT
-
NYSE
Fleetcor Technologies
DIVERSIFIED SERVICES - Business/Management Services
|
$112.32
|
-0.17
-0.15% |
$113.62
|
601,166
85.36% of 50 DAV
50 DAV is 704,300
|
$113.68
-1.20%
|
8/19/2013
|
$99.01
|
PP = $100.97
|
|
MB = $106.02
|
Most Recent Note - 10/16/2013 6:57:58 PM
G - Rebounded further above its 50 DMA line today. A prompt rebound above that important short-term average last week was noted as a sign of support that helped its outlook.
>>> FEATURED STOCK ARTICLE : Extended After 13 Weekly Gains in Span of 14 Weeks - 10/7/2013
View all notes |
Set NEW NOTE alert |
CANSLIM.net Company Profile |
SEC
News |
Chart |
Request a new note
C
A N
S L
I M
|
GNRC
-
NYSE
Generac Hldgs Inc
CONSUMER DURABLES - Electronic Equipment
|
$41.89
|
+0.71
1.72% |
$41.97
|
798,534
117.90% of 50 DAV
50 DAV is 677,300
|
$44.30
-5.44%
|
9/12/2013
|
$41.40
|
PP = $43.27
|
|
MB = $45.43
|
Most Recent Note - 10/17/2013 12:35:53 PM
G - Prior lows in $39 area define important near-term support. Wedging higher with gains lacking great volume conviction, approaching its 50 DMA line which is now downward sloping and may act as resistance. A rebound above the 50 DMA line is needed to help its outlook and technical stance improve. Its Relative Strength rank has slumped to 79, below the 80+ minimum guideline for buy candidates. Disciplined investors limit losses by selling if any stock falls more than -7% from their purchase price.
>>> FEATURED STOCK ARTICLE : Pullback Following Friday's Technical Buy Signal - 9/23/2013
View all notes |
Set NEW NOTE alert |
CANSLIM.net Company Profile |
SEC
News |
Chart |
Request a new note
C
A N
S L
I M
|
JAZZ
-
NASDAQ
Jazz Pharmaceuticals Plc
DRUGS - Biotechnology
|
$85.65
|
+0.64
0.75% |
$85.98
|
495,566
71.58% of 50 DAV
50 DAV is 692,300
|
$93.84
-8.73%
|
9/30/2013
|
$93.20
|
PP = $89.10
|
|
MB = $93.56
|
Most Recent Note - 10/15/2013 7:02:43 PM
G- Consolidating below its 50 DMA line, and a subsequent rebound is needed to help its outlook. That important short-term average acted as resistance after a damaging loss and technical sell signal on 10/08/13. Disciplined investors limit losses if any stock falls more than -7% from their purchase price.
>>> FEATURED STOCK ARTICLE : Strong Finish With High Volume Indicative of Accumulation - 9/30/2013
View all notes |
Set NEW NOTE alert |
CANSLIM.net Company Profile |
SEC
News |
Chart |
Request a new note
C
A N
S L
I M
|
KORS
-
NYSE
Michael Kors Hldgs Ltd
RETAIL - Apparel Stores
|
$77.18
|
+1.94
2.58% |
$77.21
|
3,300,391
110.22% of 50 DAV
50 DAV is 2,994,500
|
$78.62
-1.83%
|
8/6/2013
|
$69.66
|
PP = $66.28
|
|
MB = $69.59
|
Most Recent Note - 10/17/2013 4:04:11 PM
G - Churned heavy volume today and finished with a loss while consolidating near its 50 DMA line. Found prompt support near that short-term average after a damaging loss on 10/08/13 triggered a technical sell signal. Recent low ($70.59 on 10/09/13) defines the next important near-term support area above prior highs in the $66 area.
>>> FEATURED STOCK ARTICLE : Extended From Base After Additional Volume-Driven Gains - 9/27/2013
View all notes |
Set NEW NOTE alert |
CANSLIM.net Company Profile |
SEC
News |
Chart |
Request a new note
C
A N
S L
I M
|
Symbol/Exchange
Company Name
Industry Group |
PRICE |
CHANGE
(%Change) |
Day High |
Volume
(% DAV)
(% 50 day avg vol) |
52 Wk Hi
% From Hi |
Featured
Date |
Price
Featured |
Pivot Featured |
|
Max Buy |
LOPE
-
NASDAQ
Grand Canyon Education
DIVERSIFIED SERVICES - Education and; Training Services
|
$42.06
|
-0.05
-0.12% |
$42.57
|
232,783
71.54% of 50 DAV
50 DAV is 325,400
|
$42.71
-1.53%
|
6/19/2013
|
$31.47
|
PP = $34.17
|
|
MB = $35.88
|
Most Recent Note - 10/16/2013 12:50:22 PM
G - Gapped up today hitting new all-time highs. Fundamental concerns remain while technical action has been reassuring.
>>> FEATURED STOCK ARTICLE : Formed Advanced Base But Fundamental Concerns Remain - 10/14/2013
View all notes |
Set NEW NOTE alert |
CANSLIM.net Company Profile |
SEC
News |
Chart |
Request a new note
C
A N
S L
I M
|
MRLN
-
NASDAQ
Marlin Business Services
DIVERSIFIED SERVICES - Rental and Leasing Services
|
$26.74
|
+0.63
2.41% |
$26.96
|
21,597
65.05% of 50 DAV
50 DAV is 33,200
|
$26.96
-0.82%
|
9/9/2013
|
$23.75
|
PP = $24.03
|
|
MB = $25.23
|
Most Recent Note - 10/17/2013 4:12:12 PM
G - Finished at the session high for a best-ever close today, wedging higher without great volume conviction. Found support at its 50 DMA line on the last pullback. Subsequent losses below the recent low ($23.25) would trigger a more worrisome technical sell signal.
>>> FEATURED STOCK ARTICLE : Faring Better Than Others While Testing 50-Day Average Line - 10/8/2013
View all notes |
Set NEW NOTE alert |
CANSLIM.net Company Profile |
SEC
News |
Chart |
Request a new note
C
A N
S L
I M
|
NOAH
-
NYSE
Noah Holdings Ltd Ads
FINANCIAL SERVICES - Asset Management
|
$20.22
|
-0.84
-3.99% |
$21.50
|
1,834,538
243.37% of 50 DAV
50 DAV is 753,800
|
$22.99
-12.05%
|
10/15/2013
|
$19.10
|
PP = $18.33
|
|
MB = $19.25
|
Most Recent Note - 10/21/2013 1:27:55 PM
Y - Pulling back further today with above average volume, its color code is changed to yellow after dipping near its "max buy" level. There was a "negative reversal" on the prior session after hitting a new 52-week high following an impressive streak of volume-driven gains while noted - "Disciplined investors avoid chasing stocks extended more than +5% above their pivot point. Prior highs in the $18 area define initial support to watch on pullbacks."
>>> FEATURED STOCK ARTICLE : Finished Strong With Gain on 4 Times Average Volume - 10/15/2013
View all notes |
Set NEW NOTE alert |
CANSLIM.net Company Profile |
SEC
News |
Chart |
Request a new note
C
A N
S L
I M
|
OII
-
NYSE
Oceaneering Intl Inc
ENERGY - Oil and Gas Drilling and Explorati
|
$85.95
|
-0.32
-0.37% |
$87.64
|
855,695
139.66% of 50 DAV
50 DAV is 612,700
|
$86.32
-0.43%
|
10/16/2013
|
$83.08
|
PP = $84.74
|
|
MB = $88.98
|
Most Recent Note - 10/18/2013 5:07:06 PM
Y - Gapped up today and rallied for a new 52-week high with +83% above average volume, breaking out above the pivot point based on its 9/18/13 high plus 10 cents triggering a technical buy signal. Prior highs in the $84 area define initial support to watch on pullbacks.
>>> FEATURED STOCK ARTICLE : Forming Set-Up Above 50-Day Moving Average Line - 10/16/2013
View all notes |
Set NEW NOTE alert |
CANSLIM.net Company Profile |
SEC
News |
Chart |
Request a new note
C
A N
S L
I M
|
PCLN
-
NASDAQ
Priceline.Com Inc
INTERNET - Internet Software and Services
|
$1,087.09
|
+38.84
3.71% |
$1,089.75
|
700,627
118.27% of 50 DAV
50 DAV is 592,400
|
$1,074.89
1.13%
|
9/13/2013
|
$966.82
|
PP = $995.08
|
|
MB = $1,044.83
|
Most Recent Note - 10/21/2013 1:30:46 PM
G - Color code is changed to green while getting extended from any sound base. Found support near its 50 DMA line after enduring damaging distributional losses.
>>> FEATURED STOCK ARTICLE : Wedging to New Highs With Gains Lacking Volume Conviction - 9/19/2013
View all notes |
Set NEW NOTE alert |
CANSLIM.net Company Profile |
SEC
News |
Chart |
Request a new note
C
A N
S L
I M
|
Symbol/Exchange
Company Name
Industry Group |
PRICE |
CHANGE
(%Change) |
Day High |
Volume
(% DAV)
(% 50 day avg vol) |
52 Wk Hi
% From Hi |
Featured
Date |
Price
Featured |
Pivot Featured |
|
Max Buy |
PRAA
-
NASDAQ
Portfolio Recovery Assoc
DIVERSIFIED SERVICES - Business/Management Services
|
$62.00
|
-0.13
-0.21% |
$62.39
|
402,955
92.02% of 50 DAV
50 DAV is 437,900
|
$62.16
-0.26%
|
10/17/2013
|
$60.75
|
PP = $61.70
|
|
MB = $64.79
|
Most Recent Note - 10/18/2013 5:16:37 PM
Y - Wedged to a new 52-week high with today's 3rd consecutive gain lacking great volume conviction. Pivot point cited was based on its 9/26/13 high plus 10 cents after forming an advanced "3-weeks tight" base. Subsequent volume-driven gains may clinch a proper new (or add-on) technical buy signal.
>>> FEATURED STOCK ARTICLE : Wedging to New Highs With Gains Lacking Volume Conviction - 9/26/2013
View all notes |
Set NEW NOTE alert |
CANSLIM.net Company Profile |
SEC
News |
Chart |
Request a new note
C
A N
S L
I M
|
PRLB
-
NYSE
Proto Labs Inc
MANUFACTURING - Small Tools and Accessories
|
$86.47
|
+4.18
5.08% |
$86.85
|
408,705
121.53% of 50 DAV
50 DAV is 336,300
|
$82.51
4.80%
|
7/29/2013
|
$64.86
|
PP = $67.50
|
|
MB = $70.88
|
Most Recent Note - 10/21/2013 6:36:02 PM
G - Gapped up and hit a new high with above average volume behind today's 3rd consecutive gain. Getting more extended while rallying since finding prompt support at its 50 DMA line.
>>> FEATURED STOCK ARTICLE : Extended Following Additional Volume-Driven Gains - 9/25/2013
View all notes |
Set NEW NOTE alert |
CANSLIM.net Company Profile |
SEC
News |
Chart |
Request a new note
C
A N
S L
I M
|
SFUN
-
NYSE
Soufun Hldgs Ltd Ads A
INTERNET - Internet Information Providers
|
$55.55
|
-1.66
-2.90% |
$58.25
|
741,939
54.30% of 50 DAV
50 DAV is 1,366,400
|
$59.50
-6.64%
|
10/17/2013
|
$58.02
|
PP = $53.87
|
|
MB = $56.56
|
Most Recent Note - 10/21/2013 6:37:38 PM
Y - Pulled back today on lighter than average volume following considerable volume-driven gains to new highs. Prior highs in the $53 area define initial support to watch.
>>> FEATURED STOCK ARTICLE : Following Great Rally No New Base Has Been Formed - 10/1/2013
View all notes |
Set NEW NOTE alert |
CANSLIM.net Company Profile |
SEC
News |
Chart |
Request a new note
C
A N
S L
I M
|
SSNC
-
NASDAQ
S S & C Technologies
COMPUTER SOFTWARE and SERVICES - Application Software
|
$38.94
|
+0.11
0.28% |
$39.32
|
251,391
61.37% of 50 DAV
50 DAV is 409,600
|
$39.94
-2.50%
|
9/5/2013
|
$36.01
|
PP = $38.90
|
|
MB = $40.85
|
Most Recent Note - 10/15/2013 7:04:07 PM
G - Consolidating near its 50 DMA line with gains on light volume after losses on higher volume triggered a technical sell signal. Completed a Secondary Offering on 9/20/13 while perched at all-time highs.
>>> FEATURED STOCK ARTICLE : Finding Support Near 50-Day Average After Secondary Offering - 10/4/2013
View all notes |
Set NEW NOTE alert |
CANSLIM.net Company Profile |
SEC
News |
Chart |
Request a new note
C
A N
S L
I M
|
SSYS
-
NASDAQ
Stratasys Ltd
COMPUTER HARDWARE - Computer Peripherals
|
$111.38
|
+0.53
0.48% |
$112.94
|
615,364
52.14% of 50 DAV
50 DAV is 1,180,200
|
$113.49
-1.86%
|
10/11/2013
|
$102.94
|
PP = $105.38
|
|
MB = $110.65
|
Most Recent Note - 10/15/2013 7:12:00 PM
Y - Rallied further above its 50 DMA line today and traded +27% above average volume while wedging above the pivot point of its "double bottom" base. Gains must have at least +40% above average volume to trigger a proper technical buy signal, so confirming gains with higher volume would be a welcome reassurance in the days to come.
>>> FEATURED STOCK ARTICLE : Faltering and Relative Strength Waning After Offering - 10/9/2013
View all notes |
Set NEW NOTE alert |
CANSLIM.net Company Profile |
SEC
News |
Chart |
Request a new note
C
A N
S L
I M
|
Symbol/Exchange
Company Name
Industry Group |
PRICE |
CHANGE
(%Change) |
Day High |
Volume
(% DAV)
(% 50 day avg vol) |
52 Wk Hi
% From Hi |
Featured
Date |
Price
Featured |
Pivot Featured |
|
Max Buy |
STMP
-
NASDAQ
Stamps.Com Inc
INTERNET - Internet Software and Services
|
$46.06
|
-0.56
-1.20% |
$47.21
|
157,438
160.49% of 50 DAV
50 DAV is 98,100
|
$46.89
-1.77%
|
9/24/2013
|
$45.54
|
PP = $46.57
|
|
MB = $48.90
|
Most Recent Note - 10/18/2013 5:09:26 PM
Y - Rallied above the previously cited pivot point with a solid gain today backed by +62% above average volume clinching a technical buy signal. No resistance remains due to overhead supply.
>>> FEATURED STOCK ARTICLE : Forming New Set-Up After 50-Day Average Acted as Support - 9/24/2013
View all notes |
Set NEW NOTE alert |
CANSLIM.net Company Profile |
SEC
News |
Chart |
Request a new note
C
A N
S L
I M
|
TBBK
-
NASDAQ
Bancorp Inc
BANKING - Regional - Mid-Atlantic Banks
|
$18.88
|
+0.27
1.45% |
$19.00
|
75,817
42.26% of 50 DAV
50 DAV is 179,400
|
$18.99
-0.58%
|
9/4/2013
|
$16.26
|
PP = $16.79
|
|
MB = $17.63
|
Most Recent Note - 10/15/2013 7:07:51 PM
G - Pulled back today on lighter volume following 4 consecutive gains. Recent lows in the $17.25 area define near-term support above its 50 DMA line ($16.78).
>>> FEATURED STOCK ARTICLE : Encountering Distributional Pressure While Consolidating Above Prior Highs - 10/3/2013
View all notes |
Set NEW NOTE alert |
CANSLIM.net Company Profile |
SEC
News |
Chart |
Request a new note
C
A N
S L
I M
|
TNGO
-
NASDAQ
Tangoe Inc
COMPUTER SOFTWARE and SERVICES - Technical and System Software
|
$24.71
|
-0.63
-2.49% |
$26.05
|
731,473
123.79% of 50 DAV
50 DAV is 590,900
|
$26.03
-5.07%
|
9/12/2013
|
$21.30
|
PP = $23.15
|
|
MB = $24.31
|
Most Recent Note - 10/18/2013 5:11:03 PM
G - Hit another new 52-week high with another volume-driven gain lifting it further beyond its "max buy" level. Disciplined investors avoid chasing extended stocks.
>>> FEATURED STOCK ARTICLE : Gains Today Lacked Volume Conviction of Institutional Demand - 9/17/2013
View all notes |
Set NEW NOTE alert |
CANSLIM.net Company Profile |
SEC
News |
Chart |
Request a new note
C
A N
S L
I M
|
ULTI
-
NASDAQ
Ultimate Software Group
INTERNET - Internet Software and Services
|
$149.44
|
+1.04
0.70% |
$150.47
|
186,383
142.17% of 50 DAV
50 DAV is 131,100
|
$151.08
-1.09%
|
10/16/2013
|
$142.95
|
PP = $151.18
|
|
MB = $158.74
|
Most Recent Note - 10/18/2013 5:12:48 PM
Y - Rallied near its best-ever close with and finished near the session high with a solid gain backed by +36% above average volume. Subsequent volume-driven gains above the pivot point may trigger a technical buy signal. See the latest FSU analysis for more details and annotated daily and weekly graphs.
>>> FEATURED STOCK ARTICLE : Hovering Less Than -5% From 52-Week High - 10/17/2013
View all notes |
Set NEW NOTE alert |
CANSLIM.net Company Profile |
SEC
News |
Chart |
Request a new note
C
A N
S L
I M
|
VRX
-
NYSE
Valeant Pharmaceuticals
DRUGS - Drug Manufacturers - Other
|
$112.30
|
-0.72
-0.64% |
$115.40
|
965,785
85.62% of 50 DAV
50 DAV is 1,128,000
|
$113.79
-1.31%
|
9/11/2013
|
$100.26
|
PP = $105.50
|
|
MB = $110.78
|
Most Recent Note - 10/17/2013 4:00:18 PM
G- Inching higher with light volume, poised for a best-ever close and its color code is changed to green. Found support above prior highs defining important support in the $105 area.
>>> FEATURED STOCK ARTICLE : Found Support Above Prior Highs on Pullback - 10/10/2013
View all notes |
Set NEW NOTE alert |
CANSLIM.net Company Profile |
SEC
News |
Chart |
Request a new note
C
A N
S L
I M
|
Symbol/Exchange
Company Name
Industry Group |
PRICE |
CHANGE
(%Change) |
Day High |
Volume
(% DAV)
(% 50 day avg vol) |
52 Wk Hi
% From Hi |
Featured
Date |
Price
Featured |
Pivot Featured |
|
Max Buy |
YNDX
-
NASDAQ
Yandex N V Class A
INTERNET - Internet Information Providers
|
$41.04
|
+0.24
0.58% |
$41.96
|
2,911,762
121.75% of 50 DAV
50 DAV is 2,391,600
|
$41.32
-0.68%
|
9/5/2013
|
$34.24
|
PP = $34.79
|
|
MB = $36.53
|
Most Recent Note - 10/18/2013 5:14:19 PM
G - Hit another new 52-week high today with a gap up and volume-driven gain. Extended from any sound base. Found prompt support above prior highs in the $34 area and its 50 DMA line.
>>> FEATURED STOCK ARTICLE : Gains Lacked Volume Conviction While Hitting New Highs - 9/18/2013
View all notes |
Set NEW NOTE alert |
CANSLIM.net Company Profile |
SEC
News |
Chart |
Request a new note
C
A N
S L
I M
|