You are not logged in.
This means you
CAN ONLY VIEW reports that were published prior to Friday, March 21, 2025.
You
MUST UPGRADE YOUR MEMBERSHIP if you want to see any current reports.
AFTER MARKET UPDATE - THURSDAY, OCTOBER 20TH, 2011
Previous After Market Report Next After Market Report >>>
|
|
|
|
DOW |
+37.16 |
11,541.78 |
+0.32% |
|
Volume |
958,107,040 |
-1% |
|
Volume |
1,987,340,470 |
+3% |
|
NASDAQ |
-5.42 |
2,598.62 |
-0.21% |
|
Advancers |
1,800 |
58% |
|
Advancers |
1,191 |
46% |
|
S&P 500 |
+5.51 |
1,215.39 |
+0.46% |
|
Decliners |
1,183 |
38% |
|
Decliners |
1,290 |
49% |
|
Russell 2000 |
+2.05 |
696.42 |
+0.30% |
|
52 Wk Highs |
9 |
|
|
52 Wk Highs |
16 |
|
|
S&P 600 |
+1.74 |
384.19 |
+0.45% |
|
52 Wk Lows |
26 |
|
|
52 Wk Lows |
45 |
|
|
 |
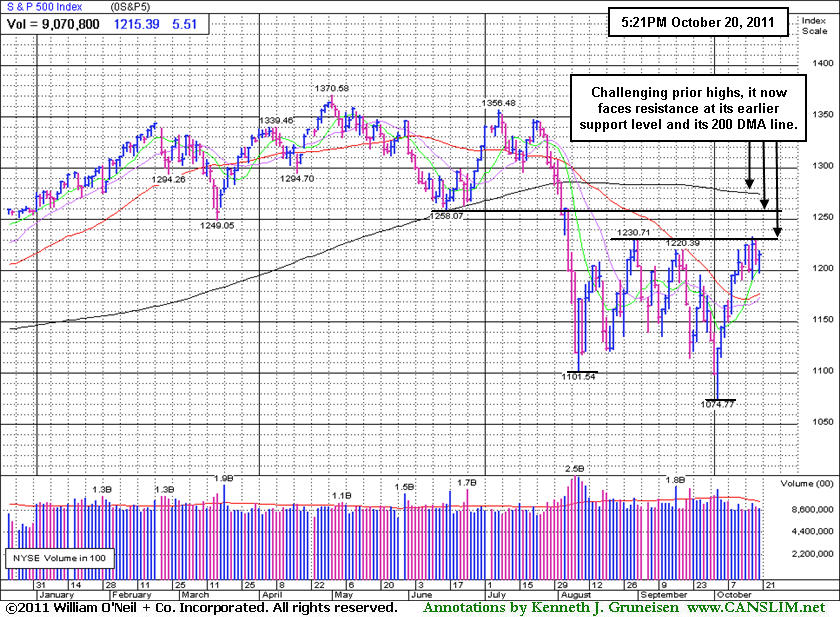
Major Averages Ended Mixed While Leadership Waned
Kenneth J. Gruneisen - Passed the CAN SLIM® Master's Exam
The major averages ended Thursday's session mixed and little changed. The trading volume total reported on the NYSE was slightly lower while volume was slightly higher on the Nasdaq exchange versus the prior session. Advancing issues beat decliners by 3-2 on the NYSE. Declining issues held a narrow lead on the Nasdaq exchange. New 52-week lows outnumbered new 52-week highs on the NYSE and on the Nasdaq exchange. There were only 6 high-ranked companies from the CANSLIM.net Leaders List that made new 52-week highs and appeared on the CANSLIM.net BreakOuts Page, down sharply from the prior session total of 26 stocks. For the current market rally (M criteria in confirmed uptrend) to be sustained it is critically important to see a healthy crop of strong leaders hitting new 52-week highs, while without a solid expansion in the new highs list the rally's fate may likely be doomed. There were gains for 6 of the 8 high-ranked companies currently included on the Featured Stocks Page.
Skepticism about the outcome of this weekend's European summit weighed on Wall Street. The European Union postponed a decision on the debt crisis until next Wednesday, although the summit will go on as scheduled. Doubts were emerging about a possible agreement to solve the debt crisis, and Greece was shaken by escalating protests as lawmakers vote on a new round of austerity measures. Yields on 10-year Italian bonds topped 6% for the first time in more than two months.
A key economic report gave the U.S. market only a brief lift. The October Philly Fed business activity index turned positive, surprising analysts who expected another negative reading. Other reports signaled no dramatic changes. Initial U.S. jobless claims of 406,000 were slightly higher than expected in the latest week and remained above levels that would suggest meaningful improvement in the labor market. September leading economic indicators rose 0.2%, slightly below expectations, but still suggesting continued economic expansion. Existing home sales in September fell 3%, largely in line with forecasts. Oil prices turned lower after Libyan rebels announced that Moammar Qaddafi had been killed.
Philip Morris International (PMI +3.27%) was a star on the earnings front after profits beat expectations. Ebay Inc (EBAY -3.10%) slumped after forecasting sales and profit that missed some analysts' estimates. Airline and railroad stocks moved forward. Southwest Airlines Co (LUV +4.48%) rose after reporting better-than-expected earnings and announcing a fare sale to stimulate travel demand. Union Pacific Corp (UNP +3.99%) advanced after its profits and revenues beat forecasts. Hospital stocks gained. New federal regulations will allow hospital chains to gain bigger financial rewards by forming joint ventures with doctors to improve care and cut costs. Financials were the best-performing sector. Results from Fifth Third Bancorp (FITB +9.10%) were well received.
The October 2011 issue of our monthly newsletter CANSLIM.net News will be published soon. The Q3 2011 Webcast (aired on September 28th) is now available "ON DEMAND" - (CLICK HERE) It provides an informative review of current market conditions, leading groups, and best buy candidates. All upgraded members are eligible to access the webcast presentation at no additional cost! Via the Premium Member Homepage links to all prior reports and webcasts are always available.
PICTURED: The S&P 500 Index has been trading above its 50-day moving average (DMA) line for nearly 2 weeks, and while challenging prior highs, it now faces near-term resistance at its earlier support level and its 200 DMA line.
|
 Kenneth J. Gruneisen started out as a licensed stockbroker in August 1987, a couple of months prior to the historic stock market crash that took the Dow Jones Industrial Average down -22.6% in a single day. He has published daily fact-based fundamental and technical analysis on high-ranked stocks online for two decades. Through FACTBASEDINVESTING.COM, Kenneth provides educational articles, news, market commentary, and other information regarding proven investment systems that work in good times and bad.
Comments contained in the body of this report are technical opinions only and are not necessarily those of Gruneisen Growth Corp. The material herein has been obtained from sources believed to be reliable and accurate, however, its accuracy and completeness cannot be guaranteed. Our firm, employees, and customers may effect transactions, including transactions contrary to any recommendation herein, or have positions in the securities mentioned herein or options with respect thereto. Any recommendation contained in this report may not be suitable for all investors and it is not to be deemed an offer or solicitation on our part with respect to the purchase or sale of any securities. |
|
 |
Financial Groups Provided Leadership
Kenneth J. Gruneisen - Passed the CAN SLIM® Master's Exam
The Bank Index ($BKX +1.89%) and Broker/Dealer Index ($XBD +1.16%) were influential leaders on Thursday and the Retail Index ($RLX +0.78%) also gave the major averages a lift. But while the Internet Index ($IIX +0.13%) inched higher and the Biotechnology Index ($BTK +0.91%) posted a modest gain, the Networking Index ($NWX -1.79%) and Semiconductor Index ($SOX -1.70%) dragged the tech sector lower. The Gold & Silver Index ($XAU -0.69%) edged lower, meanwhile the Healthcare Index ($HMO +1.21%) rose and gains in energy-related shares boosted the Integrated Oil Index ($XOI +0.65%) and Oil Services Index ($OSX +1.52%).
Charts courtesy www.stockcharts.com
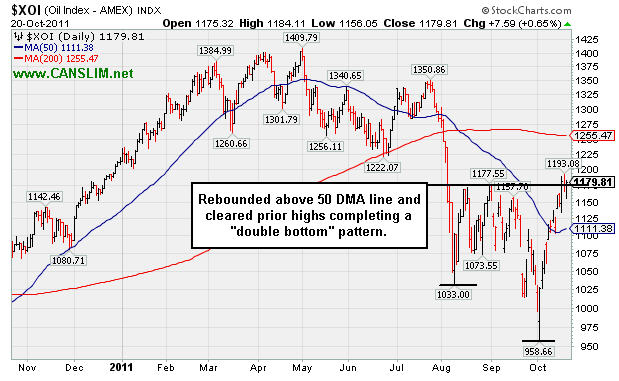
PICTURED: The Integrated Oil Index ($XOI +0.65%) has rebounded above its 50-day moving average (DMA) line and cleared prior highs completing a "double bottom" pattern.
| Oil Services |
$OSX |
215.23 |
+3.23 |
+1.52% |
-12.19% |
| Healthcare |
$HMO |
1,928.76 |
+23.05 |
+1.21% |
+13.99% |
| Integrated Oil |
$XOI |
1,179.81 |
+7.59 |
+0.65% |
-2.75% |
| Semiconductor |
$SOX |
363.88 |
-6.28 |
-1.70% |
-11.64% |
| Networking |
$NWX |
224.06 |
-4.08 |
-1.79% |
-20.14% |
| Internet |
$IIX |
287.15 |
+0.38 |
+0.13% |
-6.69% |
| Broker/Dealer |
$XBD |
85.49 |
+0.98 |
+1.16% |
-29.65% |
| Retail |
$RLX |
536.28 |
+4.17 |
+0.78% |
+5.49% |
| Gold & Silver |
$XAU |
181.46 |
-1.26 |
-0.69% |
-19.91% |
| Bank |
$BKX |
38.31 |
+0.71 |
+1.89% |
-26.62% |
| Biotech |
$BTK |
1,119.48 |
+10.12 |
+0.91% |
-13.73% |
|
|
|
 |
Trouble Attracting New Interest for Heavily Owned Tech Leader
Kenneth J. Gruneisen - Passed the CAN SLIM® Master's Exam
Via the Company Profile pages members can review any stock's extensive history of prior analysis and notes via a tab labeled "Featured Articles and Graphs". It is a good idea to review prior reports that have been published and do some of your own "homework" to be familiar with any companies you might maintain on an active watchlist of possible buy candidates. Ongoing coverage also acknowledges technical sell signals and flaws which might be of concern.
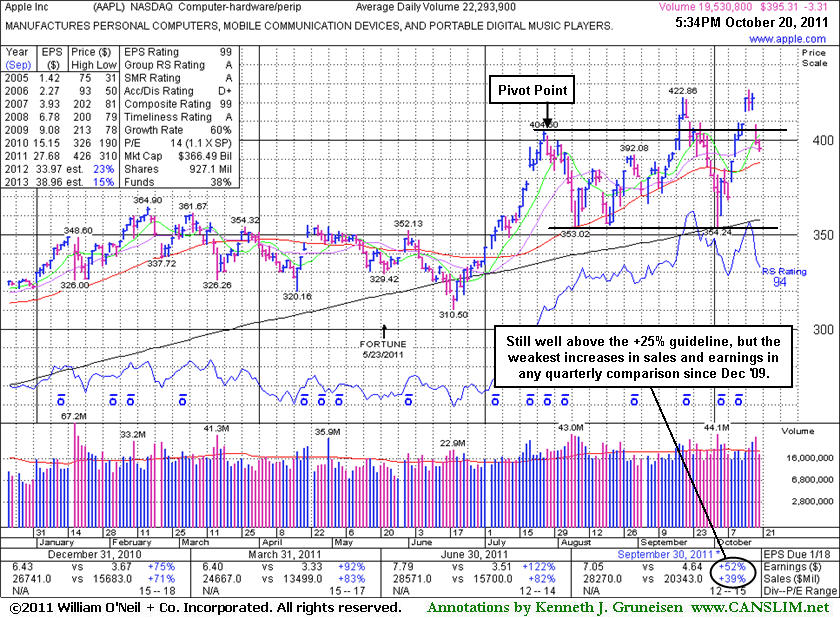
Apple Inc (AAPL -$3.31 or -0.83% to $395.31) fell today on lighter volume. On the prior session it gapped down after reporting earnings +52% on +39% sales revenues for the quarter ended September 30, 2011 versus the year ago period, marking the tech leader's weakest increases in sales and earnings in any quarter since the Dec '09. It has not formed a sound base pattern.
Co-founder Steve Jobs lit up headlines with news of his passing (age 56) at the time of its last appearance in this FSU section on 10/06/11 with an annotated daily graph under the the headline, "Fundamentally Strong Tech Leader Forming Possible 'Double Top'". It found support near its 200-day moving average (DMA) line and narrowly avoided undercutting the mid-point (low point) between the 2 prior chart highs, a violation which would have completed the noted double top pattern and triggered a technical sell signal. Half-hearted (volume-wise) gains actually helped it rally back again for yet another new all-time high in the interim, before its rare earnings disappointment. The miss is likely to be dismissed by many optimistic investors who are now hearing incessant media coverage of the latest iPhone release. However, disciplined investors probably did not do any recent accumulating, and they might sooner choose a fresh breakout which more closely matches the winning models of the fact-based investment system.
Prior reports have cautioned "With the largest market cap of all publicly traded firms, AAPL does not fit the mold of a small growth firm unknown by the institutional crowd which would be more typical of the winning models of the fact-based investment system." It was noted as heavily owned by the institutional crowd, with 4,374 top-rated funds reportedly owning its shares as of Jun '11. Despite such concerns, the 9/16/11 mid-day report (read here) included it highlighted in yellow with pivot point based on its 52-week high plus 10 cents, as it was cautiously noted - "A gain with at least +40% above average volume while rising above its pivot point may trigger a technical buy signal." However, powerful gains did not arrive to trigger a convincing buy signal. Also, the number of top-rated funds owning its shares has fallen to 4,331 as of Sep '11.
|
|
|
Color Codes Explained :
Y - Better candidates highlighted by our
staff of experts.
G - Previously featured
in past reports as yellow but may no longer be buyable under the
guidelines.
***Last / Change / Volume data in this table is the closing quote data***
Symbol/Exchange
Company Name
Industry Group |
PRICE |
CHANGE
(%Change) |
Day High |
Volume
(% DAV)
(% 50 day avg vol) |
52 Wk Hi
% From Hi |
Featured
Date |
Price
Featured |
Pivot Featured |
|
Max Buy |
AAPL
-
NASDAQ
Apple Inc
COMPUTER HARDWARE - Personal Computers
|
$395.31
|
-3.31
-0.83% |
$400.35
|
19,618,176
88.00% of 50 DAV
50 DAV is 22,293,900
|
$426.70
-7.36%
|
9/16/2011
|
$399.14
|
PP = $404.60
|
|
MB = $424.83
|
 Most Recent Note - 10/20/2011 6:27:57 PM
G - It has not formed a sound base pattern and ownership by top-rated funds has fallen some. See the latest FSU analysis for more details and a new annotated graph.
>>> The latest Featured Stock Update with an annotated graph appeared on 10/20/2011. Click here.
View all notes |
Alert me of new notes |
CANSLIM.net Company Profile |
SEC |
Zacks Reports |
StockTalk |
News |
Chart |
Request a new note
C
A N
S L
I M


|
ALXN
-
NASDAQ
Alexion Pharmaceuticals
DRUGS - Drug Manufacturers - Other
|
$66.76
|
+0.70
1.06% |
$69.79
|
2,379,065
151.81% of 50 DAV
50 DAV is 1,567,100
|
$70.20
-4.90%
|
9/15/2011
|
$63.20
|
PP = $60.81
|
|
MB = $63.85
|
Most Recent Note - 10/20/2011 11:56:14 AM
G - Off its earlier high following a small gap today after reporting earnings +48% on +44% sales revenues for the quarter ended September 30, 2011 versus the year ago period. Hovering in a tight range near its all-time high, this high-ranked Medical - Biomed/Biotech group leader is extended from its prior base. Support to watch includes prior resistance in the $59-60 area and its upwardly tilted 50 DMA line.
>>> The latest Featured Stock Update with an annotated graph appeared on 10/18/2011. Click here.
View all notes |
Alert me of new notes |
CANSLIM.net Company Profile |
SEC |
Zacks Reports |
StockTalk |
News |
Chart |
Request a new note
C
A N
S L
I M
|
CELG
-
NASDAQ
Celgene Corp
DRUGS - Drug Manufacturers - Major
|
$65.95
|
+0.64
0.98% |
$66.97
|
2,633,148
66.89% of 50 DAV
50 DAV is 3,936,700
|
$67.01
-1.58%
|
9/16/2011
|
$61.21
|
PP = $62.59
|
|
MB = $65.72
|
Most Recent Note - 10/20/2011 6:35:31 PM
G - Traded within one cent of its 52-week high today yet finished near the middle of its intra-day range with a small gain on below average volume.
>>> The latest Featured Stock Update with an annotated graph appeared on 10/14/2011. Click here.
View all notes |
Alert me of new notes |
CANSLIM.net Company Profile |
SEC |
Zacks Reports |
StockTalk |
News |
Chart |
Request a new note
C
A N
S L
I M
|
ISRG
-
NASDAQ
Intuitive Surgical Inc
HEALTH SERVICES - Medical Appliances and Equipment
|
$418.41
|
+0.79
0.19% |
$422.50
|
442,784
97.51% of 50 DAV
50 DAV is 454,100
|
$425.49
-1.66%
|
10/19/2011
|
$424.69
|
PP = $415.29
|
|
MB = $436.05
|
Most Recent Note - 10/19/2011 6:13:03 PM
Y - Color code was changed to yellow in the mid-day report earlier today with a pivot point cited based on its 52-week high plus 10 cents. Its breakaway gap for new 52-week and all-time highs was backed by more than 3 times average volume, triggering a technical buy signal. It reported earnings +43% on +30% sales revenues for the quarter ended September 30, 2011 versus the year ago period. Accelerating sales revenues and earnings increases are a reassuring sign, and it has a great annual earnings (A criteria) history. Small supply (S criteria) of only 39.1 million shares can lead to greater volatility. Found support near its 200 DMA line during its choppy consolidation since noted in the 7/28/11 mid-day report following the previously noted "breakaway gap" and volume-driven gains to new high territory. See the latest FSU analysis for more details and a new annotated graph.
>>> The latest Featured Stock Update with an annotated graph appeared on 10/19/2011. Click here.
View all notes |
Alert me of new notes |
CANSLIM.net Company Profile |
SEC |
Zacks Reports |
StockTalk |
News |
Chart |
Request a new note
C
A N
S L
I M
|
LABL
-
NASDAQ
Multi Color Corp
CONSUMER NON-DURABLES - Packaging and Containers
|
$25.84
|
-0.27
-1.03% |
$26.26
|
23,423
39.43% of 50 DAV
50 DAV is 59,400
|
$28.00
-7.71%
|
10/17/2011
|
$27.81
|
PP = $28.10
|
|
MB = $29.51
|
Most Recent Note - 10/19/2011 4:17:08 PM
Y - Closed near the session low today with a second consecutive loss on below average volume, finishing -6.8% off its 52-week high. During a choppy 10-week consolidation its 200 DMA line acted as support. Little overhead supply remains to act as resistance. Subsequent volume-driven gains into new high ground may trigger a technical buy signal. Annual earnings (A criteria) history included a slight dip in FY '09 earnings.
>>> The latest Featured Stock Update with an annotated graph appeared on 10/17/2011. Click here.
View all notes |
Alert me of new notes |
CANSLIM.net Company Profile |
SEC |
Zacks Reports |
StockTalk |
News |
Chart |
Request a new note
C
A N
S L
I M
|
Symbol/Exchange
Company Name
Industry Group |
PRICE |
CHANGE
(%Change) |
Day High |
Volume
(% DAV)
(% 50 day avg vol) |
52 Wk Hi
% From Hi |
Featured
Date |
Price
Featured |
Pivot Featured |
|
Max Buy |
MG
-
NYSE
Mistras Group Inc
DIVERSIFIED SERVICES - Bulding and Faci;ity Management Services
|
$22.97
|
+0.28
1.23% |
$23.51
|
187,037
78.29% of 50 DAV
50 DAV is 238,900
|
$23.28
-1.34%
|
8/10/2011
|
$17.89
|
PP = $17.58
|
|
MB = $18.46
|
Most Recent Note - 10/19/2011 12:33:46 PM
G - Inching up to yet another new all-time high today, getting more extended from its prior base. Prior highs in the $20-21 area define initial chart support to watch above its 50 DMA line.
>>> The latest Featured Stock Update with an annotated graph appeared on 10/12/2011. Click here.
View all notes |
Alert me of new notes |
CANSLIM.net Company Profile |
SEC |
Zacks Reports |
StockTalk |
News |
Chart |
Request a new note
C
A N
S L
I M
|
OPNT
-
NASDAQ
Opnet Technologies
INTERNET - Internet Software and Services
|
$39.90
|
+1.10
2.84% |
$40.31
|
174,436
109.43% of 50 DAV
50 DAV is 159,400
|
$42.51
-6.14%
|
10/11/2011
|
$38.45
|
PP = $42.02
|
|
MB = $44.12
|
Most Recent Note - 10/20/2011 6:30:41 PM
Y - Posted a solid gain with better volume today. Disciplined investors still watch for gains above a stock's pivot point to trigger a proper technical buy signal before taking action.
>>> The latest Featured Stock Update with an annotated graph appeared on 10/11/2011. Click here.
View all notes |
Alert me of new notes |
CANSLIM.net Company Profile |
SEC |
Zacks Reports |
StockTalk |
News |
Chart |
Request a new note
C
A N
S L
I M
|
V
-
NYSE
Visa Inc Cl A
DIVERSIFIED SERVICES - Business/Management Services
|
$91.44
|
+1.36
1.51% |
$91.79
|
1,918,988
34.31% of 50 DAV
50 DAV is 5,593,700
|
$94.75
-3.49%
|
9/20/2011
|
$93.91
|
PP = $90.93
|
|
MB = $95.48
|
Most Recent Note - 10/20/2011 6:32:53 PM
G - Posted a small gain today with lighter than average volume after a damaging distribution day on the prior session. Choppy action in recent weeks is not recognized as a sound base pattern.
>>> The latest Featured Stock Update with an annotated graph appeared on 10/10/2011. Click here.
View all notes |
Alert me of new notes |
CANSLIM.net Company Profile |
SEC |
Zacks Reports |
StockTalk |
News |
Chart |
Request a new note
C
A N
S L
I M
|
|
|
|
THESE ARE NOT BUY RECOMMENDATIONS!
Comments contained in the body of this report are technical
opinions only. The material herein has been obtained
from sources believed to be reliable and accurate, however,
its accuracy and completeness cannot be guaranteed.
This site is not an investment advisor, hence it does
not endorse or recommend any securities or other investments.
Any recommendation contained in this report may not
be suitable for all investors and it is not to be deemed
an offer or solicitation on our part with respect to
the purchase or sale of any securities. All trademarks,
service marks and trade names appearing in this report
are the property of their respective owners, and are
likewise used for identification purposes only.
This report is a service available
only to active Paid Premium Members.
You may opt-out of receiving report notifications
at any time. Questions or comments may be submitted
by writing to Premium Membership Services 665 S.E. 10 Street, Suite 201 Deerfield Beach, FL 33441-5634 or by calling 1-800-965-8307
or 954-785-1121.
|
|
|

