You are not logged in.
This means you
CAN ONLY VIEW reports that were published prior to Sunday, February 25, 2024.
You
MUST UPGRADE YOUR MEMBERSHIP if you want to see any current reports.
AFTER MARKET UPDATE - MONDAY, OCTOBER 19TH, 2020
Previous After Market Report Next After Market Report >>>
|
|
|
|
DOW |
-410.89 |
28,195.42 |
-1.44% |
|
Volume |
833,981,000 |
-6% |
|
Volume |
3,431,380,000 |
+10% |
|
NASDAQ |
-190.54 |
11,481.02 |
-1.63% |
|
Advancers |
811 |
27% |
|
Advancers |
1,091 |
32% |
|
S&P 500 |
-56.89 |
3,426.92 |
-1.63% |
|
Decliners |
2,178 |
73% |
|
Decliners |
2,285 |
68% |
|
Russell 2000 |
-20.18 |
1,613.63 |
-1.24% |
|
52 Wk Highs |
86 |
|
|
52 Wk Highs |
121 |
|
|
S&P 600 |
-10.62 |
913.09 |
-1.15% |
|
52 Wk Lows |
21 |
|
|
52 Wk Lows |
32 |
|
|
The major indices have shown improvement and have resumed a market uptrend as leadership has improved. Disciplined investors carefully may buy leading stocks on a case-by-case basis. Always remain ready to reduce market exposure in the event of any more substantial market downdrafts.
|
 |
Leadership Waned as Major Indices Fell
Kenneth J. Gruneisen - Passed the CAN SLIM® Master's Exam
The Dow lost 410 points, while the S&P 500 declined 1.6%. The Nasdaq Composite fell 1.7%. The reported volume totals were mixed, lighter than the prior session on the NYSE and higher on the Nasdaq exchange. Breadth was negative as decliners led advancers by an 11-4 margin on the NYSE and by a 2-1 margin on the Nasdaq exchange. There were 52 high-ranked companies from the Leaders List that hit new 52-week highs and were listed on the BreakOuts Page, versus the total of 75 on the prior session. New 52-week highs totals outnumbered new 52-week lows totals on the NYSE and on the Nasdaq exchange. The major indices are in a confirmed uptrend (M criteria). New buying efforts may be justified in leading stocks on a case-by-case basis. 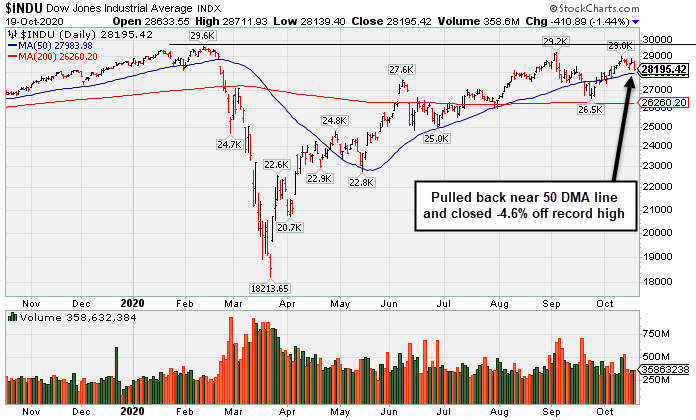 PICTURED: The Dow Jones Industrial Average pulled back near its 50-day moving average (DMA) line and closed -4.6% off its record high.
Stocks declined Monday, as investors monitored fiscal stimulus developments. Over the weekend, Nancy Pelosi expressed optimism about the probability of reaching a pre-election agreement, however a deadline was set for negotiations to end Tuesday. Despite talks resuming today between Treasury Secretary Steven Mnuchin and Nancy Pelosi, sentiment quickly shifted amid news Democrats and Republicans remain far apart on key issues.
On the data front, an update from China showed the world’s second largest economy continued to recover. The country’s GDP figure fell short of expectations, but still showed an expansion of 4.9% in the third quarter from a year earlier. The lone domestic update from the NAHB revealed homebuilder sentiment for single-family homes improved to a fresh record high in October. Treasuries weakened, with the yield on the benchmark 10-year note adding two basis points to 0.76%.
All 11 S&P 500 sectors finished the day in negative territory, with the Energy group leading the downward trajectory. In earnings, Halliburton (HAL -0.65%) fell after revenue falling short of Wall Street’s expectations and outweighed an optimistic outlook on fracking. In other corporate news, ConocoPhillips (COP -3.17%) fell after confirming it would buy the rival Concho Resources (CXO -2.76%) in an all stock-deal worth $9.7 billion. Elsewhere, Amazon (AMZN -2.00%) fell amid a 45.2% jump in Prime Day sales, however reports indicated that this may have been below previous sale levels for Black Friday and Cyber Monday. Meanwhile, shares of airline operators received a tailwind after airport screenings over the weekend exceeded 1 million for the first time since Mid-March. |
 Kenneth J. Gruneisen started out as a licensed stockbroker in August 1987, a couple of months prior to the historic stock market crash that took the Dow Jones Industrial Average down -22.6% in a single day. He has published daily fact-based fundamental and technical analysis on high-ranked stocks online for two decades. Through FACTBASEDINVESTING.COM, Kenneth provides educational articles, news, market commentary, and other information regarding proven investment systems that work in good times and bad.
Comments contained in the body of this report are technical opinions only and are not necessarily those of Gruneisen Growth Corp. The material herein has been obtained from sources believed to be reliable and accurate, however, its accuracy and completeness cannot be guaranteed. Our firm, employees, and customers may effect transactions, including transactions contrary to any recommendation herein, or have positions in the securities mentioned herein or options with respect thereto. Any recommendation contained in this report may not be suitable for all investors and it is not to be deemed an offer or solicitation on our part with respect to the purchase or sale of any securities. |
|
 |
Retail, Financial, Biotech, and Commodity-Linked Groups Fell
Kenneth J. Gruneisen - Passed the CAN SLIM® Master's Exam
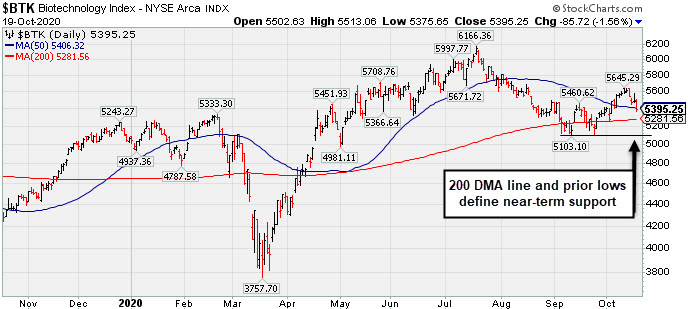
Weakness in the Retail Index ($RLX -1.72%) created a drag and financials also weighed on the major indices as the Broker/Dealer Index ($XBD -1.00%) and Bank Index ($BKX -1.37%) both fell. The Biotech Index ($BTK -1.56%) outpaced the Semiconductor Index ($SOX -0.58%) and Networking Index ($NWX -0.42%) to the downside. The Gold & Silver Index ($XAU -1.85%) and Integrated Oil Index ($XOI -2.26%) both slumped while the Oil Services Index ($OSX +0.14%) eked out a small gain. PICTURED: The Biotech Index ($BTK -1.56%) slumped to close below its 50-day moving average (DMA) line. Its 200 DMA line and prior lows define important near term support.
| Oil Services |
$OSX |
28.23 |
+0.04 |
+0.14% |
-63.95% |
| Integrated Oil |
$XOI |
585.44 |
-13.54 |
-2.26% |
-53.92% |
| Semiconductor |
$SOX |
2,385.82 |
-13.94 |
-0.58% |
+28.99% |
| Networking |
$NWX |
562.71 |
-2.38 |
-0.42% |
-3.55% |
| Broker/Dealer |
$XBD |
302.00 |
-3.06 |
-1.00% |
+4.00% |
| Retail |
$RLX |
3,482.24 |
-60.88 |
-1.72% |
+42.17% |
| Gold & Silver |
$XAU |
144.36 |
-2.73 |
-1.85% |
+35.02% |
| Bank |
$BKX |
77.00 |
-1.07 |
-1.37% |
-32.08% |
| Biotech |
$BTK |
5,395.25 |
-85.72 |
-1.56% |
+6.47% |
|
|
|
 |
Hovering Near High But Recent Gains Lacked Great Volume
Kenneth J. Gruneisen - Passed the CAN SLIM® Master's Exam
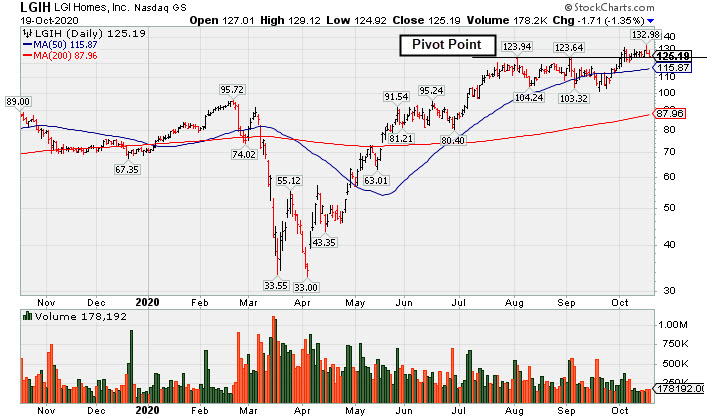
L G I Homes Inc's (LGIH -$1.71 or -1.35% to $125.19) volume totals have been cooling while hovering near its all-time high. Its color code was recently changed to yellow with new pivot point cited based on its 8/04/20 high plus 10 cents. Subsequent gains above the pivot point backed by at least +40% above average volume are still needed to clinch a proper new (or add-on) technical buy signal. The 50-day moving average (DMA) line ($115.87) and latest low ($101.30 on 9/21/20) define near-term support. It still has the highest possible earnings Per Share Rating of 99. However, not long ago the company reported Jun '20 quarterly earnings +21% on +4% sales revenues versus the year ago period, breaking a streak of 4 comparisons above the +25% minimum guideline (C criteria). LGIH traded up as much as +34% since highlighted in yellow with pivot point cited based on its 2/21/20 high plus 10 cents in the 7/07/20 mid-day report (read here). It was last shown in this FSU section on 10/01/20 under the headline, "New Base Formed by Strong Homebuilder". Its annual earnings (A criteria) history has been strong. The Building - Residential / Commercial Group Relative Strength Rating is now A+ (97). In recent weeks there has been greater leadership (L criteria) noted in the industry group. It has a small supply (S criteria) of only 22.1 million shares in the public float (S criteria). The number of top-rated funds owning its shares rose from 372 in Dec '19 to 395 in Jun '20, and its current Up/Down Volume Ratio of 1.0 is an unbiased indication its shares have been neutral concerning accumulation/distribution over the past 50 days. It has a Timeliness Rating of A and a Sponsorship Rating of D. LGIH completed its IPO at $11 on 11/07/13. Charts courtesy www.stockcharts.com
 XZ XZ |
|
|
Color Codes Explained :
Y - Better candidates highlighted by our
staff of experts.
G - Previously featured
in past reports as yellow but may no longer be buyable under the
guidelines.
***Last / Change / Volume data in this table is the closing quote data***
Symbol/Exchange
Company Name
Industry Group |
PRICE |
CHANGE
(%Change) |
Day High |
Volume
(% DAV)
(% 50 day avg vol) |
52 Wk Hi
% From Hi |
Featured
Date |
Price
Featured |
Pivot Featured |
|
Max Buy |
 ADBE
-
NASDAQ
ADBE
-
NASDAQ
Adobe Inc
COMPUTER SOFTWARE and SERVICES - Application Software
|
$495.20
|
-7.62
-1.52% |
$507.75
|
1,852,542
59.17% of 50 DAV
50 DAV is 3,131,000
|
$536.88
-7.76%
|
9/10/2020
|
$488.46
|
PP = $536.88
|
|
MB = $563.72
|
Most Recent Note - 10/16/2020 5:26:55 PM
Y - Posted a small gain today with light volume. Color code is changed to yellow while consolidating not far below its previously noted pivot point. Volume-driven gains above the pivot point are still needed to trigger a new (or add-on) technical buy signal. Subsequent losses below the 50 DMA line ($483.91) would raise great concerns and trigger a technical sell signal. Fundamentals remain strong.
>>> FEATURED STOCK ARTICLE : Showed Resilience Near 50-Day Moving Average - 10/8/2020 |
View all notes |
Set NEW NOTE alert |
Company Profile |
SEC
News |
Chart |
Request a new note
C
A
S
I |
CRL
-
NYSE
Charles River Labs Intl
DRUGS - Biotechnology
|
$233.13
|
-7.16
-2.98% |
$242.79
|
534,906
169.27% of 50 DAV
50 DAV is 316,000
|
$250.29
-6.86%
|
7/15/2020
|
$192.66
|
PP = $189.95
|
|
MB = $199.45
|
 Most Recent Note - 10/19/2020 1:51:12 PM
G - Hovering near its all-time high. Its 50 DMA line ($222) defines support where any subsequent violation would raise concerns and trigger a technical sell signal. Raised fundamental concerns when it recently reported Jun '20 quarterly earnings -3% on +4% sales revenues, below the +25% minimum guideline (C criteria).
>>> FEATURED STOCK ARTICLE : New Record High for Charles River Labs - 10/9/2020 |
View all notes |
Set NEW NOTE alert |
Company Profile |
SEC
News |
Chart |
Request a new note
C
A
S
I |
AMD
-
NASDAQ
Advanced Micro Devices
ELECTRONICS - Semiconductor - Broad Line
|
$82.00
|
-1.17
-1.41% |
$84.65
|
36,567,728
69.00% of 50 DAV
50 DAV is 52,993,000
|
$94.28
-13.03%
|
8/31/2020
|
$90.42
|
PP = $87.39
|
|
MB = $91.76
|
Most Recent Note - 10/19/2020 1:50:12 PM
G - Consolidating near its 50 DMA line ($82.08) with volume totals cooling. Reportedly is considering buying Xilinx Inc (XLNX). Damaging deterioration below the 50 DMA line and the recent low ($73.85 on 9/18/20) would raise greater concerns and trigger more worrisome technical sell signals. It has not formed a sound base and faces some near-term resistance due to overhead supply up to the $94 level. Fundamentals remain strong.
>>> FEATURED STOCK ARTICLE : Consolidating Just Above 50-Day Moving Average - 10/14/2020 |
View all notes |
Set NEW NOTE alert |
Company Profile |
SEC
News |
Chart |
Request a new note
C
A
S
I |
TREX
-
NYSE
Trex Company Inc
MATERIALS and CONSTRUCTION - General Building Materials
|
$76.16
|
-1.04
-1.35% |
$78.53
|
566,392
69.92% of 50 DAV
50 DAV is 810,000
|
$81.23
-6.24%
|
6/26/2020
|
$54.53
|
PP = $66.47
|
|
MB = $69.79
|
Most Recent Note - 10/16/2020 5:23:45 PM
G - Pulled back for a 3rd consecutive loss today with below average volume. Any subsequent losses below the 50 DMA line ($72.41) or recent low ($63.32 on 9/21/20) would raise concerns and trigger technical sell signals. Fundamentals remain strong. See the latest FSU analysis for more details and a new annotated graph.
>>> FEATURED STOCK ARTICLE : Recently Wedged Into New High Territory - 10/16/2020 |
View all notes |
Set NEW NOTE alert |
Company Profile |
SEC
News |
Chart |
Request a new note
C
A
S
I |
NFLX
-
NASDAQ
Netflix Inc
SPECIALTY RETAIL - Music and Video Stores
|
$530.72
|
-0.07
-0.01% |
$541.80
|
7,511,497
130.34% of 50 DAV
50 DAV is 5,763,000
|
$575.37
-7.76%
|
10/14/2020
|
$547.45
|
PP = $557.39
|
|
MB = $585.26
|
Most Recent Note - 10/19/2020 5:36:13 PM
Y - Due to report earnings news on Tuesday, 10/20/20 after the close. There was a "negative reversal" noted on 10/14/20 after gapping up challenging its 52-week high and pivot point. New pivot point was cited as it formed a "double bottom" base. A subsequent gain and close above the pivot point backed by at least +40% above average volume may trigger a new (or add-on) technical buy signal. Its 50 DMA line ($505) and recent low ($458.60 on 9/18/20) define important near term support where any further deterioration would raise more serious concerns and trigger technical sell signals.
>>> FEATURED STOCK ARTICLE : Encountered Distributional Pressure When Poised for Breakout - 10/15/2020 |
View all notes |
Set NEW NOTE alert |
Company Profile |
SEC
News |
Chart |
Request a new note
C
A
S
I |
Symbol/Exchange
Company Name
Industry Group |
PRICE |
CHANGE
(%Change) |
Day High |
Volume
(% DAV)
(% 50 day avg vol) |
52 Wk Hi
% From Hi |
Featured
Date |
Price
Featured |
Pivot Featured |
|
Max Buy |
LGIH
-
NASDAQ
L G I Homes Inc
Bldg-Resident/Comml
|
$125.19
|
-1.71
-1.35% |
$129.12
|
178,182
66.24% of 50 DAV
50 DAV is 269,000
|
$132.98
-5.86%
|
10/1/2020
|
$123.17
|
PP = $124.04
|
|
MB = $130.24
|
Most Recent Note - 10/19/2020 5:32:49 PM
Y - Volume totals have been cooling while hovering near its all-time high. Color code was recently changed to yellow with new pivot point cited based on its 8/04/20 high plus 10 cents. Subsequent gains above the pivot point backed by at least +40% above average volume are still needed to clinch a proper new (or add-on) technical buy signal. The 50 DMA line ($115.87) and latest low ($101.30 on 9/21/20) define near-term support. See the latest FSU analysis for more details and a new annotated graph.
>>> FEATURED STOCK ARTICLE : Hovering Near High But Recent Gains Lacked Great Volume - 10/19/2020 |
View all notes |
Set NEW NOTE alert |
Company Profile |
SEC
News |
Chart |
Request a new note
C
A
S
I |
NOW
-
NYSE
Servicenow Inc
Computer Sftwr-Enterprse
|
$521.95
|
-2.92
-0.56% |
$533.37
|
891,714
60.70% of 50 DAV
50 DAV is 1,469,000
|
$530.73
-1.65%
|
8/20/2020
|
$453.34
|
PP = $454.79
|
|
MB = $477.53
|
Most Recent Note - 10/19/2020 1:52:30 PM
G - Posting a 3rd consecutive gain today with below average volume for yet another new all-time high. Found support at its 50 DMA line ($472) but did not form a new base of sufficient length. Fundamentals remain strong. Any losses below the 50 DMA line and prior low ($432.85 on 9/08/20) would raise concerns and trigger technical sell signals.
>>> FEATURED STOCK ARTICLE : Record High With Light Volume Behind 3rd Consecutive Gain - 10/13/2020 |
View all notes |
Set NEW NOTE alert |
Company Profile |
SEC
News |
Chart |
Request a new note
C
A
S
I |
VEEV
-
NYSE
Veeva Systems Inc Cl A
Computer Sftwr-Medical
|
$302.19
|
-4.08
-1.33% |
$313.99
|
664,932
81.89% of 50 DAV
50 DAV is 812,000
|
$313.10
-3.48%
|
10/6/2020
|
$287.71
|
PP = $298.86
|
|
MB = $313.80
|
Most Recent Note - 10/19/2020 5:38:24 PM
Y - Reversed to close with a loss on light volume today after touching a new all-time high. Found support at its 50 DMA line ($276) while forming a 6-week flat base. Any losses below the 50 DMA line and recent lows would raise concerns and trigger technical sell signals. Reported earnings +31% on +33% sales revenues for the Jul '20 quarter versus the year ago period. Three of the past 4 quarterly comparisons were above the +25% minimum earnings guideline (C criteria)."
>>> FEATURED STOCK ARTICLE : First Sound Base Being Built After Considerable Rally - 10/6/2020 |
View all notes |
Set NEW NOTE alert |
Company Profile |
SEC
News |
Chart |
Request a new note
C
A
S
I |
TEAM
-
NASDAQ
Atlassian Corp Plc Cl A
Comp Sftwr-Spec Enterprs
|
$212.94
|
+5.49
2.65% |
$215.84
|
3,516,500
222.28% of 50 DAV
50 DAV is 1,582,000
|
$212.97
-0.01%
|
10/12/2020
|
$193.77
|
PP = $199.60
|
|
MB = $209.58
|
Most Recent Note - 10/19/2020 12:48:35 PM
G - Powering to new 52-week highs with today's 2nd consecutive volume-driven gain. Color code is changed to green after quickly getting extended more than +5% above the prior high. Disciplined investors avoid chasing extended stocks. Its big gain above the pivot point on the prior session was backed +226% above average volume triggering a new technical buy signal. Its Relative Strength Rating has improved to 89.
>>> FEATURED STOCK ARTICLE : TEAM Perched Within Close Striking Distance of New Highs - 10/12/2020 |
View all notes |
Set NEW NOTE alert |
Company Profile |
SEC
News |
Chart |
Request a new note
C
A
S
I |
|
|
|
THESE ARE NOT BUY RECOMMENDATIONS!
Comments contained in the body of this report are technical
opinions only. The material herein has been obtained
from sources believed to be reliable and accurate, however,
its accuracy and completeness cannot be guaranteed.
This site is not an investment advisor, hence it does
not endorse or recommend any securities or other investments.
Any recommendation contained in this report may not
be suitable for all investors and it is not to be deemed
an offer or solicitation on our part with respect to
the purchase or sale of any securities. All trademarks,
service marks and trade names appearing in this report
are the property of their respective owners, and are
likewise used for identification purposes only.
This report is a service available
only to active Paid Premium Members.
You may opt-out of receiving report notifications
at any time. Questions or comments may be submitted
by writing to Premium Membership Services 665 S.E. 10 Street, Suite 201 Deerfield Beach, FL 33441-5634 or by calling 1-800-965-8307
or 954-785-1121.
|
|
|