***Last / Change / Volume data in this table is the closing quote data***
Symbol/Exchange
Company Name
Industry Group |
PRICE |
CHANGE
(%Change) |
Day High |
Volume
(% DAV)
(% 50 day avg vol) |
52 Wk Hi
% From Hi |
Featured
Date |
Price
Featured |
Pivot Featured |
|
Max Buy |
AVG
-
NYSE
A V G Technologies N.V.
INTERNET - Internet Software and Services
|
$24.41
|
-0.89
-3.52% |
$25.50
|
1,098,991
131.98% of 50 DAV
50 DAV is 832,700
|
$26.56
-8.08%
|
9/13/2013
|
$23.06
|
PP = $23.88
|
|
MB = $25.07
|
Most Recent Note - 10/17/2013 3:56:10 PM
Y - Wedging higher without great volume conviction, yet rebounding within -4.8% of its 52-week high. Showing resilience and finding prompt support after a damaging violation of prior highs in the $23 area and its 50 DMA line.
>>> FEATURED STOCK ARTICLE : Rallying Near Pivot Point With Greater Volume Conviction - 9/13/2013
View all notes |
Set NEW NOTE alert |
CANSLIM.net Company Profile |
SEC
News |
Chart |
Request a new note
C
A N
S L
I M


|
BITA
-
NYSE
Bitauto Hldgs Ltd Ads
INTERNET - Internet Information Providers
|
$24.32
|
-1.14
-4.48% |
$25.97
|
1,498,709
221.90% of 50 DAV
50 DAV is 675,400
|
$25.48
-4.55%
|
9/24/2013
|
$16.40
|
PP = $17.31
|
|
MB = $18.18
|
 Most Recent Note - 10/18/2013 12:18:39 PM
G - Hit another new high today then reversed into the red following 5 consecutive gains. It may go on to produce more climactic gains, however it is very extended from its prior base. Prior highs in the $18 area define initial support to watch on pullbacks.
>>> FEATURED STOCK ARTICLE : Volume-Driven Gains Cleared Latest Pivot Point - 10/2/2013
View all notes |
Set NEW NOTE alert |
CANSLIM.net Company Profile |
SEC
News |
Chart |
Request a new note
C
A N
S L
I M
|
BLOX
-
NYSE
Infoblox Inc
COMPUTER HARDWARE - Networking and Communication Dev
|
$47.17
|
+0.05
0.11% |
$47.87
|
650,405
85.99% of 50 DAV
50 DAV is 756,400
|
$47.83
-1.38%
|
10/11/2013
|
$43.02
|
PP = $45.60
|
|
MB = $47.88
|
Most Recent Note - 10/17/2013 4:15:13 PM
Y - Hit another new 52-week high today with a 2nd consecutive volume-driven gain while rising above its pivot point clinching a technical buy signal. Highlighted in yellow while building on a flat base in the 10/11/13 mid-day report (read here) and noted - "Subsequent volume-driven gains for new highs may trigger a technical buy signal."
>>> FEATURED STOCK ARTICLE : Finished Another Week Higher With Volume Behind Gains - 10/11/2013
View all notes |
Set NEW NOTE alert |
CANSLIM.net Company Profile |
SEC
News |
Chart |
Request a new note
C
A N
S L
I M
|
CELG
-
NASDAQ
Celgene Corp
DRUGS - Drug Manufacturers - Major
|
$160.55
|
+0.55
0.34% |
$160.58
|
3,549,228
139.55% of 50 DAV
50 DAV is 2,543,400
|
$160.00
0.34%
|
9/12/2013
|
$149.50
|
PP = $150.02
|
|
MB = $157.52
|
Most Recent Note - 10/17/2013 4:08:28 PM
G - Wedged above its "max buy" level and its color code is changed to green after inching higher on light volume for a 6th consecutive small gain and a new all-time high. Found support at its 50 DMA line last week as it did on prior pullbacks. The recent low ($143.13 on 10/09/13) defines important near-term support where a subsequent violation may trigger a more worrisome technical sell signal.
>>> FEATURED STOCK ARTICLE : Volume-Driven Gain Challenging New Pivot Point - 9/20/2013
View all notes |
Set NEW NOTE alert |
CANSLIM.net Company Profile |
SEC
News |
Chart |
Request a new note
C
A N
S L
I M
|
EGBN
-
NASDAQ
Eagle Bancorp Inc
BANKING - Regional - Mid-Atlantic Banks
|
$29.68
|
+0.44
1.50% |
$29.72
|
51,095
74.27% of 50 DAV
50 DAV is 68,800
|
$29.92
-0.80%
|
9/16/2013
|
$27.48
|
PP = $27.77
|
|
MB = $29.16
|
Most Recent Note - 10/17/2013 4:09:32 PM
G - Pulled back today on lighter volume. Hit a new 52-week high on the prior session with a considerable gain backed by only +11% above average volume. Color code was changed to green while getting extended from the prior base. Recent lows and 50 DMA line define near-term support.
>>> FEATURED STOCK ARTICLE : Finished Lower After "Negative Reversal" - 9/16/2013
View all notes |
Set NEW NOTE alert |
CANSLIM.net Company Profile |
SEC
News |
Chart |
Request a new note
C
A N
S L
I M
|
Symbol/Exchange
Company Name
Industry Group |
PRICE |
CHANGE
(%Change) |
Day High |
Volume
(% DAV)
(% 50 day avg vol) |
52 Wk Hi
% From Hi |
Featured
Date |
Price
Featured |
Pivot Featured |
|
Max Buy |
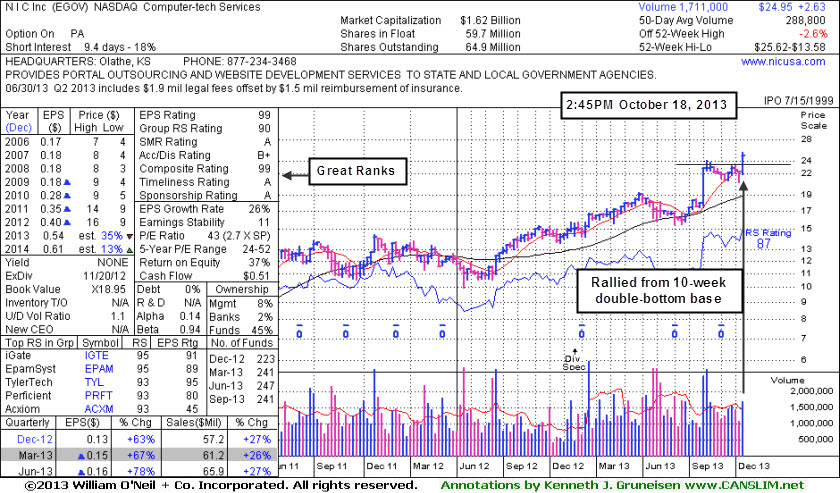
EGOV
-
NASDAQ
N I C Inc
INTERNET - Internet Software and Services
|
$24.99
|
+1.95
8.46% |
$25.62
|
972,637
336.79% of 50 DAV
50 DAV is 288,800
|
$24.15
3.48%
|
10/18/2013
|
$25.17
|
PP = $23.66
|
|
MB = $24.84
|
Most Recent Note - 10/18/2013 5:04:20 PM
Y - Finished just above its "max buy" level today after highlighted in yellow with pivot point based on its 10/02/13 high. See the latest FSU analysis for an annotated weekly graph. Volume was more than 3 times average behind the technical breakout from a "double bottom" base formed since noted in the 8/20/13 mid-day report with caution - "Reported earnings +78% on +27% sales revenues for the Jun '13 quarter, marking its 3rd consecutive quarter with earnings above the +25% minimum guideline (C criteria). However, blue triangles beside the quarterly and annual earnings figures within the datagraphs used by CANSLIM.net experts indicate pre-tax, non-recurring items were included (where possible, such items are normally removed to provide data better suited for comparison). EGOV found support at its 200 DMA line during its consolidation while building a cup-with-handle base since last noted in the 4/01/13 mid-day report with caution - No resistance remains due to overhead supply. Quarterly and annual earnings (C and A criteria) history has not been strong and steady, and it is fundamentally not a good match with the guidelines of the fact-based investment system.'"

>>> FEATURED STOCK ARTICLE : Technical Breakout From "Double Bottom" Base on 3 Times Average Volume - 10/18/2013
View all notes |
Set NEW NOTE alert |
CANSLIM.net Company Profile |
SEC
News |
Chart |
Request a new note
C
A N
S L
I M
|
FLT
-
NYSE
Fleetcor Technologies
DIVERSIFIED SERVICES - Business/Management Services
|
$112.49
|
+1.19
1.07% |
$112.61
|
459,999
65.42% of 50 DAV
50 DAV is 703,100
|
$113.68
-1.05%
|
8/19/2013
|
$99.01
|
PP = $100.97
|
|
MB = $106.02
|
Most Recent Note - 10/16/2013 6:57:58 PM
G - Rebounded further above its 50 DMA line today. A prompt rebound above that important short-term average last week was noted as a sign of support that helped its outlook.
>>> FEATURED STOCK ARTICLE : Extended After 13 Weekly Gains in Span of 14 Weeks - 10/7/2013
View all notes |
Set NEW NOTE alert |
CANSLIM.net Company Profile |
SEC
News |
Chart |
Request a new note
C
A N
S L
I M
|
GNRC
-
NYSE
Generac Hldgs Inc
CONSUMER DURABLES - Electronic Equipment
|
$41.18
|
+0.45
1.10% |
$41.37
|
998,807
147.34% of 50 DAV
50 DAV is 677,900
|
$44.30
-7.04%
|
9/12/2013
|
$41.40
|
PP = $43.27
|
|
MB = $45.43
|
Most Recent Note - 10/17/2013 12:35:53 PM
G - Prior lows in $39 area define important near-term support. Wedging higher with gains lacking great volume conviction, approaching its 50 DMA line which is now downward sloping and may act as resistance. A rebound above the 50 DMA line is needed to help its outlook and technical stance improve. Its Relative Strength rank has slumped to 79, below the 80+ minimum guideline for buy candidates. Disciplined investors limit losses by selling if any stock falls more than -7% from their purchase price.
>>> FEATURED STOCK ARTICLE : Pullback Following Friday's Technical Buy Signal - 9/23/2013
View all notes |
Set NEW NOTE alert |
CANSLIM.net Company Profile |
SEC
News |
Chart |
Request a new note
C
A N
S L
I M
|
JAZZ
-
NASDAQ
Jazz Pharmaceuticals Plc
DRUGS - Biotechnology
|
$85.01
|
+0.98
1.17% |
$85.12
|
1,010,211
143.03% of 50 DAV
50 DAV is 706,300
|
$93.84
-9.41%
|
9/30/2013
|
$93.20
|
PP = $89.10
|
|
MB = $93.56
|
Most Recent Note - 10/15/2013 7:02:43 PM
G- Consolidating below its 50 DMA line, and a subsequent rebound is needed to help its outlook. That important short-term average acted as resistance after a damaging loss and technical sell signal on 10/08/13. Disciplined investors limit losses if any stock falls more than -7% from their purchase price.
>>> FEATURED STOCK ARTICLE : Strong Finish With High Volume Indicative of Accumulation - 9/30/2013
View all notes |
Set NEW NOTE alert |
CANSLIM.net Company Profile |
SEC
News |
Chart |
Request a new note
C
A N
S L
I M
|
KORS
-
NYSE
Michael Kors Hldgs Ltd
RETAIL - Apparel Stores
|
$75.24
|
+1.49
2.02% |
$75.49
|
2,896,385
95.47% of 50 DAV
50 DAV is 3,033,900
|
$78.62
-4.30%
|
8/6/2013
|
$69.66
|
PP = $66.28
|
|
MB = $69.59
|
Most Recent Note - 10/17/2013 4:04:11 PM
G - Churned heavy volume today and finished with a loss while consolidating near its 50 DMA line. Found prompt support near that short-term average after a damaging loss on 10/08/13 triggered a technical sell signal. Recent low ($70.59 on 10/09/13) defines the next important near-term support area above prior highs in the $66 area.
>>> FEATURED STOCK ARTICLE : Extended From Base After Additional Volume-Driven Gains - 9/27/2013
View all notes |
Set NEW NOTE alert |
CANSLIM.net Company Profile |
SEC
News |
Chart |
Request a new note
C
A N
S L
I M
|
Symbol/Exchange
Company Name
Industry Group |
PRICE |
CHANGE
(%Change) |
Day High |
Volume
(% DAV)
(% 50 day avg vol) |
52 Wk Hi
% From Hi |
Featured
Date |
Price
Featured |
Pivot Featured |
|
Max Buy |
LOPE
-
NASDAQ
Grand Canyon Education
DIVERSIFIED SERVICES - Education and; Training Services
|
$42.11
|
-0.06
-0.14% |
$42.71
|
384,917
118.99% of 50 DAV
50 DAV is 323,500
|
$42.22
-0.26%
|
6/19/2013
|
$31.47
|
PP = $34.17
|
|
MB = $35.88
|
Most Recent Note - 10/16/2013 12:50:22 PM
G - Gapped up today hitting new all-time highs. Fundamental concerns remain while technical action has been reassuring.
>>> FEATURED STOCK ARTICLE : Formed Advanced Base But Fundamental Concerns Remain - 10/14/2013
View all notes |
Set NEW NOTE alert |
CANSLIM.net Company Profile |
SEC
News |
Chart |
Request a new note
C
A N
S L
I M
|
MRLN
-
NASDAQ
Marlin Business Services
DIVERSIFIED SERVICES - Rental and Leasing Services
|
$26.11
|
+0.15
0.58% |
$26.25
|
38,131
116.25% of 50 DAV
50 DAV is 32,800
|
$26.96
-3.15%
|
9/9/2013
|
$23.75
|
PP = $24.03
|
|
MB = $25.23
|
Most Recent Note - 10/17/2013 4:12:12 PM
G - Finished at the session high for a best-ever close today, wedging higher without great volume conviction. Found support at its 50 DMA line on the last pullback. Subsequent losses below the recent low ($23.25) would trigger a more worrisome technical sell signal.
>>> FEATURED STOCK ARTICLE : Faring Better Than Others While Testing 50-Day Average Line - 10/8/2013
View all notes |
Set NEW NOTE alert |
CANSLIM.net Company Profile |
SEC
News |
Chart |
Request a new note
C
A N
S L
I M
|
NOAH
-
NYSE
Noah Holdings Ltd Ads
FINANCIAL SERVICES - Asset Management
|
$21.06
|
-1.53
-6.77% |
$22.99
|
1,606,667
221.33% of 50 DAV
50 DAV is 725,900
|
$22.80
-7.63%
|
10/15/2013
|
$19.10
|
PP = $18.33
|
|
MB = $19.25
|
Most Recent Note - 10/18/2013 12:53:01 PM
G - Touched another new 52-week high today then reversed into the red following an impressive streak of volume-driven gains. Disciplined investors avoid chasing stocks extended more than +5% above their pivot point. Prior highs in the $18 area define initial support to watch on pullbacks.
>>> FEATURED STOCK ARTICLE : Finished Strong With Gain on 4 Times Average Volume - 10/15/2013
View all notes |
Set NEW NOTE alert |
CANSLIM.net Company Profile |
SEC
News |
Chart |
Request a new note
C
A N
S L
I M
|
OII
-
NYSE
Oceaneering Intl Inc
ENERGY - Oil and Gas Drilling and Explorati
|
$86.27
|
+3.36
4.05% |
$86.32
|
1,104,704
184.76% of 50 DAV
50 DAV is 597,900
|
$84.64
1.93%
|
10/16/2013
|
$83.08
|
PP = $84.74
|
|
MB = $88.98
|
Most Recent Note - 10/18/2013 5:07:06 PM
Y - Gapped up today and rallied for a new 52-week high with +83% above average volume, breaking out above the pivot point based on its 9/18/13 high plus 10 cents triggering a technical buy signal. Prior highs in the $84 area define initial support to watch on pullbacks.
>>> FEATURED STOCK ARTICLE : Forming Set-Up Above 50-Day Moving Average Line - 10/16/2013
View all notes |
Set NEW NOTE alert |
CANSLIM.net Company Profile |
SEC
News |
Chart |
Request a new note
C
A N
S L
I M
|
PCLN
-
NASDAQ
Priceline.Com Inc
INTERNET - Internet Software and Services
|
$1,048.25
|
+16.10
1.56% |
$1,056.02
|
924,429
153.89% of 50 DAV
50 DAV is 600,700
|
$1,074.89
-2.48%
|
9/13/2013
|
$966.82
|
PP = $995.08
|
|
MB = $1,044.83
|
Most Recent Note - 10/16/2013 7:00:34 PM
Y - Found support near its 50 DMA line after enduring damaging distributional losses last week. Disciplined investors limit losses by selling if any stock falls more than -7% from their purchase price.
>>> FEATURED STOCK ARTICLE : Wedging to New Highs With Gains Lacking Volume Conviction - 9/19/2013
View all notes |
Set NEW NOTE alert |
CANSLIM.net Company Profile |
SEC
News |
Chart |
Request a new note
C
A N
S L
I M
|
Symbol/Exchange
Company Name
Industry Group |
PRICE |
CHANGE
(%Change) |
Day High |
Volume
(% DAV)
(% 50 day avg vol) |
52 Wk Hi
% From Hi |
Featured
Date |
Price
Featured |
Pivot Featured |
|
Max Buy |
PRAA
-
NASDAQ
Portfolio Recovery Assoc
DIVERSIFIED SERVICES - Business/Management Services
|
$62.13
|
+1.29
2.12% |
$62.16
|
448,135
93.54% of 50 DAV
50 DAV is 479,100
|
$61.60
0.86%
|
10/17/2013
|
$60.75
|
PP = $61.70
|
|
MB = $64.79
|
Most Recent Note - 10/18/2013 5:16:37 PM
Y - Wedged to a new 52-week high with today's 3rd consecutive gain lacking great volume conviction. Pivot point cited was based on its 9/26/13 high plus 10 cents after forming an advanced "3-weeks tight" base. Subsequent volume-driven gains may clinch a proper new (or add-on) technical buy signal.
>>> FEATURED STOCK ARTICLE : Wedging to New Highs With Gains Lacking Volume Conviction - 9/26/2013
View all notes |
Set NEW NOTE alert |
CANSLIM.net Company Profile |
SEC
News |
Chart |
Request a new note
C
A N
S L
I M
|
PRLB
-
NYSE
Proto Labs Inc
MANUFACTURING - Small Tools and Accessories
|
$82.29
|
+1.11
1.37% |
$82.51
|
281,740
83.36% of 50 DAV
50 DAV is 338,000
|
$81.41
1.08%
|
7/29/2013
|
$64.86
|
PP = $67.50
|
|
MB = $70.88
|
Most Recent Note - 10/17/2013 3:58:04 PM
G - Poised for a best-ever close with a solid gain on near average volume today. Found prompt support at its 50 DMA line then wedged higher.
>>> FEATURED STOCK ARTICLE : Extended Following Additional Volume-Driven Gains - 9/25/2013
View all notes |
Set NEW NOTE alert |
CANSLIM.net Company Profile |
SEC
News |
Chart |
Request a new note
C
A N
S L
I M
|
SFUN
-
NYSE
Soufun Hldgs Ltd Ads A
INTERNET - Internet Information Providers
|
$57.21
|
+0.71
1.26% |
$59.50
|
1,497,362
109.88% of 50 DAV
50 DAV is 1,362,700
|
$58.29
-1.85%
|
10/17/2013
|
$58.02
|
PP = $53.87
|
|
MB = $56.56
|
Most Recent Note - 10/17/2013 1:12:14 PM
Y - Rising form a choppy 5-week base with today's considerable volume driven gain helping it rally above a new pivot point cited based on its 9/10/13 high plus 10 cents. While triggering a new (or add-on) technical buy signal it is quickly getting extended more than +5% above prior highs. Prior highs in the $53 area define initial support to watch on pullbacks.
>>> FEATURED STOCK ARTICLE : Following Great Rally No New Base Has Been Formed - 10/1/2013
View all notes |
Set NEW NOTE alert |
CANSLIM.net Company Profile |
SEC
News |
Chart |
Request a new note
C
A N
S L
I M
|
SSNC
-
NASDAQ
S S & C Technologies
COMPUTER SOFTWARE and SERVICES - Application Software
|
$38.83
|
+0.76
2.00% |
$38.85
|
355,589
86.83% of 50 DAV
50 DAV is 409,500
|
$39.94
-2.78%
|
9/5/2013
|
$36.01
|
PP = $38.90
|
|
MB = $40.85
|
Most Recent Note - 10/15/2013 7:04:07 PM
G - Consolidating near its 50 DMA line with gains on light volume after losses on higher volume triggered a technical sell signal. Completed a Secondary Offering on 9/20/13 while perched at all-time highs.
>>> FEATURED STOCK ARTICLE : Finding Support Near 50-Day Average After Secondary Offering - 10/4/2013
View all notes |
Set NEW NOTE alert |
CANSLIM.net Company Profile |
SEC
News |
Chart |
Request a new note
C
A N
S L
I M
|
SSYS
-
NASDAQ
Stratasys Ltd
COMPUTER HARDWARE - Computer Peripherals
|
$110.85
|
+1.21
1.10% |
$112.00
|
1,045,913
85.16% of 50 DAV
50 DAV is 1,228,200
|
$113.49
-2.33%
|
10/11/2013
|
$102.94
|
PP = $105.38
|
|
MB = $110.65
|
Most Recent Note - 10/15/2013 7:12:00 PM
Y - Rallied further above its 50 DMA line today and traded +27% above average volume while wedging above the pivot point of its "double bottom" base. Gains must have at least +40% above average volume to trigger a proper technical buy signal, so confirming gains with higher volume would be a welcome reassurance in the days to come.
>>> FEATURED STOCK ARTICLE : Faltering and Relative Strength Waning After Offering - 10/9/2013
View all notes |
Set NEW NOTE alert |
CANSLIM.net Company Profile |
SEC
News |
Chart |
Request a new note
C
A N
S L
I M
|
Symbol/Exchange
Company Name
Industry Group |
PRICE |
CHANGE
(%Change) |
Day High |
Volume
(% DAV)
(% 50 day avg vol) |
52 Wk Hi
% From Hi |
Featured
Date |
Price
Featured |
Pivot Featured |
|
Max Buy |
STMP
-
NASDAQ
Stamps.Com Inc
INTERNET - Internet Software and Services
|
$46.62
|
+2.00
4.48% |
$46.89
|
157,839
161.55% of 50 DAV
50 DAV is 97,700
|
$46.80
-0.38%
|
9/24/2013
|
$45.54
|
PP = $46.57
|
|
MB = $48.90
|
Most Recent Note - 10/18/2013 5:09:26 PM
Y - Rallied above the previously cited pivot point with a solid gain today backed by +62% above average volume clinching a technical buy signal. No resistance remains due to overhead supply.
>>> FEATURED STOCK ARTICLE : Forming New Set-Up After 50-Day Average Acted as Support - 9/24/2013
View all notes |
Set NEW NOTE alert |
CANSLIM.net Company Profile |
SEC
News |
Chart |
Request a new note
C
A N
S L
I M
|
TBBK
-
NASDAQ
Bancorp Inc
BANKING - Regional - Mid-Atlantic Banks
|
$18.61
|
+0.03
0.16% |
$18.83
|
112,166
62.70% of 50 DAV
50 DAV is 178,900
|
$18.99
-2.00%
|
9/4/2013
|
$16.26
|
PP = $16.79
|
|
MB = $17.63
|
Most Recent Note - 10/15/2013 7:07:51 PM
G - Pulled back today on lighter volume following 4 consecutive gains. Recent lows in the $17.25 area define near-term support above its 50 DMA line ($16.78).
>>> FEATURED STOCK ARTICLE : Encountering Distributional Pressure While Consolidating Above Prior Highs - 10/3/2013
View all notes |
Set NEW NOTE alert |
CANSLIM.net Company Profile |
SEC
News |
Chart |
Request a new note
C
A N
S L
I M
|
TNGO
-
NASDAQ
Tangoe Inc
COMPUTER SOFTWARE and SERVICES - Technical and System Software
|
$25.34
|
+0.34
1.36% |
$26.03
|
801,214
134.25% of 50 DAV
50 DAV is 596,800
|
$25.31
0.12%
|
9/12/2013
|
$21.30
|
PP = $23.15
|
|
MB = $24.31
|
Most Recent Note - 10/18/2013 5:11:03 PM
G - Hit another new 52-week high with another volume-driven gain lifting it further beyond its "max buy" level. Disciplined investors avoid chasing extended stocks.
>>> FEATURED STOCK ARTICLE : Gains Today Lacked Volume Conviction of Institutional Demand - 9/17/2013
View all notes |
Set NEW NOTE alert |
CANSLIM.net Company Profile |
SEC
News |
Chart |
Request a new note
C
A N
S L
I M
|
ULTI
-
NASDAQ
Ultimate Software Group
INTERNET - Internet Software and Services
|
$148.40
|
+4.60
3.20% |
$148.57
|
178,938
135.97% of 50 DAV
50 DAV is 131,600
|
$151.08
-1.77%
|
10/16/2013
|
$142.95
|
PP = $151.18
|
|
MB = $158.74
|
Most Recent Note - 10/18/2013 5:12:48 PM
Y - Rallied near its best-ever close with and finished near the session high with a solid gain backed by +36% above average volume. Subsequent volume-driven gains above the pivot point may trigger a technical buy signal. See the latest FSU analysis for more details and annotated daily and weekly graphs.
>>> FEATURED STOCK ARTICLE : Hovering Less Than -5% From 52-Week High - 10/17/2013
View all notes |
Set NEW NOTE alert |
CANSLIM.net Company Profile |
SEC
News |
Chart |
Request a new note
C
A N
S L
I M
|
VRX
-
NYSE
Valeant Pharmaceuticals
DRUGS - Drug Manufacturers - Other
|
$113.02
|
+1.02
0.91% |
$113.20
|
998,527
86.75% of 50 DAV
50 DAV is 1,151,000
|
$113.79
-0.68%
|
9/11/2013
|
$100.26
|
PP = $105.50
|
|
MB = $110.78
|
Most Recent Note - 10/17/2013 4:00:18 PM
G- Inching higher with light volume, poised for a best-ever close and its color code is changed to green. Found support above prior highs defining important support in the $105 area.
>>> FEATURED STOCK ARTICLE : Found Support Above Prior Highs on Pullback - 10/10/2013
View all notes |
Set NEW NOTE alert |
CANSLIM.net Company Profile |
SEC
News |
Chart |
Request a new note
C
A N
S L
I M
|
Symbol/Exchange
Company Name
Industry Group |
PRICE |
CHANGE
(%Change) |
Day High |
Volume
(% DAV)
(% 50 day avg vol) |
52 Wk Hi
% From Hi |
Featured
Date |
Price
Featured |
Pivot Featured |
|
Max Buy |
YNDX
-
NASDAQ
Yandex N V Class A
INTERNET - Internet Information Providers
|
$40.81
|
+1.59
4.04% |
$41.32
|
3,334,365
141.80% of 50 DAV
50 DAV is 2,351,500
|
$39.70
2.78%
|
9/5/2013
|
$34.24
|
PP = $34.79
|
|
MB = $36.53
|
Most Recent Note - 10/18/2013 5:14:19 PM
G - Hit another new 52-week high today with a gap up and volume-driven gain. Extended from any sound base. Found prompt support above prior highs in the $34 area and its 50 DMA line.
>>> FEATURED STOCK ARTICLE : Gains Lacked Volume Conviction While Hitting New Highs - 9/18/2013
View all notes |
Set NEW NOTE alert |
CANSLIM.net Company Profile |
SEC
News |
Chart |
Request a new note
C
A N
S L
I M
|