You are not logged in.
This means you
CAN ONLY VIEW reports that were published prior to Monday, April 14, 2025.
You
MUST UPGRADE YOUR MEMBERSHIP if you want to see any current reports.
AFTER MARKET UPDATE - TUESDAY, OCTOBER 18TH, 2011
Previous After Market Report Next After Market Report >>>
|
|
|
|
DOW |
+180.05 |
11,577.05 |
+1.58% |
|
Volume |
1,085,260,160 |
+20% |
|
Volume |
1,880,226,150 |
+15% |
|
NASDAQ |
+42.51 |
2,657.43 |
+1.63% |
|
Advancers |
2,560 |
82% |
|
Advancers |
1,982 |
74% |
|
S&P 500 |
+24.52 |
1,225.38 |
+2.04% |
|
Decliners |
489 |
16% |
|
Decliners |
595 |
22% |
|
Russell 2000 |
+20.74 |
709.34 |
+3.01% |
|
52 Wk Highs |
31 |
|
|
52 Wk Highs |
21 |
|
|
S&P 600 |
+10.13 |
389.98 |
+2.67% |
|
52 Wk Lows |
20 |
|
|
52 Wk Lows |
45 |
|
|
 |
Market Overcame Early Weakness and Rallied
Kenneth J. Gruneisen - Passed the CAN SLIM® Master's Exam
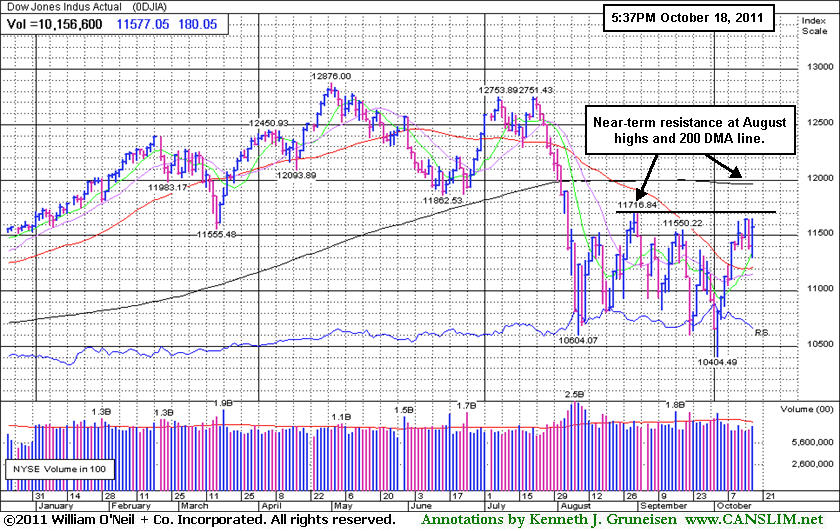
The major averages lost ground in the morning and then rebounded and built on their gains throughout Tuesday's session. The trading volume totals reported on the NYSE and Nasdaq exchanges were higher than the prior session, a sign of better buying demand coming from the institutional crowd. Advancing issues led decliners by more than 5-1 on the NYSE and 3-1 on the Nasdaq exchange. New 52-week highs outnumbered new 52-week lows on the NYSE but not on the Nasdaq exchange. There were 10 high-ranked companies from the CANSLIM.net Leaders List that made new 52-week highs and appeared on the CANSLIM.net BreakOuts Page, down a notch from the prior session total of 11 stocks. There were gains for 6 of the 7 high-ranked companies currently included on the Featured Stocks Page.
Comments by German President Angela Merkel got some of the credit for the market's improvement and a gain in the euro. She signaled progress is being made on a bank recapitalization plan. Financial shares rebounded, leading the market higher as the market erased early losses. Bank of America Corp (BAC +10.12%) rose sharply as investors dissected a complicated earnings report and focused on an improvement in credit quality. Citigroup Inc (C +6.98%) and JP Morgan Chase & Co (JPM +5.90%) posted solid gains, and even The Goldman Sachs Group Inc (GS +5.52%) rose in spite of reporting a challenging quarter.
A new government report suggested inflation could become a problem. Wholesale prices in the U.S. rose +0.8% in September, boosted by gasoline, food and trucks. Compared with September 2010, companies paid +6.9% more for goods last month, after a +6.5% rise in August. Homebuilders were on the rise after a new survey showed the industry was less pessimistic than forecast in October. Toll Brothers Inc (TOL +12.75%), D.R. Horton Inc (DHI +11.01%), KB Home (KBH +11.61%), and Lennar Corp (LEN +9.27%) tallied big gains.
Chevron Corp (CVX +4.40%) led the Dow Industrials as crude oil hit its highest price in more than a month. International Business Machines (IBM -4.12%) was a major drag on the market, subtracting nearly 70 points from the Dow Jones Industrial Average. Its sales missed estimates in the latest quarter, disappointing investors who had pushed shares up +10% last week. Crocs Inc (CROX -39.38%) shares were punished badly after an earnings warning.
The October 2011 issue of our monthly newsletter CANSLIM.net News will be published soon. The Q3 2011 Webcast (aired on September 28th) is now available "ON DEMAND" - (CLICK HERE) It provides an informative review of current market conditions, leading groups, and best buy candidates. All upgraded members are eligible to access the webcast presentation at no additional cost! Via the Premium Member Homepage links to all prior reports and webcasts are always available.
PICTURED: The Dow Jones Industrial Average was down as many as 100 points in the first hour, but finished up 180 after trading up as many as 255 points. It faces near-term resistance at its August high and its 200-day moving average (DMA) line.
|
 Kenneth J. Gruneisen started out as a licensed stockbroker in August 1987, a couple of months prior to the historic stock market crash that took the Dow Jones Industrial Average down -22.6% in a single day. He has published daily fact-based fundamental and technical analysis on high-ranked stocks online for two decades. Through FACTBASEDINVESTING.COM, Kenneth provides educational articles, news, market commentary, and other information regarding proven investment systems that work in good times and bad.
Comments contained in the body of this report are technical opinions only and are not necessarily those of Gruneisen Growth Corp. The material herein has been obtained from sources believed to be reliable and accurate, however, its accuracy and completeness cannot be guaranteed. Our firm, employees, and customers may effect transactions, including transactions contrary to any recommendation herein, or have positions in the securities mentioned herein or options with respect thereto. Any recommendation contained in this report may not be suitable for all investors and it is not to be deemed an offer or solicitation on our part with respect to the purchase or sale of any securities. |
|
 |
Financial Groups Underpinned Major Averages' Gains
Kenneth J. Gruneisen - Passed the CAN SLIM® Master's Exam
Big gains for the Bank Index ($BKX +6.11%) and Broker/Dealer Index ($XBD +3.95%) underpinned Tuesday's solid gains for the major averages. Energy-related shares also spurted higher as the Integrated Oil Index ($XOI +3.00%) and Oil Services Index ($OSX +3.52%) rallied along with crude prices. The Semiconductor Index ($SOX +2.25%) and Networking Index ($NWX +2.73%) led the tech sector while the Internet Index ($IIX +1.48%) and Biotechnology Index ($BTK +0.34%) followed with smaller gains. The Retail Index ($RLX +1.81%) also rang up a solid gain. Meanwhile, defensive groups including the Healthcare Index ($HMO +0.08%) and Gold & Silver Index ($XAU +0.16%) were clearly the session's laggards.
Charts courtesy www.stockcharts.com
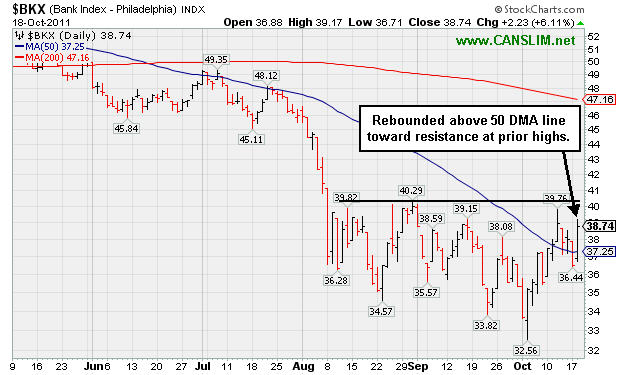
PICTURED: The Bank Index ($BKX +6.11%) rebounded above its 50-day moving average (DMA line toward resistance at prior chart highs.
| Oil Services |
$OSX |
217.61 |
+7.40 |
+3.52% |
-11.22% |
| Healthcare |
$HMO |
1,908.67 |
+1.49 |
+0.08% |
+12.81% |
| Integrated Oil |
$XOI |
1,181.21 |
+34.44 |
+3.00% |
-2.63% |
| Semiconductor |
$SOX |
378.66 |
+8.35 |
+2.25% |
-8.05% |
| Networking |
$NWX |
238.91 |
+6.35 |
+2.73% |
-14.84% |
| Internet |
$IIX |
293.93 |
+4.29 |
+1.48% |
-4.48% |
| Broker/Dealer |
$XBD |
87.16 |
+3.32 |
+3.95% |
-28.27% |
| Retail |
$RLX |
541.99 |
+9.66 |
+1.81% |
+6.61% |
| Gold & Silver |
$XAU |
193.13 |
+0.30 |
+0.16% |
-14.76% |
| Bank |
$BKX |
38.74 |
+2.23 |
+6.11% |
-25.80% |
| Biotech |
$BTK |
1,119.98 |
+3.78 |
+0.34% |
-13.69% |
|
|
|
 |
Pullback Provided Opportunity for Patient Investors
Kenneth J. Gruneisen - Passed the CAN SLIM® Master's Exam
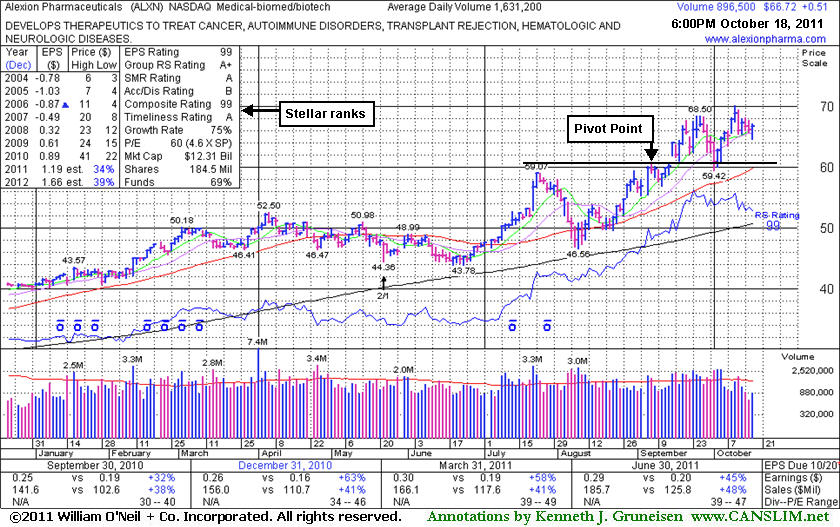
Alexion Pharmaceuticals (ALXN +$0.51 or +0.77% to $66.72) is still hovering in a tight range near its all-time high with volume totals recently cooling. This high-ranked Medical - Biomed/Biotech group leader is extended from its prior base. Volume totals have been mostly below average since it was last shown in this FSU section on 10/05/11 with an annotated graph under the headline, "Leader's Pullback Looks Normal, However Market Needs Confirmation", yet it wedged to another new all-time high and has been stubbornly holding its ground.
Although a bumpy market gave investors reasons to be cautious, its pullback appears to have offered patient investors the opportunity to accumulate shares without chasing them beyond the ideal buying range. Approximately 40% of successful breakouts tend to pull back and test support near prior highs before going on to produce greater gains. Prior resistance in the $59 area acted as support, and its recent lows and its 50-day moving average (DMA) line now define important near-term support to watch.
ALXN has stellar ranks, and its strong quarterly and annual earnings history satisfies the C and A criteria. In prior months it found support well above its 200 DMA line. It rose from a previously noted "cup-with-high-handle" pattern as it gapped up on 9/15/11 and hit a new all-time high. The number of top-rated funds owning its shares rose from 882 in Dec '10 to 1,052 in Sep '11, a reassuring sign concerning the I criteria of the fact-based investment system. Patient investors may wait for any secondary buy points or new bases to develop and be noted, or they may otherwise be better off watching for another fresh breakout that can be acted upon without chasing it too far above its pivot point.
|
|
|
Color Codes Explained :
Y - Better candidates highlighted by our
staff of experts.
G - Previously featured
in past reports as yellow but may no longer be buyable under the
guidelines.
***Last / Change / Volume data in this table is the closing quote data***
Symbol/Exchange
Company Name
Industry Group |
PRICE |
CHANGE
(%Change) |
Day High |
Volume
(% DAV)
(% 50 day avg vol) |
52 Wk Hi
% From Hi |
Featured
Date |
Price
Featured |
Pivot Featured |
|
Max Buy |
AAPL
-
NASDAQ
Apple Inc
COMPUTER HARDWARE - Personal Computers
|
$422.24
|
+2.25
0.54% |
$424.81
|
30,776,147
136.99% of 50 DAV
50 DAV is 22,465,900
|
$426.70
-1.05%
|
9/16/2011
|
$399.14
|
PP = $404.60
|
|
MB = $424.83
|
 Most Recent Note - 10/18/2011 4:25:51 PM
G - Inched higher today with slightly above average volume, finishing at a best-ever close. It has not formed a sound base pattern.
>>> The latest Featured Stock Update with an annotated graph appeared on 10/6/2011. Click here.
View all notes |
Alert me of new notes |
CANSLIM.net Company Profile |
SEC |
Zacks Reports |
StockTalk |
News |
Chart |
Request a new note
C
A N
S L
I M


|
ALXN
-
NASDAQ
Alexion Pharmaceuticals
DRUGS - Drug Manufacturers - Other
|
$66.72
|
+0.51
0.77% |
$67.23
|
896,530
54.96% of 50 DAV
50 DAV is 1,631,200
|
$70.20
-4.96%
|
9/15/2011
|
$63.20
|
PP = $60.81
|
|
MB = $63.85
|
Most Recent Note - 10/18/2011 4:27:03 PM
G - Still hovering in a tight range near its all-time high with volume totals recently cooling. This high-ranked Medical - Biomed/Biotech group leader is extended from its prior base. Support to watch includes prior resistance in the $59-60 area and its upwardly tilted 50 DMA line.
>>> The latest Featured Stock Update with an annotated graph appeared on 10/18/2011. Click here.
View all notes |
Alert me of new notes |
CANSLIM.net Company Profile |
SEC |
Zacks Reports |
StockTalk |
News |
Chart |
Request a new note
C
A N
S L
I M
|
CELG
-
NASDAQ
Celgene Corp
DRUGS - Drug Manufacturers - Major
|
$65.87
|
+1.02
1.57% |
$66.11
|
3,288,548
79.41% of 50 DAV
50 DAV is 4,141,300
|
$67.01
-1.70%
|
9/16/2011
|
$61.21
|
PP = $62.59
|
|
MB = $65.72
|
Most Recent Note - 10/18/2011 4:39:13 PM
G - Color code is changed to green after rising back above its "max buy" level today. Historic studies showed that investors' odds of success were best when buying stocks as they were rising rather than when they were pulling back.
>>> The latest Featured Stock Update with an annotated graph appeared on 10/14/2011. Click here.
View all notes |
Alert me of new notes |
CANSLIM.net Company Profile |
SEC |
Zacks Reports |
StockTalk |
News |
Chart |
Request a new note
C
A N
S L
I M
|
LABL
-
NASDAQ
Multi Color Corp
CONSUMER NON-DURABLES - Packaging and Containers
|
$27.21
|
-0.36
-1.31% |
$27.74
|
47,993
77.91% of 50 DAV
50 DAV is 61,600
|
$28.00
-2.82%
|
10/17/2011
|
$27.81
|
PP = $28.10
|
|
MB = $29.51
|
Most Recent Note - 10/18/2011 4:41:37 PM
Y - Pulled back today on light volume, finishing the session -2.8% off its 52-week high. During a choppy 10-week consolidation its 200 DMA line acted as support. No overhead supply remains to act as resistance. Subsequent volume-driven gains into new high ground may trigger a technical buy signal. Annual earnings (A criteria) history included a slight dip in FY '09 earnings. See the latest FSU analysis for more details and an annotated graph.
>>> The latest Featured Stock Update with an annotated graph appeared on 10/17/2011. Click here.
View all notes |
Alert me of new notes |
CANSLIM.net Company Profile |
SEC |
Zacks Reports |
StockTalk |
News |
Chart |
Request a new note
C
A N
S L
I M
|
MG
-
NYSE
Mistras Group Inc
DIVERSIFIED SERVICES - Bulding and Faci;ity Management Services
|
$22.48
|
+0.33
1.49% |
$22.84
|
281,490
114.94% of 50 DAV
50 DAV is 244,900
|
$23.00
-2.26%
|
8/10/2011
|
$17.89
|
PP = $17.58
|
|
MB = $18.46
|
Most Recent Note - 10/18/2011 4:22:19 PM
G - Finished at its second-best close ever today with a gain backed by slightly above average volume. No resistance remains due to overhead supply. Prior highs in the $20-21 area define initial chart support to watch above its 50 DMA line.
>>> The latest Featured Stock Update with an annotated graph appeared on 10/12/2011. Click here.
View all notes |
Alert me of new notes |
CANSLIM.net Company Profile |
SEC |
Zacks Reports |
StockTalk |
News |
Chart |
Request a new note
C
A N
S L
I M
|
Symbol/Exchange
Company Name
Industry Group |
PRICE |
CHANGE
(%Change) |
Day High |
Volume
(% DAV)
(% 50 day avg vol) |
52 Wk Hi
% From Hi |
Featured
Date |
Price
Featured |
Pivot Featured |
|
Max Buy |
OPNT
-
NASDAQ
Opnet Technologies
INTERNET - Internet Software and Services
|
$38.84
|
+0.39
1.01% |
$39.07
|
103,803
62.42% of 50 DAV
50 DAV is 166,300
|
$42.51
-8.63%
|
10/11/2011
|
$38.45
|
PP = $42.02
|
|
MB = $44.12
|
Most Recent Note - 10/18/2011 4:42:43 PM
Y - Still holding its ground stubbornly with volume totals cooling after encountering distributional pressure last week. Disciplined investors would wait to see subsequent gains above its pivot point trigger a technical buy signal before taking action.
>>> The latest Featured Stock Update with an annotated graph appeared on 10/11/2011. Click here.
View all notes |
Alert me of new notes |
CANSLIM.net Company Profile |
SEC |
Zacks Reports |
StockTalk |
News |
Chart |
Request a new note
C
A N
S L
I M
|
V
-
NYSE
Visa Inc Cl A
DIVERSIFIED SERVICES - Business/Management Services
|
$93.91
|
+2.72
2.98% |
$94.50
|
3,599,757
60.00% of 50 DAV
50 DAV is 5,999,500
|
$94.75
-0.89%
|
9/20/2011
|
$93.91
|
PP = $90.93
|
|
MB = $95.48
|
Most Recent Note - 10/18/2011 4:24:04 PM
G - Gain today with lighter than average volume leaves it perched near its all-time high. Choppy action in recent weeks is not recognized as a sound base pattern.
>>> The latest Featured Stock Update with an annotated graph appeared on 10/10/2011. Click here.
View all notes |
Alert me of new notes |
CANSLIM.net Company Profile |
SEC |
Zacks Reports |
StockTalk |
News |
Chart |
Request a new note
C
A N
S L
I M
|
|
|
|
THESE ARE NOT BUY RECOMMENDATIONS!
Comments contained in the body of this report are technical
opinions only. The material herein has been obtained
from sources believed to be reliable and accurate, however,
its accuracy and completeness cannot be guaranteed.
This site is not an investment advisor, hence it does
not endorse or recommend any securities or other investments.
Any recommendation contained in this report may not
be suitable for all investors and it is not to be deemed
an offer or solicitation on our part with respect to
the purchase or sale of any securities. All trademarks,
service marks and trade names appearing in this report
are the property of their respective owners, and are
likewise used for identification purposes only.
This report is a service available
only to active Paid Premium Members.
You may opt-out of receiving report notifications
at any time. Questions or comments may be submitted
by writing to Premium Membership Services 665 S.E. 10 Street, Suite 201 Deerfield Beach, FL 33441-5634 or by calling 1-800-965-8307
or 954-785-1121.
|
|
|

