You are not logged in.
This means you
CAN ONLY VIEW reports that were published prior to Sunday, February 25, 2024.
You
MUST UPGRADE YOUR MEMBERSHIP if you want to see any current reports.
AFTER MARKET UPDATE - FRIDAY, OCTOBER 16TH, 2020
Previous After Market Report Next After Market Report >>>
|
|
|
|
DOW |
+112.11 |
28,606.31 |
+0.39% |
|
Volume |
887,844,292 |
+17% |
|
Volume |
3,125,081,200 |
-5% |
|
NASDAQ |
-40.69 |
11,673.18 |
-0.35% |
|
Advancers |
1,212 |
40% |
|
Advancers |
1,626 |
48% |
|
S&P 500 |
+0.47 |
3,483.81 |
+0.01% |
|
Decliners |
1,788 |
60% |
|
Decliners |
1,786 |
52% |
|
Russell 2000 |
-5.08 |
1,633.81 |
-0.31% |
|
52 Wk Highs |
122 |
|
|
52 Wk Highs |
116 |
|
|
S&P 600 |
-5.86 |
923.71 |
-0.63% |
|
52 Wk Lows |
9 |
|
|
52 Wk Lows |
22 |
|
|
The major indices have shown improvement and have resumed a market uptrend as leadership has improved. Disciplined investors carefully may buy leading stocks on a case-by-case basis. Always remain ready to reduce market exposure in the event of any more substantial market downdrafts.
|
 |
Indices Ended Mixed While Leadership Improved
Kenneth J. Gruneisen - Passed the CAN SLIM® Master's Exam
The Dow climbed 112 points to finish the week 0.1% higher. The S&P 500 finished just above the flat line, capping its weekly advance at 0.2%. The Nasdaq Composite reversed early session gains and slipped 0.4%, but still rose 0.8% for the week. The reported volume totals were mixed, higher than the prior session on the NYSE and lighter on the Nasdaq exchange. Breadth was negative as decliners led advancers by a 3-2 margin on the NYSE and by a narrow margin on the Nasdaq exchange. There were 75 high-ranked companies from the Leaders List that hit new 52-week highs and were listed on the BreakOuts Page, versus the total of 42 on the prior session. New 52-week highs totals expanded and outnumbered shrinking new 52-week lows totals on the NYSE and on the Nasdaq exchange. The major indices are in a confirmed uptrend (M criteria). New buying efforts may be justified in leading stocks on a case-by-case basis. 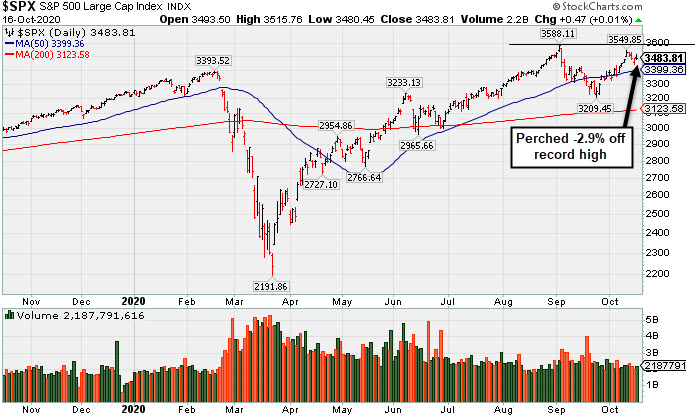 PICTURED: The S&P 500 Index is consolidating -2.9% off its record high.
Stocks ended mostly higher on Friday, with the Dow and S&P 500 rising for the first time in four days. Investor sentiment was boosted following upbeat economic data reports and an encouraging development on the COVID-19 vaccine front.
On the data front, retail sales during the month of September rose 1.9%, more than doubling consensus expectations and rising at its fastest pace in three months. Elsewhere, a preliminary report from the University of Michigan showed consumer sentiment rose more than anticipated to 81.2 in October, above the prior month’s reading of 80.4. Treasuries weakened with the yield on the 10-year note rising one basis point to 0.74%. On the COVID-19 vaccine front, shares of Pfizer rose 4.2% after announcing plans to apply for emergency use of its vaccine candidate by late November.
Seven of 11 S&P 500 sectors finished in positive territory, with Utilities and Health Care leading gains. In earnings, Intuitive Surgical (ISRG +1.58%) rose after topping profit and sales estimates. JB Hunt Transportation (JBHT -9.73%) fell after missing earnings expectations as higher spot rates weighed on profit margins. In other corporate news, Boeing (BA +1.89%) rose after its troubled 737 MAX was deemed safe to fly by the European Union Aviation Safety Agency. Elsewhere, CIT Group (CIT +26.65%) rose after First Citizens (FCNCA +11.35%) agreed to acquire the bank in an all-stock deal. |
 Kenneth J. Gruneisen started out as a licensed stockbroker in August 1987, a couple of months prior to the historic stock market crash that took the Dow Jones Industrial Average down -22.6% in a single day. He has published daily fact-based fundamental and technical analysis on high-ranked stocks online for two decades. Through FACTBASEDINVESTING.COM, Kenneth provides educational articles, news, market commentary, and other information regarding proven investment systems that work in good times and bad.
Comments contained in the body of this report are technical opinions only and are not necessarily those of Gruneisen Growth Corp. The material herein has been obtained from sources believed to be reliable and accurate, however, its accuracy and completeness cannot be guaranteed. Our firm, employees, and customers may effect transactions, including transactions contrary to any recommendation herein, or have positions in the securities mentioned herein or options with respect thereto. Any recommendation contained in this report may not be suitable for all investors and it is not to be deemed an offer or solicitation on our part with respect to the purchase or sale of any securities. |
|
 |
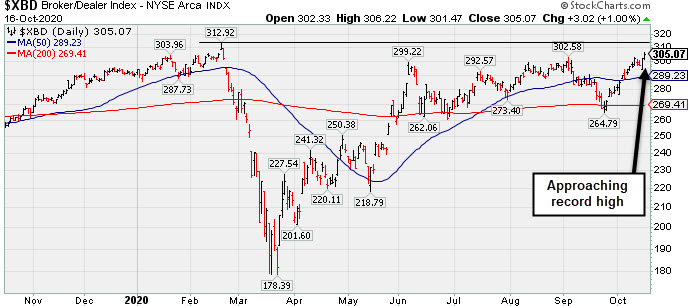
Broker/Dealer Index Rose; Commodity-Linked Groups Fell
Kenneth J. Gruneisen - Passed the CAN SLIM® Master's Exam
The Broker/Dealer Index ($XBD +1.00%) rose while the Bank Index ($BKX -0.03%) finished flat and the Retail Index ($RLX -1.24%) created a drag on the major indices. The Semiconductor Index ($SOX -0.50%) edged lower while the Networking Index ($NWX +0.00%) and Biotech Index ($BTK +0.03%) both finished flat. Commodity-linked groups clearly had a negative bias as the Oil Services Index ($OSX -4.71%) and Integrated Oil Index ($XOI -2.30%) both outpaced the Gold & Silver Index ($XAU -1.33%) to the downside. PICTURED: The Broker/Dealer Index ($XBD +1.00%) found support near its 200-day moving average and the recent rebound effort has it challenging its record high. Any subsequent improvement into new high territory would be a very reassuring sign. The recent lows define important near term support.
| Oil Services |
$OSX |
28.21 |
-1.39 |
-4.71% |
-63.97% |
| Integrated Oil |
$XOI |
598.98 |
-14.08 |
-2.30% |
-52.86% |
| Semiconductor |
$SOX |
2,399.01 |
-12.12 |
-0.50% |
+29.70% |
| Networking |
$NWX |
565.09 |
+0.03 |
+0.00% |
-3.14% |
| Broker/Dealer |
$XBD |
305.07 |
+3.02 |
+1.00% |
+5.06% |
| Retail |
$RLX |
3,543.12 |
-44.42 |
-1.24% |
+44.66% |
| Gold & Silver |
$XAU |
147.09 |
-1.98 |
-1.33% |
+37.57% |
| Bank |
$BKX |
78.07 |
-0.02 |
-0.03% |
-31.13% |
| Biotech |
$BTK |
5,481.38 |
+1.80 |
+0.03% |
+8.17% |
|
|
|
 |
Recently Wedged Into New High Territory
Kenneth J. Gruneisen - Passed the CAN SLIM® Master's Exam
Trex Company Inc (TREX -$1.13 or -1.44% to $77.20) pulled back for a 3rd consecutive loss with below average volume, retreating after quietly reaching a new all-time high this week. It did not form a sound base pattern and recently rose to new highs with gains lacking great volume conviction. Any subsequent losses below the 50-day moving average (DMA) line ($72.41) or recent low ($63.32 on 9/21/20) would raise concerns and trigger technical sell signals. Do not be confused by the 2:1 share split effective 9/15/20 (Featured Price, Pivot Point, and Max Buy prices have been adjusted accordingly). Fundamentals remain strong.
Fundamentals remain strong. Recently it reported Jun '20 quarterly earnings +27% on +7% sales revenues versus the year ago period, its 4th consecutive quarterly comparison above the +25% minimum earnings guideline (C criteria). It wedged into new high territory with gains lacking volume conviction since last appearing in this FSU section on 9/30/20 with an annotated graph under the headline, "TREX Rebounded Above 50-Day Moving Average". It has earned the highest possible 99 Earnings Per Share Rating. Annual earnings (A criteria) growth has been strong. The company hails from the General Building Materials industry group which currently has a Group Relative Strength Rating of A+
The company has a new CEO as of 4/29/20. After a 2:1 share split effective 9/15/20 it now has a supply (S criteria) of 115.8 million shares outstanding. The number of top-rated funds owning its shares rose from 540 in Jun '19 to 745 in Jun '20, a reassuring sign concerning the I criteria. Its current Up/Down Volume Ratio of 1.1 is an unbiased indication its shares have been under slight accumulation over the past 50 days. It has a Timeliness rating of A and a Sponsorship Rating of C.
|
|
|
Color Codes Explained :
Y - Better candidates highlighted by our
staff of experts.
G - Previously featured
in past reports as yellow but may no longer be buyable under the
guidelines.
***Last / Change / Volume data in this table is the closing quote data***
Symbol/Exchange
Company Name
Industry Group |
PRICE |
CHANGE
(%Change) |
Day High |
Volume
(% DAV)
(% 50 day avg vol) |
52 Wk Hi
% From Hi |
Featured
Date |
Price
Featured |
Pivot Featured |
|
Max Buy |
 ADBE
-
NASDAQ
ADBE
-
NASDAQ
Adobe Inc
COMPUTER SOFTWARE and SERVICES - Application Software
|
$502.82
|
+1.67
0.33% |
$510.34
|
2,361,687
75.48% of 50 DAV
50 DAV is 3,129,000
|
$536.88
-6.34%
|
9/10/2020
|
$488.46
|
PP = $536.88
|
|
MB = $563.72
|
 Most Recent Note - 10/16/2020 5:26:55 PM
Y - Posted a small gain today with light volume. Color code is changed to yellow while consolidating not far below its previously noted pivot point. Volume-driven gains above the pivot point are still needed to trigger a new (or add-on) technical buy signal. Subsequent losses below the 50 DMA line ($483.91) would raise great concerns and trigger a technical sell signal. Fundamentals remain strong.
>>> FEATURED STOCK ARTICLE : Showed Resilience Near 50-Day Moving Average - 10/8/2020 |
View all notes |
Set NEW NOTE alert |
Company Profile |
SEC
News |
Chart |
Request a new note
C
A
S
I |
CRL
-
NYSE
Charles River Labs Intl
DRUGS - Biotechnology
|
$240.29
|
-1.86
-0.77% |
$246.03
|
506,042
161.67% of 50 DAV
50 DAV is 313,000
|
$250.29
-4.00%
|
7/15/2020
|
$192.66
|
PP = $189.95
|
|
MB = $199.45
|
Most Recent Note - 10/13/2020 4:35:01 PM
G - Posted a 3rd consecutive gain today with below average volume for a new all-time high. Its 50 DMA line ($220) defines support where any subsequent violation would raise concerns and trigger a technical sell signal. Raised fundamental concerns when it recently reported Jun '20 quarterly earnings -3% on +4% sales revenues, below the +25% minimum guideline (C criteria).
>>> FEATURED STOCK ARTICLE : New Record High for Charles River Labs - 10/9/2020 |
View all notes |
Set NEW NOTE alert |
Company Profile |
SEC
News |
Chart |
Request a new note
C
A
S
I |
AMD
-
NASDAQ
Advanced Micro Devices
ELECTRONICS - Semiconductor - Broad Line
|
$83.17
|
+0.04
0.05% |
$83.99
|
31,264,171
58.50% of 50 DAV
50 DAV is 53,443,000
|
$94.28
-11.78%
|
8/31/2020
|
$90.42
|
PP = $87.39
|
|
MB = $91.76
|
Most Recent Note - 10/14/2020 7:27:46 PM
G - Pulled back today with lighter volume. Reportedly is considering buying Xilinx Inc (XLNX). Recently found support near its 50 DMA line ($82.24). Any deterioration below the 50 DMA line and the recent low ($73.85 on 9/18/20) would raise greater concerns and trigger more worrisome technical sell signals. It has not formed a sound base and faces some near-term resistance due to overhead supply up to the $94 level. Fundamentals remain strong. See the latest FSU analysis for more details and a new annotated graph.
>>> FEATURED STOCK ARTICLE : Consolidating Just Above 50-Day Moving Average - 10/14/2020 |
View all notes |
Set NEW NOTE alert |
Company Profile |
SEC
News |
Chart |
Request a new note
C
A
S
I |
TREX
-
NYSE
Trex Company Inc
MATERIALS and CONSTRUCTION - General Building Materials
|
$77.20
|
-1.13
-1.44% |
$79.26
|
645,413
78.71% of 50 DAV
50 DAV is 820,000
|
$81.23
-4.96%
|
6/26/2020
|
$54.53
|
PP = $66.47
|
|
MB = $69.79
|
Most Recent Note - 10/16/2020 5:23:45 PM
G - Pulled back for a 3rd consecutive loss today with below average volume. Any subsequent losses below the 50 DMA line ($72.41) or recent low ($63.32 on 9/21/20) would raise concerns and trigger technical sell signals. Fundamentals remain strong. See the latest FSU analysis for more details and a new annotated graph.
>>> FEATURED STOCK ARTICLE : Recently Wedged Into New High Territory - 10/16/2020 |
View all notes |
Set NEW NOTE alert |
Company Profile |
SEC
News |
Chart |
Request a new note
C
A
S
I |
NFLX
-
NASDAQ
Netflix Inc
SPECIALTY RETAIL - Music and Video Stores
|
$530.79
|
-11.15
-2.06% |
$554.33
|
6,097,973
106.78% of 50 DAV
50 DAV is 5,711,000
|
$575.37
-7.75%
|
10/14/2020
|
$547.45
|
PP = $557.39
|
|
MB = $585.26
|
Most Recent Note - 10/14/2020 7:35:04 PM
Y - Color code was changed to yellow, however there was a "negative reversal" after gapping up today for early gains challenging its 52-week high and pivot point. New pivot point was cited as it formed a "double bottom" base. A subsequent gain and close above the pivot point backed by at least +40% above average volume may trigger a new (or add-on) technical buy signal. Its 50 DMA line ($503.13) and recent low ($458.60 on 9/18/20) define important near term support where any further deterioration would raise more serious concerns and trigger technical sell signals.
>>> FEATURED STOCK ARTICLE : Encountered Distributional Pressure When Poised for Breakout - 10/15/2020 |
View all notes |
Set NEW NOTE alert |
Company Profile |
SEC
News |
Chart |
Request a new note
C
A
S
I |
Symbol/Exchange
Company Name
Industry Group |
PRICE |
CHANGE
(%Change) |
Day High |
Volume
(% DAV)
(% 50 day avg vol) |
52 Wk Hi
% From Hi |
Featured
Date |
Price
Featured |
Pivot Featured |
|
Max Buy |
LGIH
-
NASDAQ
L G I Homes Inc
Bldg-Resident/Comml
|
$126.90
|
-2.22
-1.72% |
$132.98
|
175,954
64.93% of 50 DAV
50 DAV is 271,000
|
$131.95
-3.83%
|
10/1/2020
|
$123.17
|
PP = $124.04
|
|
MB = $130.24
|
Most Recent Note - 10/14/2020 7:33:17 PM
Y - Volume totals have been cooling while hovering near its all-time high. Color code was recently changed to yellow with new pivot point cited based on its 8/04/20 high plus 10 cents. Subsequent gains above the pivot point backed by at least +40% above average volume are still needed to clinch a proper new (or add-on) technical buy signal. The 50 DMA line ($114.67) and latest low ($101.30 on 9/21/20) define near-term support. Reported Jun '20 quarterly earnings +21% on +4% sales revenues, breaking a streak of 4 comparisons above the +25% minimum guideline (C criteria).
>>> FEATURED STOCK ARTICLE : New Base Formed by Strong Homebuilder - 10/1/2020 |
View all notes |
Set NEW NOTE alert |
Company Profile |
SEC
News |
Chart |
Request a new note
C
A
S
I |
NOW
-
NYSE
Servicenow Inc
Computer Sftwr-Enterprse
|
$524.87
|
+4.19
0.80% |
$530.73
|
1,008,151
67.53% of 50 DAV
50 DAV is 1,493,000
|
$522.99
0.36%
|
8/20/2020
|
$453.34
|
PP = $454.79
|
|
MB = $477.53
|
Most Recent Note - 10/13/2020 4:30:50 PM
G - Posted a 3rd consecutive gain today with below average volume for another new all-time high. Found support at its 50 DMA line ($465.50) but did not form a new base of sufficient length. Fundamentals remain strong. Any losses below the 50 DMA line and prior low ($432.85 on 9/08/20) would raise concerns and trigger technical sell signals. See the latest FSU analysis for more details and a new annotated graph.
>>> FEATURED STOCK ARTICLE : Record High With Light Volume Behind 3rd Consecutive Gain - 10/13/2020 |
View all notes |
Set NEW NOTE alert |
Company Profile |
SEC
News |
Chart |
Request a new note
C
A
S
I |
VEEV
-
NYSE
Veeva Systems Inc Cl A
Computer Sftwr-Medical
|
$306.27
|
-1.98
-0.64% |
$313.10
|
696,481
86.30% of 50 DAV
50 DAV is 807,000
|
$312.00
-1.84%
|
10/6/2020
|
$287.71
|
PP = $298.86
|
|
MB = $313.80
|
Most Recent Note - 10/14/2020 7:32:01 PM
Y - Pulled back today with higher volume, retreating from its all-time high after a streak of 7 consecutive gains. Found support at its 50 DMA line ($274) while forming a 6-week flat base. It was highlighted in yellow again in the 10/06/20 mid-day report with a new pivot point cited based on its 9/02/20 high plus 10 cents. A subsequent gain above the pivot point on 10/12/20 backed by +46% above average triggered a technical buy signal. Any losses below the 50 DMA line and recent lows would raise concerns and trigger technical sell signals. Reported earnings +31% on +33% sales revenues for the Jul '20 quarter versus the year ago period. Three of the past 4 quarterly comparisons were above the +25% minimum earnings guideline (C criteria)."
>>> FEATURED STOCK ARTICLE : First Sound Base Being Built After Considerable Rally - 10/6/2020 |
View all notes |
Set NEW NOTE alert |
Company Profile |
SEC
News |
Chart |
Request a new note
C
A
S
I |
TEAM
-
NASDAQ
Atlassian Corp Plc Cl A
Comp Sftwr-Spec Enterprs
|
$207.45
|
+16.53
8.66% |
$212.97
|
5,091,600
335.64% of 50 DAV
50 DAV is 1,517,000
|
$199.95
3.75%
|
10/12/2020
|
$193.77
|
PP = $199.60
|
|
MB = $209.58
|
Most Recent Note - 10/16/2020 12:32:45 PM
Y - Challenged its 52-week high and pivot point with today's early gain following 4 consecutive losses marked by higher volume. Highlighted again in yellow in the 10/12/20 mid-day report with a new pivot point cited based on its 9/01/20 high plus 10 cents. Subsequent gains above the pivot point backed by at least +40% above average volume may trigger a new technical buy signal. Its Relative Strength Rating has improved to 84, above the 80+ minimum guideline for buy candidates. Three of the past 4 quarterly comparisons through Jun '20 were at or above the +25% minimum earnings guideline (C criteria). It was dropped from the Featured Stocks list on 8/07/20 and found support well above its 200 DMA line during recent consolidations.
>>> FEATURED STOCK ARTICLE : TEAM Perched Within Close Striking Distance of New Highs - 10/12/2020 |
View all notes |
Set NEW NOTE alert |
Company Profile |
SEC
News |
Chart |
Request a new note
C
A
S
I |
|
|
|
THESE ARE NOT BUY RECOMMENDATIONS!
Comments contained in the body of this report are technical
opinions only. The material herein has been obtained
from sources believed to be reliable and accurate, however,
its accuracy and completeness cannot be guaranteed.
This site is not an investment advisor, hence it does
not endorse or recommend any securities or other investments.
Any recommendation contained in this report may not
be suitable for all investors and it is not to be deemed
an offer or solicitation on our part with respect to
the purchase or sale of any securities. All trademarks,
service marks and trade names appearing in this report
are the property of their respective owners, and are
likewise used for identification purposes only.
This report is a service available
only to active Paid Premium Members.
You may opt-out of receiving report notifications
at any time. Questions or comments may be submitted
by writing to Premium Membership Services 665 S.E. 10 Street, Suite 201 Deerfield Beach, FL 33441-5634 or by calling 1-800-965-8307
or 954-785-1121.
|
|
|