***Last / Change / Volume data in this table is the closing quote data***
Symbol/Exchange
Company Name
Industry Group |
PRICE |
CHANGE
(%Change) |
Day High |
Volume
(% DAV)
(% 50 day avg vol) |
52 Wk Hi
% From Hi |
Featured
Date |
Price
Featured |
Pivot Featured |
|
Max Buy |
ALXN
-
NASDAQ
Alexion Pharmaceuticals
DRUGS - Drug Manufacturers - Other
|
$111.74
|
+0.32
0.29% |
$112.62
|
781,033
84.90% of 50 DAV
50 DAV is 919,900
|
$119.54
-6.52%
|
8/23/2012
|
$103.70
|
PP = $110.06
|
|
MB = $115.56
|
 Most Recent Note - 10/16/2012 1:03:11 PM
Y - Still consolidating above its 50 DMA line today after recently retreating below its "max buy" level. The prior highs in the $110 area define chart support along with its 50 DMA line where violations would raise concerns and trigger technical sell signals..
>>> The latest Featured Stock Update with an annotated graph appeared on 9/26/2012. Click here.
View all notes |
Alert me of new notes |
CANSLIM.net Company Profile |
SEC |
Zacks Reports |
StockTalk |
News |
Chart |
Request a new note
C
A N
S L
I M


|
ASPS
-
NASDAQ
Altisource Ptf Sltns Sa
REAL ESTATE - Property Management/Developmen
|
$117.44
|
+2.73
2.38% |
$118.48
|
126,909
74.35% of 50 DAV
50 DAV is 170,700
|
$117.07
0.32%
|
9/24/2012
|
$87.24
|
PP = $92.39
|
|
MB = $97.01
|
Most Recent Note - 10/16/2012 3:35:05 PM
G - Posting a gain today on below average volume for a new all-time high. Very extended from its prior base, it s prior highs in the $92 area define initial support to watch on pullbacks.
>>> The latest Featured Stock Update with an annotated graph appeared on 10/12/2012. Click here.
View all notes |
Alert me of new notes |
CANSLIM.net Company Profile |
SEC |
Zacks Reports |
StockTalk |
News |
Chart |
Request a new note
C
A N
S L
I M
|
BRLI
-
NASDAQ
Bio Reference Labs Inc
HEALTH SERVICES - Medical Laboratories and Researc
|
$32.09
|
-0.02
-0.06% |
$32.26
|
247,323
85.88% of 50 DAV
50 DAV is 288,000
|
$32.86
-2.34%
|
10/3/2012
|
$30.90
|
PP = $30.25
|
|
MB = $31.76
|
Most Recent Note - 10/11/2012 5:37:55 PM
G - Gapped up today and finished at its second-best close after consolidating under its "max buy" level following its 10/03/12 technical buy signal. Prior highs in the $30 area define initial chart support above its 50 DMA line.
>>> The latest Featured Stock Update with an annotated graph appeared on 10/8/2012. Click here.
View all notes |
Alert me of new notes |
CANSLIM.net Company Profile |
SEC |
Zacks Reports |
StockTalk |
News |
Chart |
Request a new note
C
A N
S L
I M
|
CFNL
-
NASDAQ
Cardinal Financial Corp
BANKING - Regional - Southeast Banks
|
$13.81
|
-0.02
-0.14% |
$14.04
|
93,128
116.26% of 50 DAV
50 DAV is 80,100
|
$14.79
-6.63%
|
8/17/2012
|
$12.84
|
PP = $13.31
|
|
MB = $13.98
|
Most Recent Note - 10/12/2012 4:19:20 PM
G - Quietly consolidating after distributional action in recent weeks. Prior low ($13.80 on 10/03/12) defines near-term support above its 50 DMA line ($13.53 now) where violations would trigger technical sell signals.
>>> The latest Featured Stock Update with an annotated graph appeared on 9/25/2012. Click here.
View all notes |
Alert me of new notes |
CANSLIM.net Company Profile |
SEC |
Zacks Reports |
StockTalk |
News |
Chart |
Request a new note
C
A N
S L
I M
|
CMCSA
-
NASDAQ
Comcast Corp Cl A
MEDIA - CATV Systems
|
$36.67
|
+0.24
0.66% |
$36.91
|
9,743,223
82.27% of 50 DAV
50 DAV is 11,843,500
|
$36.98
-0.84%
|
6/11/2012
|
$29.94
|
PP = $30.98
|
|
MB = $32.53
|
Most Recent Note - 10/15/2012 4:07:21 PM
G - Posted another gain today on average volume and finished within close striking distance of its best ever close. Found support while consolidating above prior highs in the $35 area and its 50 DMA line. Violations would trigger technical sell signals. Fundamental concerns have been repeatedly noted - "Due to sub par sales and earnings growth in the Jun '12 quarter."
>>> The latest Featured Stock Update with an annotated graph appeared on 9/21/2012. Click here.
View all notes |
Alert me of new notes |
CANSLIM.net Company Profile |
SEC |
Zacks Reports |
StockTalk |
News |
Chart |
Request a new note
C
A N
S L
I M
|
Symbol/Exchange
Company Name
Industry Group |
PRICE |
CHANGE
(%Change) |
Day High |
Volume
(% DAV)
(% 50 day avg vol) |
52 Wk Hi
% From Hi |
Featured
Date |
Price
Featured |
Pivot Featured |
|
Max Buy |
DVA
-
NYSE
Davita Inc
HEALTH SERVICES - Specialized Health Services
|
$109.87
|
+0.87
0.80% |
$110.04
|
739,212
96.28% of 50 DAV
50 DAV is 767,800
|
$111.34
-1.32%
|
9/5/2012
|
$102.92
|
PP = $100.62
|
|
MB = $105.65
|
Most Recent Note - 10/15/2012 4:08:54 PM
G - Reversed from its 52-week high today and closed near the session low with a loss on above average volume. Extended from its latest sound base. Prior highs near $100 and its 50 DMA line define near term support to watch on pullbacks where violations may trigger technical sell signals.
>>> The latest Featured Stock Update with an annotated graph appeared on 10/10/2012. Click here.
View all notes |
Alert me of new notes |
CANSLIM.net Company Profile |
SEC |
Zacks Reports |
StockTalk |
News |
Chart |
Request a new note
C
A N
S L
I M
|
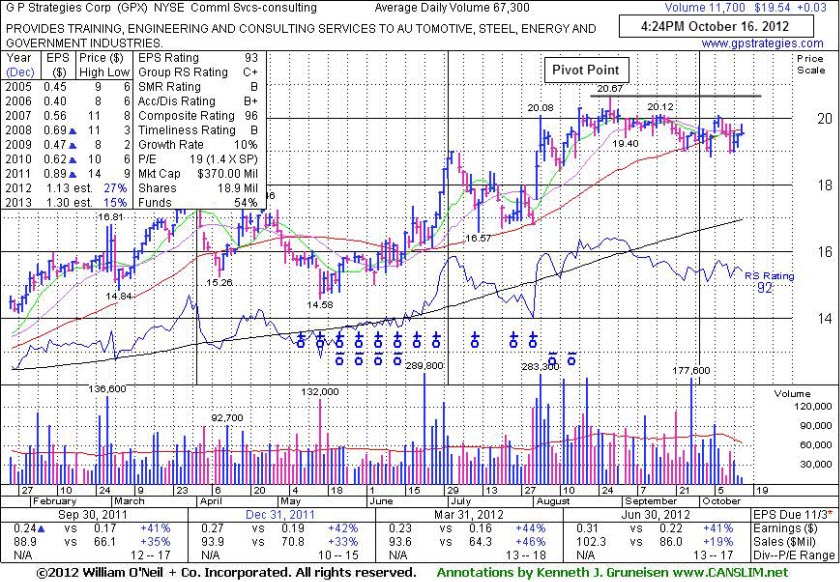
GPX
-
NYSE
G P Strategies Corp
DIVERSIFIED SERVICES - Education and Training Services
|
$19.56
|
+0.05
0.26% |
$19.82
|
19,159
28.47% of 50 DAV
50 DAV is 67,300
|
$20.67
-5.37%
|
10/8/2012
|
$20.00
|
PP = $20.77
|
|
MB = $21.81
|
Most Recent Note - 10/16/2012 4:45:41 PM
G - Consolidating near its 50 DMA line today. Volume driven gains above the pivot point have not triggered a new (or add-on) technical buy signal. Losses exceeding last week's low $18.82 would raise more serious concerns and trigger technical sell signals. See latest FSU analysis for more details and a new annotated graph.
>>> The latest Featured Stock Update with an annotated graph appeared on 10/16/2012. Click here.
View all notes |
Alert me of new notes |
CANSLIM.net Company Profile |
SEC |
Zacks Reports |
StockTalk |
News |
Chart |
Request a new note
C
A N
S L
I M
|
LKQ
-
NASDAQ
L K Q Corp
WHOLESALE - Auto Parts
|
$20.55
|
+0.42
2.09% |
$20.59
|
1,437,788
101.64% of 50 DAV
50 DAV is 1,414,600
|
$20.16
1.93%
|
8/9/2012
|
$18.97
|
PP = $18.72
|
|
MB = $19.66
|
Most Recent Note - 10/16/2012 3:38:24 PM
G - Hitting new 52-week and all-time highs again today, wedging higher without great volume conviction. Rallying well above its "max buy" level with no resistance remaining due to overhead supply.
>>> The latest Featured Stock Update with an annotated graph appeared on 9/17/2012. Click here.
View all notes |
Alert me of new notes |
CANSLIM.net Company Profile |
SEC |
Zacks Reports |
StockTalk |
News |
Chart |
Request a new note
C
A N
S L
I M
|
LNKD
-
NYSE
Linkedin Corp Class A
INTERNET - Internet Information Providers
|
$111.18
|
+0.33
0.30% |
$111.78
|
1,254,922
58.94% of 50 DAV
50 DAV is 2,129,100
|
$125.50
-11.41%
|
9/5/2012
|
$113.25
|
PP = $113.10
|
|
MB = $118.76
|
Most Recent Note - 10/15/2012 4:04:23 PM
G - Posted a small gain on light volume today, failing to rebound after a damaging volume-driven loss violated its 50 DMA line and triggered a technical sell signal on the prior session. Only a prompt rebound above that short-term average would help its outlook. Disciplined investors always limit losses if ever any stock falls more than -7% from where it was purchased.
>>> The latest Featured Stock Update with an annotated graph appeared on 10/9/2012. Click here.
View all notes |
Alert me of new notes |
CANSLIM.net Company Profile |
SEC |
Zacks Reports |
StockTalk |
News |
Chart |
Request a new note
C
A N
S L
I M
|
LULU
-
NASDAQ
Lululemon Athletica
MANUFACTURING - Textile Manufacturing
|
$75.52
|
+1.58
2.14% |
$75.76
|
1,249,731
52.82% of 50 DAV
50 DAV is 2,366,100
|
$81.09
-6.87%
|
10/2/2012
|
$74.89
|
PP = $78.97
|
|
MB = $82.92
|
Most Recent Note - 10/16/2012 3:44:05 PM
Y - Volume totals have been cooling while consolidating since recently highlighted again in yellow. Volume-driven gains above its pivot point are still needed to confirm a technical buy signal before action may be justified by disciplined investors.
>>> The latest Featured Stock Update with an annotated graph appeared on 10/2/2012. Click here.
View all notes |
Alert me of new notes |
CANSLIM.net Company Profile |
SEC |
Zacks Reports |
StockTalk |
News |
Chart |
Request a new note
C
A N
S L
I M
|
Symbol/Exchange
Company Name
Industry Group |
PRICE |
CHANGE
(%Change) |
Day High |
Volume
(% DAV)
(% 50 day avg vol) |
52 Wk Hi
% From Hi |
Featured
Date |
Price
Featured |
Pivot Featured |
|
Max Buy |
MIDD
-
NASDAQ
Middleby Corp
MANUFACTURING - Diversified Machinery
|
$120.99
|
+1.64
1.37% |
$121.34
|
84,821
83.82% of 50 DAV
50 DAV is 101,200
|
$122.57
-1.29%
|
10/8/2012
|
$118.46
|
PP = $122.67
|
|
MB = $128.80
|
Most Recent Note - 10/16/2012 3:46:22 PM
Y - Poised for a best-ever close with a quiet gain today and trading just -1.3% off its 52-week high. Volume totals have been below average in recent weeks while stubbornly holding its ground. Subsequent volume-driven gains above the pivot point may trigger a new (or add-on) technical buy signal. Its 50 DMA line and recent lows define near-term chart support to watch.
>>> The latest Featured Stock Update with an annotated graph appeared on 9/18/2012. Click here.
View all notes |
Alert me of new notes |
CANSLIM.net Company Profile |
SEC |
Zacks Reports |
StockTalk |
News |
Chart |
Request a new note
C
A N
S L
I M
|
N
-
NYSE
Netsuite Inc
DIVERSIFIED SERVICES - Business/Management Services
|
$62.70
|
+0.67
1.08% |
$63.40
|
295,521
64.09% of 50 DAV
50 DAV is 461,100
|
$64.70
-3.09%
|
8/20/2012
|
$55.88
|
PP = $59.32
|
|
MB = $62.29
|
Most Recent Note - 10/12/2012 4:32:04 PM
Y - Still quietly consolidating below its "max buy" level. Prior highs near $59 closely coincide with its 50 DMA line defining important chart support where subsequent violations would trigger technical sell signals.
>>> The latest Featured Stock Update with an annotated graph appeared on 9/24/2012. Click here.
View all notes |
Alert me of new notes |
CANSLIM.net Company Profile |
SEC |
Zacks Reports |
StockTalk |
News |
Chart |
Request a new note
C
A N
S L
I M
|
NSM
-
NYSE
Nationstar Mtg Hldgs Inc
FINANCIAL SERVICES - Credit Services
|
$32.68
|
+0.23
0.71% |
$32.80
|
914,398
77.09% of 50 DAV
50 DAV is 1,186,200
|
$37.20
-12.15%
|
8/29/2012
|
$27.96
|
PP = $28.85
|
|
MB = $30.29
|
Most Recent Note - 10/11/2012 6:48:40 PM
G - Gain on light volume today halted a 4 session losing streak on higher volume. A steep upward trendline connecting July-September lows defines a near-term support level to watch above its 50 DMA line. See the latest FSU analysis for more details and a new annotated graph.
>>> The latest Featured Stock Update with an annotated graph appeared on 10/11/2012. Click here.
View all notes |
Alert me of new notes |
CANSLIM.net Company Profile |
SEC |
Zacks Reports |
StockTalk |
News |
Chart |
Request a new note
C
A N
S L
I M
|
OSIS
-
NASDAQ
O S I Systems Inc
ELECTRONICS - Semiconductor Equipment and Mate
|
$77.79
|
+1.73
2.27% |
$78.28
|
55,368
42.01% of 50 DAV
50 DAV is 131,800
|
$78.93
-1.44%
|
9/5/2012
|
$74.39
|
PP = $75.10
|
|
MB = $78.86
|
Most Recent Note - 10/16/2012 3:41:06 PM
Y - Small gap up today, trading just -1.6% off its 52-week high. Volume totals have been cooling in recent weeks while holding its ground, a sign that very few investors have been heading for the exits. It remains below its "max buy" level after bullish action recently confirmed a technical buy signal. Near term support is at its 50 DMA line (now $74.41).
>>> The latest Featured Stock Update with an annotated graph appeared on 9/14/2012. Click here.
View all notes |
Alert me of new notes |
CANSLIM.net Company Profile |
SEC |
Zacks Reports |
StockTalk |
News |
Chart |
Request a new note
C
A N
S L
I M
|
RNF
-
NYSE
Rentech Nitrogen Ptnr Lp
CHEMICALS - Agricultural Chemicals
|
$36.58
|
+1.74
4.99% |
$36.78
|
343,054
78.66% of 50 DAV
50 DAV is 436,100
|
$40.05
-8.66%
|
7/27/2012
|
$29.58
|
PP = $30.60
|
|
MB = $32.13
|
Most Recent Note - 10/16/2012 12:58:19 PM
G - Considerable gain today, rallying from its 50 DMA line defining important near-term support after the previously noted upward trendline violation. Gains have lacked volume conviction after it halted its slide.
>>> The latest Featured Stock Update with an annotated graph appeared on 10/4/2012. Click here.
View all notes |
Alert me of new notes |
CANSLIM.net Company Profile |
SEC |
Zacks Reports |
StockTalk |
News |
Chart |
Request a new note
C
A N
S L
I M
|
Symbol/Exchange
Company Name
Industry Group |
PRICE |
CHANGE
(%Change) |
Day High |
Volume
(% DAV)
(% 50 day avg vol) |
52 Wk Hi
% From Hi |
Featured
Date |
Price
Featured |
Pivot Featured |
|
Max Buy |
SWI
-
NYSE
Solarwinds Inc
COMPUTER SOFTWARE and SERVICES - Application Software
|
$54.09
|
+0.26
0.48% |
$54.37
|
387,063
48.26% of 50 DAV
50 DAV is 802,100
|
$60.95
-11.25%
|
7/25/2012
|
$47.82
|
PP = $47.89
|
|
MB = $50.28
|
Most Recent Note - 10/16/2012 1:05:48 PM
G - Recent weakness raised serious concerns. Halted its slide but failed to rebound. Caution is advised unless strength returns and it rises back above its 50 DMA line promptly. Prior highs in the $48 area define the next chart support level.
>>> The latest Featured Stock Update with an annotated graph appeared on 10/3/2012. Click here.
View all notes |
Alert me of new notes |
CANSLIM.net Company Profile |
SEC |
Zacks Reports |
StockTalk |
News |
Chart |
Request a new note
C
A N
S L
I M
|
TDG
-
NYSE
Transdigm Group Inc
AEROSPACE/DEFENSE - Aerospace/Defense Products and; Services
|
$150.90
|
+2.20
1.48% |
$151.34
|
1,111,298
272.64% of 50 DAV
50 DAV is 407,600
|
$152.62
-1.13%
|
8/16/2012
|
$132.23
|
PP = $136.44
|
|
MB = $143.26
|
Most Recent Note - 10/16/2012 1:07:16 PM
G - Gain today on quiet volume has it potentially poised for its best-ever close, extended from its prior base. Its 50 DMA line and prior lows define near-term support to watch in the $138 area where violations may trigger technical sell signals.
>>> The latest Featured Stock Update with an annotated graph appeared on 9/20/2012. Click here.
View all notes |
Alert me of new notes |
CANSLIM.net Company Profile |
SEC |
Zacks Reports |
StockTalk |
News |
Chart |
Request a new note
C
A N
S L
I M
|
ULTA
-
NASDAQ
Ulta Salon Cosm & Frag
SPECIALTY RETAIL - Specialty Retail, Other
|
$98.00
|
+2.70
2.83% |
$98.18
|
2,007,068
278.72% of 50 DAV
50 DAV is 720,100
|
$103.52
-5.33%
|
9/4/2012
|
$93.17
|
PP = $98.52
|
|
MB = $103.45
|
Most Recent Note - 10/16/2012 1:09:41 PM
Y - Undercut recent lows and violated its 50 DMA line with today's early weakness, yet it has managed a positive reversal after finding prompt support. Its Relative Strength Rating has slumped to 80, the minimum rank for ideal buy candidates under the fact-based investment system. The latest FSU analysis discussed its waning Relative Strength under the headline "Relative Strength Line Did Not Provide Confirmation - Friday, October 05, 2012".
>>> The latest Featured Stock Update with an annotated graph appeared on 10/5/2012. Click here.
View all notes |
Alert me of new notes |
CANSLIM.net Company Profile |
SEC |
Zacks Reports |
StockTalk |
News |
Chart |
Request a new note
C
A N
S L
I M
|
ULTI
-
NASDAQ
Ultimate Software Group
INTERNET - Internet Software and Services
|
$101.75
|
-0.83
-0.81% |
$103.20
|
95,731
65.12% of 50 DAV
50 DAV is 147,000
|
$106.40
-4.37%
|
8/27/2012
|
$98.36
|
PP = $99.19
|
|
MB = $104.15
|
Most Recent Note - 10/12/2012 12:17:39 PM
Y - Considerable gain today with higher volume, rallying from its 50 DMA line to within close striking distance of its 52-week high. Recent lows in the $96 area define near-term support to watch where violations would raise concerns and trigger technical sell signals.
>>> The latest Featured Stock Update with an annotated graph appeared on 9/27/2012. Click here.
View all notes |
Alert me of new notes |
CANSLIM.net Company Profile |
SEC |
Zacks Reports |
StockTalk |
News |
Chart |
Request a new note
C
A N
S L
I M
|
VSI
-
NYSE
Vitamin Shoppe Inc
SPECIALTY RETAIL - Specialty Retail, Other
|
$57.84
|
+0.02
0.03% |
$58.74
|
102,301
30.14% of 50 DAV
50 DAV is 339,400
|
$61.83
-6.45%
|
10/15/2012
|
$57.82
|
PP = $60.08
|
|
MB = $63.08
|
Most Recent Note - 10/15/2012 7:07:43 PM
Y - Volume totals have been below average in recent weeks while consolidating near its 50 DMA line. Color code is changed to yellow while still building on a new base, and subsequent volume-driven gains are needed to trigger a new technical buy signal. See latest FSU analysis for more details and a new annotated graph.
>>> The latest Featured Stock Update with an annotated graph appeared on 10/15/2012. Click here.
View all notes |
Alert me of new notes |
CANSLIM.net Company Profile |
SEC |
Zacks Reports |
StockTalk |
News |
Chart |
Request a new note
C
A N
S L
I M
|
Symbol/Exchange
Company Name
Industry Group |
PRICE |
CHANGE
(%Change) |
Day High |
Volume
(% DAV)
(% 50 day avg vol) |
52 Wk Hi
% From Hi |
Featured
Date |
Price
Featured |
Pivot Featured |
|
Max Buy |
WPI
-
NYSE
Watson Pharmaceuticals
DRUGS - Drugs - Generic
|
$89.28
|
+2.16
2.48% |
$89.90
|
916,462
100.30% of 50 DAV
50 DAV is 913,700
|
$88.33
1.08%
|
8/24/2012
|
$82.90
|
PP = $81.10
|
|
MB = $85.16
|
Most Recent Note - 10/16/2012 1:00:49 PM
G - Hitting new 52-week highs today with a big gain on below average volume. It is getting more extended from its prior base, and its 50 DMA line defines important support to watch on pullbacks.
>>> The latest Featured Stock Update with an annotated graph appeared on 9/28/2012. Click here.
View all notes |
Alert me of new notes |
CANSLIM.net Company Profile |
SEC |
Zacks Reports |
StockTalk |
News |
Chart |
Request a new note
C
A N
S L
I M
|