You are not logged in.
This means you
CAN ONLY VIEW reports that were published prior to Monday, February 26, 2024.
You
MUST UPGRADE YOUR MEMBERSHIP if you want to see any current reports.
AFTER MARKET UPDATE - THURSDAY, OCTOBER 15TH, 2020
Previous After Market Report Next After Market Report >>>
|
|
|
|
DOW |
-19.80 |
28,494.20 |
-0.07% |
|
Volume |
758,438,803 |
-1% |
|
Volume |
3,294,813,100 |
-3% |
|
NASDAQ |
-56.79 |
11,711.94 |
-0.48% |
|
Advancers |
1,697 |
57% |
|
Advancers |
1,839 |
54% |
|
S&P 500 |
-5.33 |
3,483.34 |
-0.15% |
|
Decliners |
1,293 |
43% |
|
Decliners |
1,549 |
46% |
|
Russell 2000 |
+17.23 |
1,638.88 |
+1.06% |
|
52 Wk Highs |
73 |
|
|
52 Wk Highs |
63 |
|
|
S&P 600 |
+12.22 |
929.57 |
+1.33% |
|
52 Wk Lows |
20 |
|
|
52 Wk Lows |
32 |
|
|
The major indices have shown improvement and have resumed a market uptrend as leadership has improved. Disciplined investors carefully may buy leading stocks on a case-by-case basis. Always remain ready to reduce market exposure in the event of any more substantial market downdrafts.
|
 |
Volume Lighter Behind Major Indices' 3rd Consecutive Losses
Kenneth J. Gruneisen - Passed the CAN SLIM® Master's Exam
The Dow lost 19 points, paring early morning declines of more than 300 points. The S&P 500 ticked down 0.2%, while the Nasdaq Composite fell 0.5%. All three benchmarks traded lower for the third consecutive session. The reported volume totals were lighter than the prior session on the NYSE and on the Nasdaq exchange. Breadth was slightly positive as advancers led decliners by a 9-7 margin on the NYSE and 6-5 on the Nasdaq exchange. There were 42 high-ranked companies from the Leaders List that hit new 52-week highs and were listed on the BreakOuts Page, versus the total of 57 on the prior session. New 52-week highs totals again contracted yet still outnumbered new 52-week lows totals on the NYSE and on the Nasdaq exchange. The major indices are in a confirmed uptrend (M criteria). New buying efforts may be justified in leading stocks on a case-by-case basis. 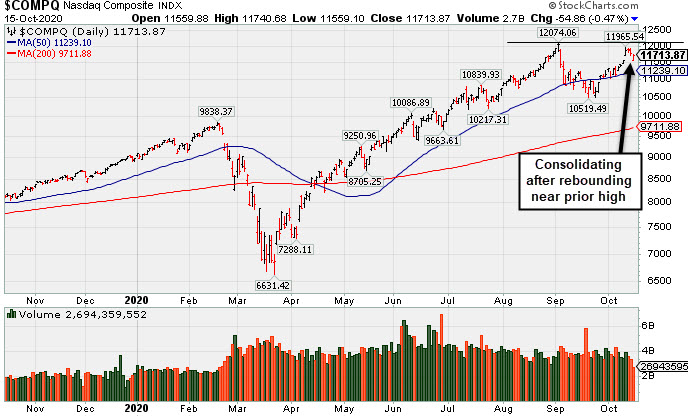 PICTURED: The Nasdaq Composite Index is quietly consolidating after rebounding near its record high.
Stocks finished lower Thursday, as investors continued to monitor fiscal stimulus negotiations and an uptick in COVID-19 infections. On Capitol Hill, Treasury Secretary Steven Mnuchin and House Speaker Nancy Pelosi continued fiscal aid talks, with President Donald Trump expressing openness to a more expensive plan, over the previously proposed $1.8 trillion bill. Meanwhile, a resurgence in European COVID-19 cases provided a headwind to risk sentiment, as several countries across the pond imposed fresh mitigation measures.
On the data front, U.S. initial jobless claims unexpectedly jumped to 898,000 in the latest week, the highest level since August. Continuing claims remained elevated, at 10.0 million, but below the prior period’s upwardly revised 11.2 million figure. Treasuries weakened with the yield on the benchmark 10-year note gaining one basis point to 0.73%.
Six of 11 S&P 500 sectors ended the day in positive territory. The more Cyclical-oriented pockets of the market outperformed, as Energy and Financial stocks bucked the downtrend. In earnings, Morgan Stanley (MS +1.34%) rose after topping Wall Street expectations on both the top and bottom line, helped by an 11% jump in investment banking revenue. Elsewhere, shares of the software company Fastly (FSLY -27.18%) plunged after missing revenue expectations amid geopolitical constraints on its largest customer, TickTok. Walgreens Boots Alliance (WBA +4.82%) rose after raising its dividend following an earnings beat. |
 Kenneth J. Gruneisen started out as a licensed stockbroker in August 1987, a couple of months prior to the historic stock market crash that took the Dow Jones Industrial Average down -22.6% in a single day. He has published daily fact-based fundamental and technical analysis on high-ranked stocks online for two decades. Through FACTBASEDINVESTING.COM, Kenneth provides educational articles, news, market commentary, and other information regarding proven investment systems that work in good times and bad.
Comments contained in the body of this report are technical opinions only and are not necessarily those of Gruneisen Growth Corp. The material herein has been obtained from sources believed to be reliable and accurate, however, its accuracy and completeness cannot be guaranteed. Our firm, employees, and customers may effect transactions, including transactions contrary to any recommendation herein, or have positions in the securities mentioned herein or options with respect thereto. Any recommendation contained in this report may not be suitable for all investors and it is not to be deemed an offer or solicitation on our part with respect to the purchase or sale of any securities. |
|
 |
Financial and Energy-Linked Groups Rose
Kenneth J. Gruneisen - Passed the CAN SLIM® Master's Exam
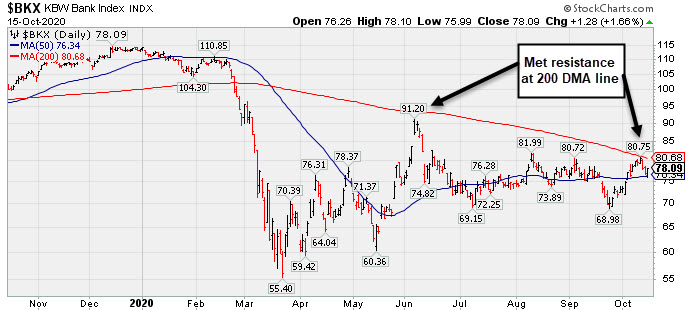
Financials had a positive influence as the Broker/Dealer Index ($XBD +1.63%) and Bank Index ($BKX +1.66%) both rose. The Retail Index ($RLX -0.24%) ended the session slightly lower. The Biotech Index ($BTK -1.23%) fell, and Semiconductor Index ($SOX -0.26%) also ended slightly lower, meanwhile the Networking Index ($NWX +0.45%) eked out a small gain. The Oil Services Index ($OSX +1.60%) outpaced the Integrated Oil Index ($XOI +0.39%) with gains, meanwhile the Gold & Silver Index ($XAU -1.08%) lost ground. PICTURED: The Bank Index ($BKX +1.66%) has met resistance at its 200-day moving average in June and again on the recent rebound effort. Any subsequent improvement above the 200 DMA line would be a reassuring sign. The recent lows define important near term support.
| Oil Services |
$OSX |
29.60 |
+0.47 |
+1.60% |
-62.19% |
| Integrated Oil |
$XOI |
613.06 |
+2.39 |
+0.39% |
-51.75% |
| Semiconductor |
$SOX |
2,410.90 |
-6.30 |
-0.26% |
+30.35% |
| Networking |
$NWX |
565.06 |
+2.52 |
+0.45% |
-3.14% |
| Broker/Dealer |
$XBD |
302.04 |
+4.85 |
+1.63% |
+4.02% |
| Retail |
$RLX |
3,587.54 |
-8.67 |
-0.24% |
+46.47% |
| Gold & Silver |
$XAU |
149.06 |
-1.62 |
-1.08% |
+39.41% |
| Bank |
$BKX |
78.09 |
+1.28 |
+1.66% |
-31.12% |
| Biotech |
$BTK |
5,479.58 |
-68.13 |
-1.23% |
+8.13% |
|
|
|
 |
Encountered Distributional Pressure When Poised for Breakout
Kenneth J. Gruneisen - Passed the CAN SLIM® Master's Exam
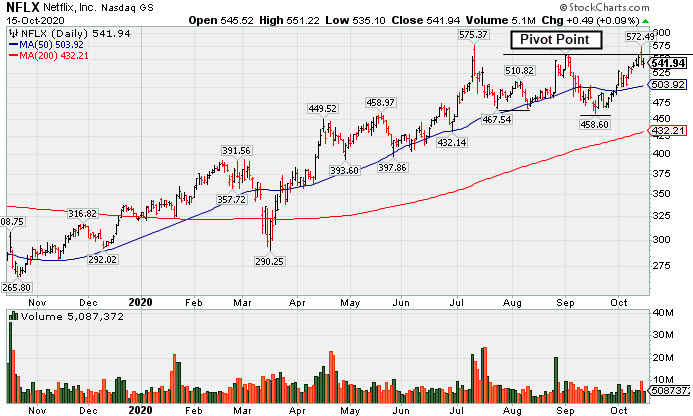
Netflix Inc (NFLX +$0.49 or +0.09% to $541.94) held its ground today with a lighter than average volume total. Its color code was changed to yellow and a new pivot point was cited as it formed a "double bottom" base, however there was a "negative reversal" on the prior session, action indicative of distributional pressure. A subsequent gain and close above the pivot point backed by at least +40% above average volume may trigger a new (or add-on) technical buy signal.
Its 50-day moving average (DMA) line ($503.92) and recent low ($458.60 on 9/18/20) define important near term support where any further deterioration would raise more serious concerns and trigger technical sell signals. NFLX currently has an Accumulation/Distribution Rating of B-, up from C- on 9/29/20 when it was last shown with an annotated graph under the headline,"Quiet Rebound Meeting Resistance at 50-Day Moving Average". It has traded up as much as +46.2% since it was highlighted in yellow with pivot point cited based on its 3/03/20 high plus 10 cents in the 4/13/20 mid-day report (read here).
Fundamentals remain strong. NFLX has essentially been consolidating since reporting Jun '20 earnings +165% on +25% sales revenues versus the year ago period. It has tallied 4 consecutive quarterly comparisons well above the +25% minimum guideline (C criteria). A previously noted downturn in FY '15 earnings (A criteria) has been followed by very strong growth. The number of top-rated funds owning its shares (I criteria) rose from 1,534 in Mar '17 to 2,788 in Jun '20, a reassuring sign concerning the I criteria. Its current Up/Down Volume Ratio of 1.0 is an unbiased indication its shares have been neutral concerning accumulation/distributional pressure over the past 50 days. The company has 423.4 million shares in the public float (S criteria) which can make it a less likely sprinter. It has a Timeliness rating of A, a Sponsorship rating of B.
Charts courtesy of www.stockcharts.com
 |
|
|
Color Codes Explained :
Y - Better candidates highlighted by our
staff of experts.
G - Previously featured
in past reports as yellow but may no longer be buyable under the
guidelines.
***Last / Change / Volume data in this table is the closing quote data***
Symbol/Exchange
Company Name
Industry Group |
PRICE |
CHANGE
(%Change) |
Day High |
Volume
(% DAV)
(% 50 day avg vol) |
52 Wk Hi
% From Hi |
Featured
Date |
Price
Featured |
Pivot Featured |
|
Max Buy |
 ADBE
-
NASDAQ
ADBE
-
NASDAQ
Adobe Inc
COMPUTER SOFTWARE and SERVICES - Application Software
|
$501.15
|
-5.16
-1.02% |
$502.50
|
2,041,987
65.14% of 50 DAV
50 DAV is 3,135,000
|
$536.88
-6.66%
|
9/10/2020
|
$488.46
|
PP = $536.88
|
|
MB = $563.72
|
Most Recent Note - 10/12/2020 5:35:42 PM
G - Posted a solid gain today with higher (near average) volume. Subsequent losses below the 50 DMA line ($479.59) would raise great concerns and trigger a technical sell signal. Faces near-term resistance due to overhead supply up to the $536 level. Fundamentals remain strong.
>>> FEATURED STOCK ARTICLE : Showed Resilience Near 50-Day Moving Average - 10/8/2020 |
View all notes |
Set NEW NOTE alert |
Company Profile |
SEC
News |
Chart |
Request a new note
C
A
S
I |
CRL
-
NYSE
Charles River Labs Intl
DRUGS - Biotechnology
|
$242.15
|
-2.49
-1.02% |
$245.95
|
281,809
87.52% of 50 DAV
50 DAV is 322,000
|
$250.29
-3.25%
|
7/15/2020
|
$192.66
|
PP = $189.95
|
|
MB = $199.45
|
Most Recent Note - 10/13/2020 4:35:01 PM
G - Posted a 3rd consecutive gain today with below average volume for a new all-time high. Its 50 DMA line ($220) defines support where any subsequent violation would raise concerns and trigger a technical sell signal. Raised fundamental concerns when it recently reported Jun '20 quarterly earnings -3% on +4% sales revenues, below the +25% minimum guideline (C criteria).
>>> FEATURED STOCK ARTICLE : New Record High for Charles River Labs - 10/9/2020 |
View all notes |
Set NEW NOTE alert |
Company Profile |
SEC
News |
Chart |
Request a new note
C
A
S
I |
AMD
-
NASDAQ
Advanced Micro Devices
ELECTRONICS - Semiconductor - Broad Line
|
$83.13
|
-1.08
-1.28% |
$84.72
|
33,546,674
62.03% of 50 DAV
50 DAV is 54,084,000
|
$94.28
-11.83%
|
8/31/2020
|
$90.42
|
PP = $87.39
|
|
MB = $91.76
|
Most Recent Note - 10/14/2020 7:27:46 PM
G - Pulled back today with lighter volume. Reportedly is considering buying Xilinx Inc (XLNX). Recently found support near its 50 DMA line ($82.24). Any deterioration below the 50 DMA line and the recent low ($73.85 on 9/18/20) would raise greater concerns and trigger more worrisome technical sell signals. It has not formed a sound base and faces some near-term resistance due to overhead supply up to the $94 level. Fundamentals remain strong. See the latest FSU analysis for more details and a new annotated graph.
>>> FEATURED STOCK ARTICLE : Consolidating Just Above 50-Day Moving Average - 10/14/2020 |
View all notes |
Set NEW NOTE alert |
Company Profile |
SEC
News |
Chart |
Request a new note
C
A
S
I |
TREX
-
NYSE
Trex Company Inc
MATERIALS and CONSTRUCTION - General Building Materials
|
$78.33
|
-0.40
-0.51% |
$79.25
|
613,639
73.14% of 50 DAV
50 DAV is 839,000
|
$81.23
-3.57%
|
6/26/2020
|
$54.53
|
PP = $66.47
|
|
MB = $69.79
|
Most Recent Note - 10/13/2020 4:36:35 PM
G - Posted a 4th consecutive gain today with below average volume while hitting a new all-time high. It did not form a sound base pattern. Any losses below the 50 DMA line ($71.89) or recent low ($63.32 on 9/21/20) would raise concerns and trigger technical sell signals. Do not be confused by the 2:1 share split effective 9/15/20 (Featured Price, Pivot Point, and Max Buy prices have been adjusted accordingly). Fundamentals remain strong.
>>> FEATURED STOCK ARTICLE : TREX Rebounded Above 50-Day Moving Average - 9/30/2020 |
View all notes |
Set NEW NOTE alert |
Company Profile |
SEC
News |
Chart |
Request a new note
C
A
S
I |
NFLX
-
NASDAQ
Netflix Inc
SPECIALTY RETAIL - Music and Video Stores
|
$541.94
|
+0.49
0.09% |
$551.22
|
5,092,046
89.41% of 50 DAV
50 DAV is 5,695,000
|
$575.37
-5.81%
|
10/14/2020
|
$547.45
|
PP = $557.39
|
|
MB = $585.26
|
Most Recent Note - 10/14/2020 7:35:04 PM
Y - Color code was changed to yellow, however there was a "negative reversal" after gapping up today for early gains challenging its 52-week high and pivot point. New pivot point was cited as it formed a "double bottom" base. A subsequent gain and close above the pivot point backed by at least +40% above average volume may trigger a new (or add-on) technical buy signal. Its 50 DMA line ($503.13) and recent low ($458.60 on 9/18/20) define important near term support where any further deterioration would raise more serious concerns and trigger technical sell signals.
>>> FEATURED STOCK ARTICLE : Encountered Distributional Pressure When Poised for Breakout - 10/15/2020 |
View all notes |
Set NEW NOTE alert |
Company Profile |
SEC
News |
Chart |
Request a new note
C
A
S
I |
Symbol/Exchange
Company Name
Industry Group |
PRICE |
CHANGE
(%Change) |
Day High |
Volume
(% DAV)
(% 50 day avg vol) |
52 Wk Hi
% From Hi |
Featured
Date |
Price
Featured |
Pivot Featured |
|
Max Buy |
LGIH
-
NASDAQ
L G I Homes Inc
Bldg-Resident/Comml
|
$129.12
|
+2.58
2.04% |
$129.60
|
147,530
53.26% of 50 DAV
50 DAV is 277,000
|
$131.95
-2.14%
|
10/1/2020
|
$123.17
|
PP = $124.04
|
|
MB = $130.24
|
Most Recent Note - 10/14/2020 7:33:17 PM
Y - Volume totals have been cooling while hovering near its all-time high. Color code was recently changed to yellow with new pivot point cited based on its 8/04/20 high plus 10 cents. Subsequent gains above the pivot point backed by at least +40% above average volume are still needed to clinch a proper new (or add-on) technical buy signal. The 50 DMA line ($114.67) and latest low ($101.30 on 9/21/20) define near-term support. Reported Jun '20 quarterly earnings +21% on +4% sales revenues, breaking a streak of 4 comparisons above the +25% minimum guideline (C criteria).
>>> FEATURED STOCK ARTICLE : New Base Formed by Strong Homebuilder - 10/1/2020 |
View all notes |
Set NEW NOTE alert |
Company Profile |
SEC
News |
Chart |
Request a new note
C
A
S
I |
NOW
-
NYSE
Servicenow Inc
Computer Sftwr-Enterprse
|
$520.68
|
+3.79
0.73% |
$522.99
|
945,249
63.27% of 50 DAV
50 DAV is 1,494,000
|
$522.77
-0.40%
|
8/20/2020
|
$453.34
|
PP = $454.79
|
|
MB = $477.53
|
Most Recent Note - 10/13/2020 4:30:50 PM
G - Posted a 3rd consecutive gain today with below average volume for another new all-time high. Found support at its 50 DMA line ($465.50) but did not form a new base of sufficient length. Fundamentals remain strong. Any losses below the 50 DMA line and prior low ($432.85 on 9/08/20) would raise concerns and trigger technical sell signals. See the latest FSU analysis for more details and a new annotated graph.
>>> FEATURED STOCK ARTICLE : Record High With Light Volume Behind 3rd Consecutive Gain - 10/13/2020 |
View all notes |
Set NEW NOTE alert |
Company Profile |
SEC
News |
Chart |
Request a new note
C
A
S
I |
VEEV
-
NYSE
Veeva Systems Inc Cl A
Computer Sftwr-Medical
|
$308.25
|
+7.64
2.54% |
$308.51
|
891,566
111.17% of 50 DAV
50 DAV is 802,000
|
$312.00
-1.20%
|
10/6/2020
|
$287.71
|
PP = $298.86
|
|
MB = $313.80
|
Most Recent Note - 10/14/2020 7:32:01 PM
Y - Pulled back today with higher volume, retreating from its all-time high after a streak of 7 consecutive gains. Found support at its 50 DMA line ($274) while forming a 6-week flat base. It was highlighted in yellow again in the 10/06/20 mid-day report with a new pivot point cited based on its 9/02/20 high plus 10 cents. A subsequent gain above the pivot point on 10/12/20 backed by +46% above average triggered a technical buy signal. Any losses below the 50 DMA line and recent lows would raise concerns and trigger technical sell signals. Reported earnings +31% on +33% sales revenues for the Jul '20 quarter versus the year ago period. Three of the past 4 quarterly comparisons were above the +25% minimum earnings guideline (C criteria)."
>>> FEATURED STOCK ARTICLE : First Sound Base Being Built After Considerable Rally - 10/6/2020 |
View all notes |
Set NEW NOTE alert |
Company Profile |
SEC
News |
Chart |
Request a new note
C
A
S
I |
TEAM
-
NASDAQ
Atlassian Corp Plc Cl A
Comp Sftwr-Spec Enterprs
|
$190.93
|
-0.89
-0.46% |
$191.17
|
2,187,905
144.51% of 50 DAV
50 DAV is 1,514,000
|
$199.95
-4.51%
|
10/12/2020
|
$193.77
|
PP = $199.60
|
|
MB = $209.58
|
Most Recent Note - 10/12/2020 5:37:29 PM
Y - Highlighted in yellow with new pivot point cited based on its 9/01/20 high plus 10 cents. Pulled back today with higher volume. It was perched within close striking distance of its 52-week high after recently wedging higher with gains lacking great volume conviction. Subsequent gains above the pivot point backed by at least +40% above average volume may trigger a new technical buy signal. Its Relative Strength Rating has improved to 84, above the 80+ minimum guideline for buy candidates. Three of the past 4 quarterly comparisons through Jun '20 were at or above the +25% minimum earnings guideline (C criteria). It was dropped from the Featured Stocks list on 8/07/20 and found support well above its 200 DMA line during recent consolidations. See the latest FSU analysis for more details and a new annotated graph.
>>> FEATURED STOCK ARTICLE : TEAM Perched Within Close Striking Distance of New Highs - 10/12/2020 |
View all notes |
Set NEW NOTE alert |
Company Profile |
SEC
News |
Chart |
Request a new note
C
A
S
I |
|
|
|
THESE ARE NOT BUY RECOMMENDATIONS!
Comments contained in the body of this report are technical
opinions only. The material herein has been obtained
from sources believed to be reliable and accurate, however,
its accuracy and completeness cannot be guaranteed.
This site is not an investment advisor, hence it does
not endorse or recommend any securities or other investments.
Any recommendation contained in this report may not
be suitable for all investors and it is not to be deemed
an offer or solicitation on our part with respect to
the purchase or sale of any securities. All trademarks,
service marks and trade names appearing in this report
are the property of their respective owners, and are
likewise used for identification purposes only.
This report is a service available
only to active Paid Premium Members.
You may opt-out of receiving report notifications
at any time. Questions or comments may be submitted
by writing to Premium Membership Services 665 S.E. 10 Street, Suite 201 Deerfield Beach, FL 33441-5634 or by calling 1-800-965-8307
or 954-785-1121.
|
|
|