You are not logged in.
This means you
CAN ONLY VIEW reports that were published prior to Monday, March 10, 2025.
You
MUST UPGRADE YOUR MEMBERSHIP if you want to see any current reports.
AFTER MARKET UPDATE - THURSDAY, OCTOBER 15TH, 2009
Previous After Market Report Next After Market Report >>>
|
|
|
|
DOW |
+47.08 |
10,062.94 |
+0.47% |
|
Volume |
1,357,790,790 |
+1% |
|
Volume |
2,257,024,600 |
-7% |
|
NASDAQ |
+1.06 |
2,173.29 |
+0.05% |
|
Advancers |
1,512 |
48% |
|
Advancers |
1,188 |
42% |
|
S&P 500 |
+4.54 |
1,096.56 |
+0.42% |
|
Decliners |
1,498 |
48% |
|
Decliners |
1,521 |
54% |
|
Russell 2000 |
-0.60 |
623.34 |
-0.10% |
|
52 Wk Highs |
386 |
|
|
52 Wk Highs |
158 |
|
|
S&P 600 |
+0.25 |
329.06 |
+0.08% |
|
52 Wk Lows |
2 |
|
|
52 Wk Lows |
8 |
|
|
 |
Indices End Higher Again, Shrugging Off Negative News
Adam Sarhan, Contributing Writer,
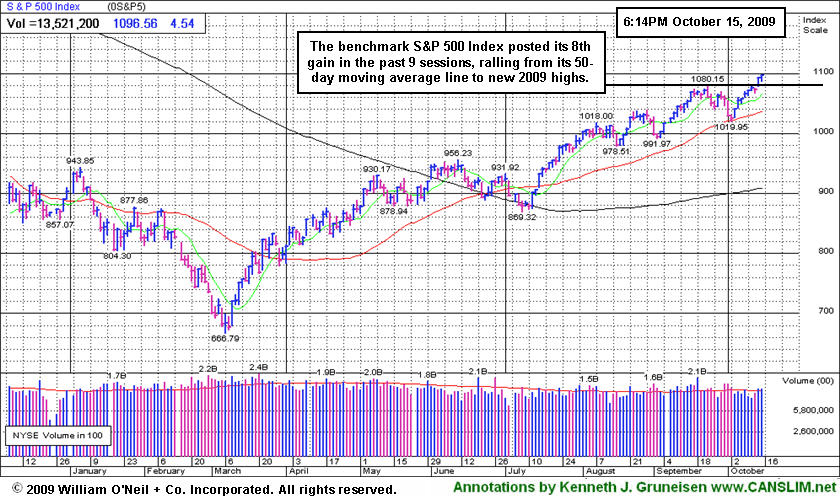
The major averages ended slightly higher, shrugging off disappointing earnings from some financial firms as oil prices rallied to a one-year high . Volume was near the prior session total on the NYSE and lower than the prior session on the Nasdaq exchange. Decliners led advancers by about a 5-to-4 ratio on the Nasdaq exchange with the mix was virtually even on the NYSE. There were 48 high-ranked companies from the CANSLIM.net Leaders List, making a new 52-week high and appearing on the CANSLIM.net BreakOuts Page, down from the 74 issues that appeared on the prior session. New 52-week highs substantially outnumbered new 52-week lows on both major exchanges, and new lows were again in the single digits.
The Labor Department said inflation will not be a threat as the economy emerges from the worst recession since the Great Depression. A separate report showed that jobless claims decreased more than forecast which was the latest round of data from the jobs market.
Citigroup Inc. (C -5%) and Goldman Sachs Group Inc. (GS -1.9%) fell after reporting their latest quarterly results which disappointed some investors. Event though both companies reported stronger than expected results, both stocks fell which suggested investors were not happy with the actual results. Elsewhere, a slew of oil-related companies rallied after crude oil jumped above $77 a barrel on an unexpected decline in US gasoline inventories.
The rally which began on March 12, 2009 remains intact as investors continue buying stocks and this rally marks its 7-month anniversary. Remember to always remain disciplined and sell a stock if it drops -7% below your purchase price.
PICTURED: The S&P 500 Index posted its 8th gain in the past 9 sessions, rallying from its 50-day moving average line to new 2009 highs.
|
|
|
 |
Healthcare Index Still Struggling
Kenneth J. Gruneisen - Passed the CAN SLIM® Master's Exam
Energy shares were standout gainers as the Integrated Oil Index ($XOI +1.42%) and Oil Services Index ($OSX +2.17%) posted gains. Meanwhile other defensive groups slumped as the Gold & Silver Index ($XAU -1.83%) and Healthcare Index ($HMO -1.79%) lost ground. The Broker/Dealer Index ($XBD -0.83%) and Bank Index ($BKX -0.69%) edged lower along with the Retail Index ($RLX -0.48%). Tech shares backpedaled as the Semiconductor Index ($SOX -1.41%) and Networking Index ($NWX -1.03%) fell more than -1%, and Internet Index ($IIX -0.27%) edged lower while the Biotechnology Index ($BTK +0.69%) eked out a small gain.
Charts courtesy www.stockcharts.com
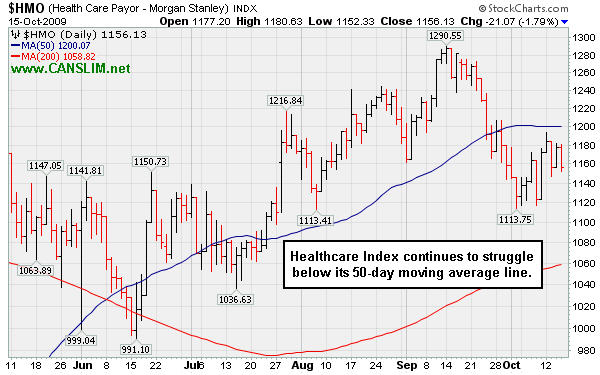
PICTURED: The Healthcare Index ($HMO -1.79%) continues to struggle below its 50-day moving average line.
| Oil Services |
$OSX |
209.37 |
+4.45 |
+2.17% |
+72.48% |
| Healthcare |
$HMO |
1,156.13 |
-21.07 |
-1.79% |
+20.41% |
| Integrated Oil |
$XOI |
1,102.62 |
+15.42 |
+1.42% |
+12.55% |
| Semiconductor |
$SOX |
329.78 |
-4.73 |
-1.41% |
+55.43% |
| Networking |
$NWX |
240.90 |
-2.50 |
-1.03% |
+67.42% |
| Internet |
$IIX |
223.26 |
-0.60 |
-0.27% |
+66.90% |
| Broker/Dealer |
$XBD |
125.24 |
-1.05 |
-0.83% |
+61.66% |
| Retail |
$RLX |
396.00 |
-1.89 |
-0.48% |
+41.80% |
| Gold & Silver |
$XAU |
175.96 |
-3.28 |
-1.83% |
+42.08% |
| Bank |
$BKX |
48.86 |
-0.34 |
-0.69% |
+10.24% |
| Biotech |
$BTK |
931.17 |
+6.40 |
+0.69% |
+43.88% |
|
|
|
 |
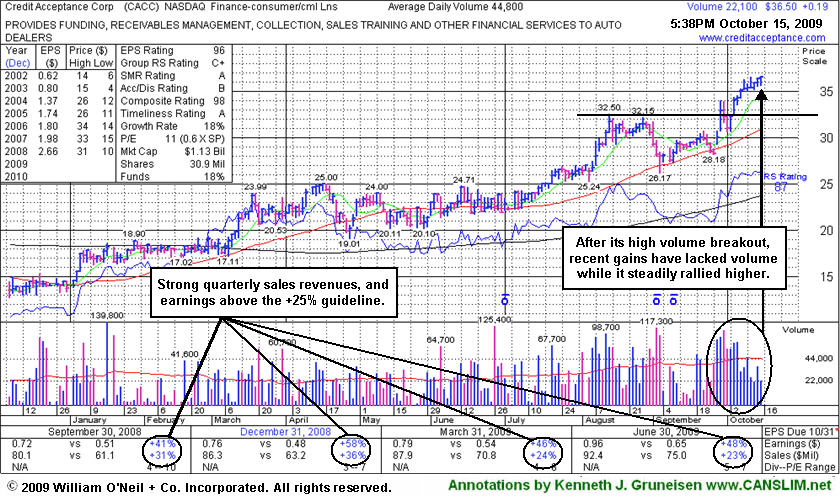
Finance Firm Extended After 10-Day Winning Streak
Kenneth J. Gruneisen - Passed the CAN SLIM® Master's Exam
Credit Acceptance Corp (CACC +$0.19 or +0.52% to $36.50) posted a 10th consecutive gain for a new high close well above its "max buy" level. Prior chart highs in the $32 area are now an important support level to watch on pullbacks. Disciplined investors might watch for a light volume pullback to offer an opportunity to accumulate shares without chasing them more than +5% above its prior chart highs. The high-ranked Finance-Consumer/Commercial Loans firm found prompt support near its prior chart highs during a brief pullback immediately following its 9/29/09 breakout with a considerable gain backed by more than 2 times average volume. Since triggering a technical buy signal we have noted that, "There is no overhead supply to hinder its upward price progress." However, it is now extended from its latest sound base, thus it is no longer buyable under the investment system guidelines. Since featured it has also risen above its 2006-2007 highs ($33-34) to new all-time highs, which is a very reassuring sign of strength. CACC was featured in yellow in the 9/29/09 mid-day report (read here).
|
|
|
Color Codes Explained :
Y - Better candidates highlighted by our
staff of experts.
G - Previously featured
in past reports as yellow but may no longer be buyable under the
guidelines.
***Last / Change / Volume quote data in this table corresponds with the timestamp on the note***
Symbol/Exchange
Company Name
Industry Group |
Last |
Chg. |
Vol
% DAV |
Date Featured |
Price Featured |
Latest Pivot Point
Featured |
Status |
| Latest Max Buy Price |
ARO
- NYSE
Aeropostale Inc
RETAIL - Apparel Stores
|
$41.75
|
-0.35
|
2,038,128
76% DAV
2,670,500
|
8/21/2009
(Date
Featured) |
$39.21
(Price
Featured) |
PP = $38.84 |
Y |
| MB = $40.78 |
Most Recent Note - 10/15/2009 4:32:23 PM
Y - Quietly consolidating just above important suport at its 50 DMA line. Last week it actually posted a weekly gain, despite encountering distributional pressure. This high-ranked leader in the Retail - Clothing/shoe group is still trading only -6% from its all-time highs. Color code was changed to yellow, with it permissible under the guidelines to accumulate shares from the first successful test of support at its short-term average line up to as much as 5% above its latest chart highs. A 50 DMA line violation could raise concerns and trigger a technical sell signal. The next key chart support level is prior highs in the $38 area. It was featured in yellow in the 8/21/09 Mid-Day BreakOuts Report (read here).
>>> The latest Featured Stock Update with an annotated graph appeared on 10/6/2009. click here.
|
|
C
A
S
I |
News |
Chart |
SEC
View all notes Alert
me of new notes
Company
Profile
|
ARST
-
|
$25.81
|
+0.69
|
833,143
127% DAV
657,800
|
9/1/2009
(Date
Featured) |
$19.91
(Price
Featured) |
PP = $20.90 |
G |
| MB = $21.95 |
Most Recent Note - 10/15/2009 4:34:25 PM
G - Hit another new all-time high today with its 5th consecutive. On 10/14/09 its considerable gain backed by more than 2 times average volume helped it rally from a short "base-on-base" type pattern. ARST was first featured in yellow at $19.91 in the 9/01/09 mid-day report with an annotated daily graph (read here). As previously noted, "Recent lows may be considered an initial support level. Prior chart highs and its 50 DMA line, coinciding in the $20 area, define an important technical support level to watch on pullbacks."
>>> The latest Featured Stock Update with an annotated graph appeared on 10/2/2009. click here.
|
|
C
A
S
I |
News |
Chart |
SEC
View all notes Alert
me of new notes
Company
Profile
|
ASIA
-
|
$23.02
|
-0.75
|
1,350,304
182% DAV
740,100
|
10/14/2009
(Date
Featured) |
$23.05
(Price
Featured) |
PP = $22.19 |
Y |
| MB = $23.30 |
Most Recent Note - 10/15/2009 4:35:41 PM
Y - Pulled back under its "max buy" level today after a gap up and considerable breakout gain with 5 times average volume triggered a technical buy signal on 10/14/09. It was highlighted in yellow in the 10/14/09 mid-day report (read here) as it blasted to a new 52-week high above its long-ago noted pivot point when featured in the August 2009 CANSLIM.net News (read here).
>>> The latest Featured Stock Update with an annotated graph appeared on 10/14/2009. click here.
|
|
C
A
S
I |
News |
Chart |
SEC
View all notes Alert
me of new notes
Company
Profile
|
BIDU
- NASDAQ
Baidu Inc Ads
INTERNET - Internet Information Providers
|
$399.90
|
-10.28
|
2,249,940
126% DAV
1,782,500
|
9/8/2009
(Date
Featured) |
$351.80
(Price
Featured) |
PP = $368.59 |
G |
| MB = $387.02 |
Most Recent Note - 10/15/2009 4:39:36 PM
G - Today was its 3rd loss in 4 sessions with above average volume, pulling back near prior chart highs in the $400 area. Recent gains for new 2009 highs challenged its 2007 all-time high of $429. BIDU was featured in yellow in the 9/08/09 Mid-Day BreakOuts Report (read here).
>>> The latest Featured Stock Update with an annotated graph appeared on 10/7/2009. click here.
|
|
C
A
S
I |
News |
Chart |
SEC
View all notes Alert
me of new notes
Company
Profile
|
CACC
- NASDAQ
Credit Acceptance Corp
FINANCIAL SERVICES - Credit Services
|
$36.50
|
+0.19
|
22,089
49% DAV
44,800
|
9/29/2009
(Date
Featured) |
$33.48
(Price
Featured) |
PP = $32.60 |
G |
| MB = $34.23 |
Most Recent Note - 10/15/2009 4:41:42 PM
G - Today it posted a 10th consecutive gain for a new high close well above its "max buy" level. The Finance - Consumer/Commercial Loans firm has maintained a great track record of annual and quarterly sales revenues and earnings increases. It was featured on 9/29/09 in yellow in the mid-day report (read here).
>>> The latest Featured Stock Update with an annotated graph appeared on 10/15/2009. click here.
|
|
C
A
S
I |
News |
Chart |
SEC
View all notes Alert
me of new notes
Company
Profile
|
CRM
- NYSE
Salesforce.com Inc
INTERNET - Internet Software & Services
|
$62.98
|
+0.49
|
1,112,067
52% DAV
2,122,300
|
8/16/2009
(Date
Featured) |
$47.12
(Price
Featured) |
PP = $45.59 |
G |
| MB = $47.87 |
Most Recent Note - 10/15/2009 4:43:11 PM
G - Gain for another new 2009 high backed by light volume. It is extended from any sound base. Technical support to watch now is an upward trendline connecting its July, August and October chart lows, a line which comes into play above additional support at its 50 DMA line.
>>> The latest Featured Stock Update with an annotated graph appeared on 10/5/2009. click here.
|
|
C
A
S
I |
News |
Chart |
SEC
View all notes Alert
me of new notes
Company
Profile
|
EBIX
- NASDAQ
Ebix Inc
COMPUTER SOFTWARE & SERVICES - Business Software & Services
|
$60.37
|
-0.10
|
179,966
92% DAV
194,600
|
8/28/2009
(Date
Featured) |
$45.86
(Price
Featured) |
PP = $45.35 |
G |
| MB = $47.62 |
Most Recent Note - 10/15/2009 4:44:00 PM
G - Quietly hovering in a tight range near all-time highs after its considerable gap up gain on 10/12/09 with heavy volume. Very extended from any sound base and well above support at its 50 DMA line, and more than +84% above its 200 DMA line, which are reminders to be watchful for sell signals.
>>> The latest Featured Stock Update with an annotated graph appeared on 10/13/2009. click here.
|
|
C
A
S
I |
News |
Chart |
SEC
View all notes Alert
me of new notes
Company
Profile
|
GMCR
- NASDAQ
Green Mtn Coffee Roastrs
FOOD & BEVERAGE - Processed & Packaged Goods
|
$73.34
|
+0.68
|
610,821
46% DAV
1,314,700
|
10/5/2009
(Date
Featured) |
$71.11
(Price
Featured) |
PP = $75.89 |
Y |
| MB = $79.68 |
Most Recent Note - 10/15/2009 4:45:25 PM
Y - Trading in a tight range above prior highs since its big gain on 9/28/09 with heavy volume. Its 9/29/09 high, before a negative reversal, is the basis for the latest pivot point noted as a "cup-with-high-handle pattern" since 10/05/09. Earlier notes discussed minor flaws in its base which resembled a cup-with-handle. Disciplined investors will watch for volume-driven gains to trigger a new technical buy signal before making any initial buys or add-on purchases.
>>> The latest Featured Stock Update with an annotated graph appeared on 10/12/2009. click here.
|
|
C
A
S
I |
News |
Chart |
SEC
View all notes Alert
me of new notes
Company
Profile
|
NVEC
- NASDAQ
N V E Corp
ELECTRONICS - Semiconductor - Specialized
|
$50.83
|
-0.78
|
42,717
52% DAV
82,200
|
8/26/2009
(Date
Featured) |
$55.32
(Price
Featured) |
PP = $57.60 |
G |
| MB = $60.48 |
Most Recent Note - 10/15/2009 4:46:46 PM
G - Prior chart lows in the $49 area are an important support level now, and further deterioration may completely negate its 7/23/09 breakaway gap and raise more serious concerns (especially if on heavy volume) and trigger worrisome technical sell signals. Concerns increase the longer it struggles below its 50 DMA line. That short-term average is now downward sloping and has acted as a resistance level while it has been consolidating.
>>> The latest Featured Stock Update with an annotated graph appeared on 9/30/2009. click here.
|
|
C
A
S
I |
News |
Chart |
SEC
View all notes Alert
me of new notes
Company
Profile
|
PEGA
- NASDAQ
Pegasystems Inc
COMPUTER SOFTWARE & SERVICES - Business Software & Services
|
$34.62
|
-0.03
|
172,232
47% DAV
363,300
|
9/9/2009
(Date
Featured) |
$31.14
(Price
Featured) |
PP = $33.35 |
Y |
| MB = $35.02 |
Most Recent Note - 10/15/2009 4:48:00 PM
Y - This high-ranked Computer Software - Financial firm is quietly hovering in a tight range, perched less than -3% from its all-time high. Important support to watch now is its 50 DMA line, where a violation would trigger a technical sell signal.
>>> The latest Featured Stock Update with an annotated graph appeared on 10/8/2009. click here.
|
|
C
A
S
I |
News |
Chart |
SEC
View all notes Alert
me of new notes
Company
Profile
|
SWI
- NYSE
Solarwinds Inc
COMPUTER SOFTWARE & SERVICES - Application Software
|
$21.99
|
-0.96
|
387,069
80% DAV
481,200
|
9/30/2029
(Date
Featured) |
$22.03
(Price
Featured) |
PP = $21.72 |
Y |
| MB = $22.81 |
Most Recent Note - 10/15/2009 4:52:05 PM
Y - Pulled back further today on lighter volume after a negative reversal on 10/14/09 following a gap up. Color code is changed to yellow while consolidating near its previously cited pivot point. Important support to watch is at its 50 DMA line. It was featured in the October 2009 issue of CANSLIM.net News (read here).
>>> The latest Featured Stock Update with an annotated graph appeared on 9/30/2009. click here.
|
|
C
A
S
I |
News |
Chart |
SEC
View all notes Alert
me of new notes
Company
Profile
|
WNS
- NYSE
W N S Holdings Ltd Ads
DIVERSIFIED SERVICES - Business/Management Services
|
$15.50
|
+0.20
|
70,784
123% DAV
57,500
|
9/28/2009
(Date
Featured) |
$15.28
(Price
Featured) |
PP = $16.10 |
Y |
| MB = $16.91 |
Most Recent Note - 10/15/2009 4:53:46 PM
Y - Gain today on slightly above average volume. Recently found support at its 50 DMA line. Color code was changed to yellow again, yet it technically needs to rally for a new high close above $16 for its outlook to meaningfully improve. It has encountered stubborn resistance since featured in yellow in the 9/28/09 mid-day report (read here). Quarterly earnings have been above the +25% guideline and its annual earnings history has been great, satisfying the C & A criteria. However, sales revenues growth has decelerated.
>>> The latest Featured Stock Update with an annotated graph appeared on 9/28/2009. click here.
|
|
C
A
S
I |
News |
Chart |
SEC
View all notes Alert
me of new notes
Company
Profile
|
|
|
|
THESE ARE NOT BUY RECOMMENDATIONS!
Comments contained in the body of this report are technical
opinions only. The material herein has been obtained
from sources believed to be reliable and accurate, however,
its accuracy and completeness cannot be guaranteed.
This site is not an investment advisor, hence it does
not endorse or recommend any securities or other investments.
Any recommendation contained in this report may not
be suitable for all investors and it is not to be deemed
an offer or solicitation on our part with respect to
the purchase or sale of any securities. All trademarks,
service marks and trade names appearing in this report
are the property of their respective owners, and are
likewise used for identification purposes only.
This report is a service available
only to active Paid Premium Members.
You may opt-out of receiving report notifications
at any time. Questions or comments may be submitted
by writing to Premium Membership Services 665 S.E. 10 Street, Suite 201 Deerfield Beach, FL 33441-5634 or by calling 1-800-965-8307
or 954-785-1121.
|
|
|


