***Last / Change / Volume data in this table is the closing quote data***
Symbol/Exchange
Company Name
Industry Group |
PRICE |
CHANGE
(%Change) |
Day High |
Volume
(% DAV)
(% 50 day avg vol) |
52 Wk Hi
% From Hi |
Featured
Date |
Price
Featured |
Pivot Featured |
|
Max Buy |
ABV
-
NYSE
Comp De Bebidas Adr
FOOD and BEVERAGE - Beverages - Brewers
|
$140.11
|
+0.40
0.29% |
$140.53
|
867,962
145.90% of 50 DAV
50 DAV is 594,900
|
$140.07
0.03%
|
6/29/2010
|
$104.74
|
PP = $109.33
|
|
MB = $114.80
|
Most Recent Note - 10/13/2010 12:03:07 PM
G - This Brazil-based beverage firm hit yet another new all-time high today with 9th consecutive gain. It is very extended from a sound base, and its 50 DMA line ($114.33 now) defines support.
>>> The latest Featured Stock Update with an annotated graph appeared on 10/11/2010. Click here.
View all notes |
Alert me of new notes |
CANSLIM.net Company Profile |
SEC |
Zacks Reports |
StockTalk |
News |
Chart |
Request a new note
C
A N
S L
I M


|
ARUN
-
NASDAQ
Aruba Networks Inc
COMPUTER HARDWARE - Networking andamp; Communication Dev
|
$20.74
|
+0.09
0.44% |
$21.07
|
1,210,352
51.88% of 50 DAV
50 DAV is 2,332,800
|
$22.80
-9.04%
|
8/30/2010
|
$18.12
|
PP = $18.51
|
|
MB = $19.44
|
Most Recent Note - 10/12/2010 4:58:30 PM
G - Considerable gain and close near the session high, rallying up from its 50 DMA line. Its low of $18.35 on 10/07/10 also helps define important support while serving as a third point for an upward trendline connecting its May- August lows.
>>> The latest Featured Stock Update with an annotated graph appeared on 9/2/2010. Click here.
View all notes |
Alert me of new notes |
CANSLIM.net Company Profile |
SEC |
Zacks Reports |
StockTalk |
News |
Chart |
Request a new note
C
A N
S L
I M
|
BIDU
-
NASDAQ
Baidu Inc Ads
INTERNET - Internet Information Providers
|
$98.20
|
-1.75
-1.75% |
$100.06
|
9,202,537
94.28% of 50 DAV
50 DAV is 9,761,200
|
$107.19
-8.39%
|
9/17/2010
|
$85.73
|
PP = $88.42
|
|
MB = $92.84
|
Most Recent Note - 10/13/2010 5:45:07 PM
G - It remains stalled since last noted in the 10/06/10 mid-day report - "Perched within close striking distance of its best-ever close ($103.82), it has been repeatedly noted as extended from any sound base' yet could go on to produce more climactic gains. A subsequent violation of its 10/04/10 low $95.12 would raise concerns, while the nearest chart support is at old highs and its 50 DMA line."
>>> The latest Featured Stock Update with an annotated graph appeared on 10/7/2010. Click here.
View all notes |
Alert me of new notes |
CANSLIM.net Company Profile |
SEC |
Zacks Reports |
StockTalk |
News |
Chart |
Request a new note
C
A N
S L
I M
|
CACC
-
NASDAQ
Credit Acceptance Corp
FINANCIAL SERVICES - Credit Services
|
$58.51
|
-0.06
-0.10% |
$58.80
|
17,357
46.53% of 50 DAV
50 DAV is 37,300
|
$63.45
-7.78%
|
7/29/2010
|
$52.04
|
PP = $54.07
|
|
MB = $56.77
|
Most Recent Note - 10/13/2010 5:51:07 PM
G - The recent chart low ($55.07 on 10/04/10) is the nearest chart support level to watch above its long ago chart highs ($53.97). Its 50 DMA line has been acting as resistance since last noted on 10/07/10 that - "A convincing rebound above it would help its outlook improve."
>>> The latest Featured Stock Update with an annotated graph appeared on 9/30/2010. Click here.
View all notes |
Alert me of new notes |
CANSLIM.net Company Profile |
SEC |
Zacks Reports |
StockTalk |
News |
Chart |
Request a new note
C
A N
S L
I M
|
CMG
-
NYSE
Chipotle Mexican Grill
LEISURE - Restaurants
|
$181.27
|
+0.29
0.16% |
$181.31
|
374,691
61.84% of 50 DAV
50 DAV is 605,900
|
$182.96
-0.92%
|
9/1/2010
|
$158.31
|
PP = $155.52
|
|
MB = $163.30
|
Most Recent Note - 10/12/2010 5:11:00 PM
G - Inching to new all-time highs with average volume behind recent gains. Its 50 DMA line (now $161.49) defines chart support above its prior highs in the $155 area.
>>> The latest Featured Stock Update with an annotated graph appeared on 9/1/2010. Click here.
View all notes |
Alert me of new notes |
CANSLIM.net Company Profile |
SEC |
Zacks Reports |
StockTalk |
News |
Chart |
Request a new note
C
A N
S L
I M
|
Symbol/Exchange
Company Name
Industry Group |
PRICE |
CHANGE
(%Change) |
Day High |
Volume
(% DAV)
(% 50 day avg vol) |
52 Wk Hi
% From Hi |
Featured
Date |
Price
Featured |
Pivot Featured |
|
Max Buy |
CTRP
-
NASDAQ
Ctrip.Com Intl Ltd Adr
LEISURE - Resorts and Casinos
|
$48.27
|
-0.25
-0.52% |
$49.00
|
1,419,004
80.79% of 50 DAV
50 DAV is 1,756,500
|
$49.23
-1.96%
|
9/24/2010
|
$46.75
|
PP = $47.11
|
|
MB = $49.47
|
Most Recent Note - 10/13/2010 5:30:21 PM
Y - Gain today with +49% above average volume while rising above its previously cited pivot point again was an encouraging and reassuring sign of institutional (I criteria) buying demand, meanwhile it finished just 5 cents off its best-ever close.
>>> The latest Featured Stock Update with an annotated graph appeared on 9/28/2010. Click here.
View all notes |
Alert me of new notes |
CANSLIM.net Company Profile |
SEC |
Zacks Reports |
StockTalk |
News |
Chart |
Request a new note
C
A N
S L
I M
|
EBIX
-
NASDAQ
Ebix Inc
COMPUTER SOFTWARE and SERVICES - Business Software and Services
|
$24.14
|
+0.21
0.88% |
$24.25
|
594,707
101.71% of 50 DAV
50 DAV is 584,700
|
$25.61
-5.74%
|
9/23/2010
|
$21.78
|
PP = $22.74
|
|
MB = $23.88
|
Most Recent Note - 10/13/2010 11:36:39 AM
G - Gapped up today, continuing a healthy consolidation since its negative reversal on 10/06/10. Its strength is impressive, however the tight closes in the past 3 weeks (bes viewed on its weekly chart) are not considered an advanced "3-weeks tight" type pattern due to its lack of significant progress above the pivot point recently cited. (JOBS was noted today as a better example of a "3 weeks tight" pattern.)
>>> The latest Featured Stock Update with an annotated graph appeared on 9/24/2010. Click here.
View all notes |
Alert me of new notes |
CANSLIM.net Company Profile |
SEC |
Zacks Reports |
StockTalk |
News |
Chart |
Request a new note
C
A N
S L
I M
|
EGO
-
NYSE
Eldorado Gold Corp
METALS and MINING - Gold
|
$18.56
|
-0.15
-0.80% |
$18.85
|
3,336,530
71.34% of 50 DAV
50 DAV is 4,676,900
|
$20.23
-8.26%
|
8/19/2010
|
$18.25
|
PP = $19.17
|
|
MB = $20.13
|
Most Recent Note - 10/12/2010 7:08:28 PM
Y - Volume totals have been cooling while consolidating near its 50 DMA line. Its recent low ($17.65) defines an important chart support level.
>>> The latest Featured Stock Update with an annotated graph appeared on 10/12/2010. Click here.
View all notes |
Alert me of new notes |
CANSLIM.net Company Profile |
SEC |
Zacks Reports |
StockTalk |
News |
Chart |
Request a new note
C
A N
S L
I M
|
FFIV
-
NASDAQ
F 5 Networks Inc
INTERNET - Internet Software and Services
|
$95.66
|
-1.08
-1.12% |
$97.43
|
1,585,422
77.46% of 50 DAV
50 DAV is 2,046,700
|
$112.05
-14.63%
|
6/16/2010
|
$74.50
|
PP = $74.10
|
|
MB = $77.81
|
Most Recent Note - 10/12/2010 5:01:25 PM
G - Closed near the session high today as it rebounded above its 50 DMA line. Recent lows in the $90 area define the nearest support below that important short-term average.
>>> The latest Featured Stock Update with an annotated graph appeared on 9/13/2010. Click here.
View all notes |
Alert me of new notes |
CANSLIM.net Company Profile |
SEC |
Zacks Reports |
StockTalk |
News |
Chart |
Request a new note
C
A N
S L
I M
|
FOSL
-
NASDAQ
Fossil Inc
CONSUMER DURABLES - Recreational Goods, Other
|
$54.33
|
+1.27
2.39% |
$54.94
|
833,457
103.63% of 50 DAV
50 DAV is 804,300
|
$55.51
-2.13%
|
8/10/2010
|
$45.54
|
PP = $42.69
|
|
MB = $44.82
|
 Most Recent Note - 10/14/2010 4:39:40 PM
G - Gain today with lighter volume after testing the upward trendline previously noted as initial support to watch after it has been repeatedly noted as "extended from any sound base." The next chart support level is its 50 DMA line.
>>> The latest Featured Stock Update with an annotated graph appeared on 10/5/2010. Click here.
View all notes |
Alert me of new notes |
CANSLIM.net Company Profile |
SEC |
Zacks Reports |
StockTalk |
News |
Chart |
Request a new note
C
A N
S L
I M
|
Symbol/Exchange
Company Name
Industry Group |
PRICE |
CHANGE
(%Change) |
Day High |
Volume
(% DAV)
(% 50 day avg vol) |
52 Wk Hi
% From Hi |
Featured
Date |
Price
Featured |
Pivot Featured |
|
Max Buy |
HMSY
-
NASDAQ
H M S Holdings Corp
COMPUTER SOFTWARE and SERVICES - Healthcare Information Service
|
$62.11
|
+0.29
0.47% |
$62.39
|
212,765
120.21% of 50 DAV
50 DAV is 177,000
|
$61.98
0.21%
|
9/27/2010
|
$57.97
|
PP = $58.36
|
|
MB = $61.28
|
Most Recent Note - 10/13/2010 5:40:32 PM
G - Closed at a new high today. In recent sessions it dipped below its "max buy" level and continued inching higher without great volume conviction behind gains since 9/27/10 when featured in yellow.
>>> The latest Featured Stock Update with an annotated graph appeared on 9/27/2010. Click here.
View all notes |
Alert me of new notes |
CANSLIM.net Company Profile |
SEC |
Zacks Reports |
StockTalk |
News |
Chart |
Request a new note
C
A N
S L
I M
|
HS
-
NYSE
Healthspring Inc
HEALTH SERVICES - Health Care Plans
|
$26.52
|
-0.08
-0.30% |
$26.95
|
535,649
76.29% of 50 DAV
50 DAV is 702,100
|
$27.10
-2.14%
|
8/27/2010
|
$19.91
|
PP = $19.75
|
|
MB = $20.74
|
Most Recent Note - 10/8/2010 4:19:55 PM
G - Gain today with light volume for its second best close ever. Support to watch is prior chart highs in the $19-20 area.
>>> The latest Featured Stock Update with an annotated graph appeared on 8/27/2010. Click here.
View all notes |
Alert me of new notes |
CANSLIM.net Company Profile |
SEC |
Zacks Reports |
StockTalk |
News |
Chart |
Request a new note
C
A N
S L
I M
|
IGTE
-
NASDAQ
Igate Corp
COMPUTER SOFTWARE and SERVICES - Information Technology Service
|
$18.38
|
+0.05
0.27% |
$18.66
|
456,951
113.25% of 50 DAV
50 DAV is 403,500
|
$19.45
-5.50%
|
9/8/2010
|
$17.29
|
PP = $18.26
|
|
MB = $19.17
|
Most Recent Note - 10/13/2010 11:00:12 AM
Y - Gapped up again today and quickly reversed into the red, volatile and actively trading after another strong earnings report. Last week it ended by rallying from important chart support at its 50 DMA line back to near its pivot point. More damaging losses would raise concerns and trigger technical sell signals.
>>> The latest Featured Stock Update with an annotated graph appeared on 9/10/2010. Click here.
View all notes |
Alert me of new notes |
CANSLIM.net Company Profile |
SEC |
Zacks Reports |
StockTalk |
News |
Chart |
Request a new note
C
A N
S L
I M
|
JOBS
-
NASDAQ
Fifty One Job Inc Ads
DIVERSIFIED SERVICES - Staffing and; Outsourcing Service
|
$44.38
|
-1.69
-3.66% |
$45.65
|
396,568
253.24% of 50 DAV
50 DAV is 156,600
|
$46.48
-4.53%
|
10/13/2010
|
$42.07
|
PP = $40.60
|
|
MB = $42.63
|
Most Recent Note - 10/14/2010 2:16:46 PM
G - Gapped down today, pulling back after quickly getting extended from an advanced "3 weeks tight" type pattern noted on the prior session. Disciplined investors avoid chasing stocks extended more than +5% above prior highs and always limit losses if a stock falls -7-8% from their purchase price.
>>> The latest Featured Stock Update with an annotated graph appeared on 9/16/2010. Click here.
View all notes |
Alert me of new notes |
CANSLIM.net Company Profile |
SEC |
Zacks Reports |
StockTalk |
News |
Chart |
Request a new note
C
A N
S L
I M
|
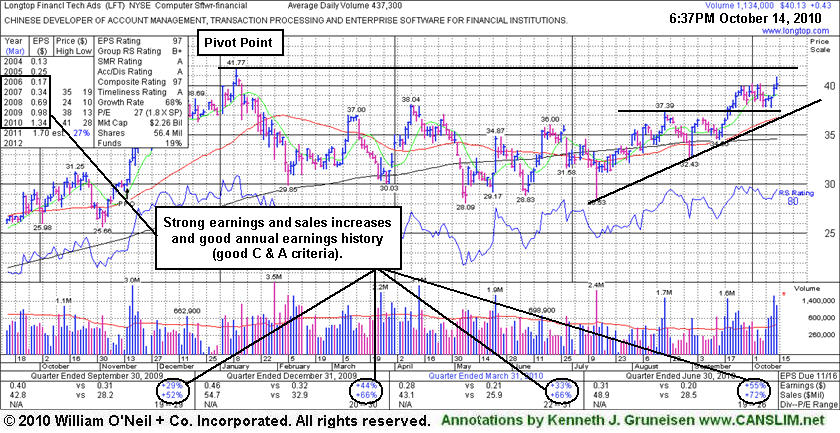
LFT
-
NYSE
Longtop Financl Tech Ads
COMPUTER SOFTWARE and SERVICES - Business Software and Services
|
$40.13
|
+0.43
1.08% |
$40.86
|
1,134,982
280.52% of 50 DAV
50 DAV is 404,600
|
$41.77
-3.93%
|
10/14/2010
|
$39.97
|
PP = $41.87
|
|
MB = $43.96
|
Most Recent Note - 10/14/2010 1:00:31 PM
Y - It has formed a 10-month long flat base and maintained a very strong sales revenues and earnings track record since dropped from the Featured Stocks list on 2/02/10. Color code is changed to yellow with pivot point based on its all-time high plus ten cents. Widespread strength in China-based issues combined with leadership in the Computer Software groups (L criteria) are reassuring signs. Patient and disciplined investors will resist the urge to get in "early" and wait for a proper buy signal, while it is now within -5% of its 52-week high after a streak of small gains with above average volume.
>>> The latest Featured Stock Update with an annotated graph appeared on 1/26/2010. Click here.
View all notes |
Alert me of new notes |
CANSLIM.net Company Profile |
SEC |
Zacks Reports |
StockTalk |
News |
Chart |
Request a new note
C
A N
S L
I M
|
Symbol/Exchange
Company Name
Industry Group |
PRICE |
CHANGE
(%Change) |
Day High |
Volume
(% DAV)
(% 50 day avg vol) |
52 Wk Hi
% From Hi |
Featured
Date |
Price
Featured |
Pivot Featured |
|
Max Buy |
LULU
-
NASDAQ
Lululemon Athletica
MANUFACTURING - Textile Manufacturing
|
$46.73
|
+1.14
2.50% |
$46.73
|
907,158
82.77% of 50 DAV
50 DAV is 1,096,000
|
$48.45
-3.55%
|
10/8/2010
|
$47.66
|
PP = $46.67
|
|
MB = $49.00
|
Most Recent Note - 10/14/2010 2:44:03 PM
Y - Volume totals have been near average while consolidating near its prior highs since its 10/08/10 technical breakout with heavier volume was noted. Prior highs in the $45-46 area define initial chart support to watch.
>>> The latest Featured Stock Update with an annotated graph appeared on 10/8/2010. Click here.
View all notes |
Alert me of new notes |
CANSLIM.net Company Profile |
SEC |
Zacks Reports |
StockTalk |
News |
Chart |
Request a new note
C
A N
S L
I M
|
MELI
-
NASDAQ
Mercadolibre Inc
INTERNET - Internet Software and; Services
|
$64.56
|
-0.35
-0.54% |
$65.01
|
783,240
86.99% of 50 DAV
50 DAV is 900,400
|
$76.81
-15.95%
|
5/13/2010
|
$54.21
|
PP = $55.85
|
|
MB = $58.64
|
Most Recent Note - 10/12/2010 5:27:31 PM
G - After a damaging gap down amid skeptical headlines about its earnings outlook, a strong close today near the session high for a small loss with 3 times average volume was an encouraging sign that it attracted support.
>>> The latest Featured Stock Update with an annotated graph appeared on 8/26/2010. Click here.
View all notes |
Alert me of new notes |
CANSLIM.net Company Profile |
SEC |
Zacks Reports |
StockTalk |
News |
Chart |
Request a new note
C
A N
S L
I M
|
MRX
-
NYSE
Medicis Pharmaceut Cl A
DRUGS - Biotechnology
|
$30.03
|
-0.76
-2.47% |
$30.87
|
1,056,706
92.02% of 50 DAV
50 DAV is 1,148,300
|
$30.94
-2.94%
|
8/12/2010
|
$26.88
|
PP = $26.71
|
|
MB = $28.05
|
Most Recent Note - 10/14/2010 4:42:17 PM
G - Consolidating from its 52-week high reached on the prior session, today it closed near the previously noted upward trendline, the initial chart support level to watch above its 50 DMA line and its recent chart lows.
>>> The latest Featured Stock Update with an annotated graph appeared on 10/4/2010. Click here.
View all notes |
Alert me of new notes |
CANSLIM.net Company Profile |
SEC |
Zacks Reports |
StockTalk |
News |
Chart |
Request a new note
C
A N
S L
I M
|
MWIV
-
NASDAQ
M W I Veterinary Supply
HEALTH SERVICES - Medical Instruments and; Supplies
|
$56.98
|
+0.11
0.19% |
$57.14
|
50,234
80.37% of 50 DAV
50 DAV is 62,500
|
$59.50
-4.24%
|
7/29/2010
|
$52.05
|
PP = $52.09
|
|
MB = $54.69
|
Most Recent Note - 10/12/2010 1:00:16 PM
G - Pulling back for a small loss today on higher volume, it remains perched near its 52-week high. Volume totals had been cooling in recent weeks. No overhead supply remains to act as resistance. Its nearby 50 DMA line defines chart support.
>>> The latest Featured Stock Update with an annotated graph appeared on 9/7/2010. Click here.
View all notes |
Alert me of new notes |
CANSLIM.net Company Profile |
SEC |
Zacks Reports |
StockTalk |
News |
Chart |
Request a new note
C
A N
S L
I M
|
NEM
-
NYSE
Newmont Mining Corp
METALS and MINING - Gold
|
$62.54
|
-0.64
-1.01% |
$63.30
|
7,101,934
117.76% of 50 DAV
50 DAV is 6,031,100
|
$65.50
-4.52%
|
8/31/2010
|
$61.32
|
PP = $63.48
|
|
MB = $66.65
|
Most Recent Note - 10/13/2010 12:48:45 PM
Y - Gapped up today, rising amid strength in the Mining - Gold/Silver/Gems group (L criteria). Its Relative Strength rank (75) and RS line have been waning for several weeks, a recently noted concern.
>>> The latest Featured Stock Update with an annotated graph appeared on 9/14/2010. Click here.
View all notes |
Alert me of new notes |
CANSLIM.net Company Profile |
SEC |
Zacks Reports |
StockTalk |
News |
Chart |
Request a new note
C
A N
S L
I M
|
Symbol/Exchange
Company Name
Industry Group |
PRICE |
CHANGE
(%Change) |
Day High |
Volume
(% DAV)
(% 50 day avg vol) |
52 Wk Hi
% From Hi |
Featured
Date |
Price
Featured |
Pivot Featured |
|
Max Buy |
NEOG
-
NASDAQ
Neogen Corp
DRUGS - Diagnostic Substances
|
$35.90
|
+0.59
1.67% |
$36.18
|
138,972
138.42% of 50 DAV
50 DAV is 100,400
|
$35.50
1.13%
|
9/1/2010
|
$30.79
|
PP = $30.49
|
|
MB = $32.01
|
Most Recent Note - 10/13/2010 3:40:50 PM
G - Considerable gain today with near average volume, hitting a new all-time high. Prior highs in the $30 area define initial support to watch.
>>> The latest Featured Stock Update with an annotated graph appeared on 10/13/2010. Click here.
View all notes |
Alert me of new notes |
CANSLIM.net Company Profile |
SEC |
Zacks Reports |
StockTalk |
News |
Chart |
Request a new note
C
A N
S L
I M
|
NFLX
-
NASDAQ
Netflix Inc
SPECIALTY RETAIL - Music and Video Stores
|
$152.78
|
-1.83
-1.18% |
$156.76
|
3,132,075
54.95% of 50 DAV
50 DAV is 5,700,100
|
$174.40
-12.40%
|
8/10/2010
|
$124.05
|
PP = $124.00
|
|
MB = $130.20
|
Most Recent Note - 10/14/2010 2:26:39 PM
G - Continuing its consolidation in a tight range with quieter volume totals after enduring recent distributional pressure following a previously noted "negative reversal" at its all-time high on 9/30/10. Its recent chart low ($148.05) and 50 DMA line are the next chart support levels to watch.
>>> The latest Featured Stock Update with an annotated graph appeared on 10/1/2010. Click here.
View all notes |
Alert me of new notes |
CANSLIM.net Company Profile |
SEC |
Zacks Reports |
StockTalk |
News |
Chart |
Request a new note
C
A N
S L
I M
|
NTAP
-
NASDAQ
Netapp Inc
COMPUTER HARDWARE - Data Storage Devices
|
$50.39
|
+0.77
1.55% |
$50.85
|
7,832,091
91.45% of 50 DAV
50 DAV is 8,564,200
|
$51.40
-1.96%
|
9/8/2010
|
$46.98
|
PP = $44.99
|
|
MB = $47.24
|
Most Recent Note - 10/13/2010 5:35:29 PM
G - Consolidating above its 50 DMA line and prior highs that now coincide to define chart support in the $45 area.
>>> The latest Featured Stock Update with an annotated graph appeared on 9/8/2010. Click here.
View all notes |
Alert me of new notes |
CANSLIM.net Company Profile |
SEC |
Zacks Reports |
StockTalk |
News |
Chart |
Request a new note
C
A N
S L
I M
|
ORCL
-
NASDAQ
Oracle Corp
COMPUTER SOFTWARE and SERVICES - Application Software
|
$28.33
|
-0.27
-0.94% |
$28.70
|
38,121,941
103.10% of 50 DAV
50 DAV is 36,976,100
|
$28.91
-2.01%
|
9/20/2010
|
$27.32
|
PP = $26.73
|
|
MB = $28.07
|
Most Recent Note - 10/13/2010 11:11:26 AM
G - Color code is changed to green as gains today and in recent sessions, without great volume conviction, have it trading above its "max buy" level.
>>> The latest Featured Stock Update with an annotated graph appeared on 9/20/2010. Click here.
View all notes |
Alert me of new notes |
CANSLIM.net Company Profile |
SEC |
Zacks Reports |
StockTalk |
News |
Chart |
Request a new note
C
A N
S L
I M
|
PAY
-
NYSE
Verifone Systems Inc
COMPUTER HARDWARE - Transaction Automation Systems
|
$29.06
|
-0.04
-0.14% |
$29.33
|
651,898
45.06% of 50 DAV
50 DAV is 1,446,700
|
$31.40
-7.45%
|
8/25/2010
|
$24.30
|
PP = $23.74
|
|
MB = $24.93
|
Most Recent Note - 10/12/2010 5:07:06 PM
G - Closed near the session high today with a 4th consecutive gain on light volume. Consolidating above support at its 50 DMA line (now $25.78) after recent distributional pressure.
>>> The latest Featured Stock Update with an annotated graph appeared on 8/30/2010. Click here.
View all notes |
Alert me of new notes |
CANSLIM.net Company Profile |
SEC |
Zacks Reports |
StockTalk |
News |
Chart |
Request a new note
C
A N
S L
I M
|
Symbol/Exchange
Company Name
Industry Group |
PRICE |
CHANGE
(%Change) |
Day High |
Volume
(% DAV)
(% 50 day avg vol) |
52 Wk Hi
% From Hi |
Featured
Date |
Price
Featured |
Pivot Featured |
|
Max Buy |
PRGO
-
NASDAQ
Perrigo Co
DRUGS - Drug Related Products
|
$65.66
|
-0.90
-1.35% |
$66.19
|
660,927
71.06% of 50 DAV
50 DAV is 930,100
|
$67.94
-3.36%
|
9/15/2010
|
$63.73
|
PP = $64.76
|
|
MB = $68.00
|
Most Recent Note - 10/12/2010 5:17:54 PM
Y - Gain today with light volume led to its best ever close by just a few cents. Its action has been healthy and volume totals have cooled in recent weeks while it has consolidated in a tight range between its pivot point and "max buy" levels
>>> The latest Featured Stock Update with an annotated graph appeared on 9/15/2010. Click here.
View all notes |
Alert me of new notes |
CANSLIM.net Company Profile |
SEC |
Zacks Reports |
StockTalk |
News |
Chart |
Request a new note
C
A N
S L
I M
|
RAX
-
NYSE
Rackspace Hosting Inc
INTERNET - Internet Software and; Services
|
$23.80
|
-0.74
-3.02% |
$24.73
|
2,443,997
100.47% of 50 DAV
50 DAV is 2,432,600
|
$26.50
-10.19%
|
9/21/2010
|
$22.84
|
PP = $23.61
|
|
MB = $24.79
|
Most Recent Note - 10/14/2010 2:14:48 PM
Y - Pulling back today, trading near recent low closes. Color code was changed to yellow while rebounding following its damaging gap down on 10/06/10. Recent lows in the $22.40 area define chart support above its 50 DMA line.
>>> The latest Featured Stock Update with an annotated graph appeared on 9/21/2010. Click here.
View all notes |
Alert me of new notes |
CANSLIM.net Company Profile |
SEC |
Zacks Reports |
StockTalk |
News |
Chart |
Request a new note
C
A N
S L
I M
|
ROVI
-
NASDAQ
Rovi Corp
COMPUTER SOFTWARE andamp; SERVICES - Security Software andamp; Services
|
$49.23
|
-0.62
-1.24% |
$50.26
|
991,230
65.25% of 50 DAV
50 DAV is 1,519,200
|
$53.00
-7.11%
|
8/31/2010
|
$43.31
|
PP = $45.06
|
|
MB = $47.31
|
Most Recent Note - 10/12/2010 5:35:40 PM
G - Volume totals have been cooling recently while consolidating in a healthy fashion well above support at prior highs and its 50 DMA line coinciding in the $45 area.
>>> The latest Featured Stock Update with an annotated graph appeared on 8/24/2010. Click here.
View all notes |
Alert me of new notes |
CANSLIM.net Company Profile |
SEC |
Zacks Reports |
StockTalk |
News |
Chart |
Request a new note
C
A N
S L
I M
|
SHOO
-
NASDAQ
Steven Madden Limited
CONSUMER NON-DURABLES - Textile - Apparel Footwear
|
$43.54
|
-0.24
-0.55% |
$43.92
|
206,196
50.90% of 50 DAV
50 DAV is 405,100
|
$44.85
-2.92%
|
9/15/2010
|
$38.94
|
PP = $40.27
|
|
MB = $42.28
|
Most Recent Note - 10/8/2010 3:58:00 PM
G - Hit yet another new 52-week high with today's gain on light volume. Prior highs in the $40 area define chart support to watch now. Color code was changed to green after getting extended more than +5% above its prior highs.
>>> The latest Featured Stock Update with an annotated graph appeared on 9/29/2010. Click here.
View all notes |
Alert me of new notes |
CANSLIM.net Company Profile |
SEC |
Zacks Reports |
StockTalk |
News |
Chart |
Request a new note
C
A N
S L
I M
|
SLW
-
NYSE
Silver Wheaton Corp
METALS and; MINING - Silver
|
$27.84
|
+0.36
1.31% |
$28.39
|
7,967,855
135.45% of 50 DAV
50 DAV is 5,882,300
|
$27.71
0.47%
|
8/25/2010
|
$21.40
|
PP = $21.99
|
|
MB = $23.09
|
Most Recent Note - 10/14/2010 1:19:14 PM
G - Hit another new all-time high today, quietly wedging higher after a short consolidation. Its 50 DMA line defines chart support to watch.
>>> The latest Featured Stock Update with an annotated graph appeared on 8/25/2010. Click here.
View all notes |
Alert me of new notes |
CANSLIM.net Company Profile |
SEC |
Zacks Reports |
StockTalk |
News |
Chart |
Request a new note
C
A N
S L
I M
|
Symbol/Exchange
Company Name
Industry Group |
PRICE |
CHANGE
(%Change) |
Day High |
Volume
(% DAV)
(% 50 day avg vol) |
52 Wk Hi
% From Hi |
Featured
Date |
Price
Featured |
Pivot Featured |
|
Max Buy |
SVR
-
NYSE
Syniverse Holdings Inc
TELECOMMUNICATIONS - Diversified Communication Serv
|
$23.72
|
+0.11
0.47% |
$23.88
|
852,384
114.88% of 50 DAV
50 DAV is 742,000
|
$24.24
-2.15%
|
9/22/2010
|
$23.60
|
PP = $23.87
|
|
MB = $25.06
|
Most Recent Note - 10/13/2010 11:21:26 AM
Y - Color code is changed to yellow after recovering with recent light volume gains since finding prompt support near its 50 DMA line. Confirming gains for a new high close with heavy volume would be a bullish sign, meanwhile the recent chart low ($21.47) defines important support to watch.
>>> The latest Featured Stock Update with an annotated graph appeared on 9/22/2010. Click here.
View all notes |
Alert me of new notes |
CANSLIM.net Company Profile |
SEC |
Zacks Reports |
StockTalk |
News |
Chart |
Request a new note
C
A N
S L
I M
|
UA
-
NYSE
Under Armour Inc Cl A
CONSUMER NON-DURABLES - Textile - Apparel Clothing
|
$46.28
|
-0.51
-1.09% |
$47.50
|
580,575
80.65% of 50 DAV
50 DAV is 719,900
|
$48.00
-3.58%
|
9/9/2010
|
$39.99
|
PP = $40.10
|
|
MB = $42.11
|
Most Recent Note - 10/13/2010 11:45:22 AM
G - Gapped up today and hit a 52-week high. Company is due to report earnings on Oct 26th.
>>> The latest Featured Stock Update with an annotated graph appeared on 9/9/2010. Click here.
View all notes |
Alert me of new notes |
CANSLIM.net Company Profile |
SEC |
Zacks Reports |
StockTalk |
News |
Chart |
Request a new note
C
A N
S L
I M
|
UFPT
-
NASDAQ
U F P Tech Inc
CONSUMER NON-DURABLES - Packaging and Containers
|
$12.81
|
-0.04
-0.31% |
$12.81
|
59,830
99.72% of 50 DAV
50 DAV is 60,000
|
$13.28
-3.54%
|
9/16/2010
|
$11.20
|
PP = $11.69
|
|
MB = $12.27
|
Most Recent Note - 10/13/2010 1:21:04 PM
G - Hit a new 52-week high today after a small gap up. Prior highs in the $11 area define chart support to watch.
>>> The latest Featured Stock Update with an annotated graph appeared on 9/17/2010. Click here.
View all notes |
Alert me of new notes |
CANSLIM.net Company Profile |
SEC |
Zacks Reports |
StockTalk |
News |
Chart |
Request a new note
C
A N
S L
I M
|
ULTA
-
NASDAQ
Ulta Salon Cosm & Frag
SPECIALTY RETAIL - Specialty Retail, Other
|
$30.42
|
-0.46
-1.49% |
$30.51
|
697,408
107.61% of 50 DAV
50 DAV is 648,100
|
$31.56
-3.61%
|
9/3/2010
|
$26.36
|
PP = $25.89
|
|
MB = $27.18
|
Most Recent Note - 10/14/2010 2:18:08 PM
G - Consolidating on cooler volume after its considerable 10/12/10 gain with above average volume for a new 52-week high. Prior highs and its 50 DMA line coincide in the $26 area defining support to watch. No overhead supply remains to act as resistance.
>>> The latest Featured Stock Update with an annotated graph appeared on 9/3/2010. Click here.
View all notes |
Alert me of new notes |
CANSLIM.net Company Profile |
SEC |
Zacks Reports |
StockTalk |
News |
Chart |
Request a new note
C
A N
S L
I M
|
VIT
-
NYSE
Vanceinfo Tech Inc Ads
COMPUTER SOFTWARE and SERVICES - Business Software and Services
|
$33.79
|
-0.10
-0.30% |
$34.39
|
340,577
51.94% of 50 DAV
50 DAV is 655,700
|
$34.40
-1.77%
|
7/8/2010
|
$25.20
|
PP = $26.58
|
|
MB = $27.91
|
Most Recent Note - 10/13/2010 2:09:43 PM
G - Gapped up today for a new all-time high while, without great volume conviction, its 4th consecutive gain helps it rise from a short consolidation. Its 50 DMA line defines chart support to watch.
>>> The latest Featured Stock Update with an annotated graph appeared on 8/31/2010. Click here.
View all notes |
Alert me of new notes |
CANSLIM.net Company Profile |
SEC |
Zacks Reports |
StockTalk |
News |
Chart |
Request a new note
C
A N
S L
I M
|
Symbol/Exchange
Company Name
Industry Group |
PRICE |
CHANGE
(%Change) |
Day High |
Volume
(% DAV)
(% 50 day avg vol) |
52 Wk Hi
% From Hi |
Featured
Date |
Price
Featured |
Pivot Featured |
|
Max Buy |
WCRX
-
NASDAQ
Warner Chilcott Plc
DRUGS - Drug Manufacturers - Other
|
$24.56
|
-0.44
-1.76% |
$25.27
|
2,618,287
90.61% of 50 DAV
50 DAV is 2,889,700
|
$25.32
-3.00%
|
8/23/2010
|
$21.04
|
PP = $20.84
|
|
MB = $21.88
|
Most Recent Note - 10/12/2010 5:03:47 PM
G - Hit another new high today, and its color code is changed to green after rallying more than +5% above recent chart highs. Gapped up on 10/11/10 for a new high following a consolidation near its 10-week moving average line.
>>> The latest Featured Stock Update with an annotated graph appeared on 8/23/2010. Click here.
View all notes |
Alert me of new notes |
CANSLIM.net Company Profile |
SEC |
Zacks Reports |
StockTalk |
News |
Chart |
Request a new note
C
A N
S L
I M
|