You are not logged in.
This means you
CAN ONLY VIEW reports that were published prior to Monday, April 14, 2025.
You
MUST UPGRADE YOUR MEMBERSHIP if you want to see any current reports.
AFTER MARKET UPDATE - WEDNESDAY, OCTOBER 14TH, 2009
Previous After Market Report Next After Market Report >>>
|
|
|
|
DOW |
+144.80 |
10,015.86 |
+1.47% |
|
Volume |
1,350,948,270 |
+18% |
|
Volume |
2,417,095,280 |
+15% |
|
NASDAQ |
+32.34 |
2,172.23 |
+1.51% |
|
Advancers |
2,272 |
73% |
|
Advancers |
2,052 |
72% |
|
S&P 500 |
+18.83 |
1,092.02 |
+1.75% |
|
Decliners |
766 |
25% |
|
Decliners |
701 |
25% |
|
Russell 2000 |
+12.24 |
623.94 |
+2.00% |
|
52 Wk Highs |
461 |
|
|
52 Wk Highs |
236 |
|
|
S&P 600 |
+6.24 |
328.81 |
+1.93% |
|
52 Wk Lows |
2 |
|
|
52 Wk Lows |
6 |
|
|
 |
Major Averages Charge To New 2009 Highs; Breadth Positive As Volume Increased
Adam Sarhan, Contributing Writer,
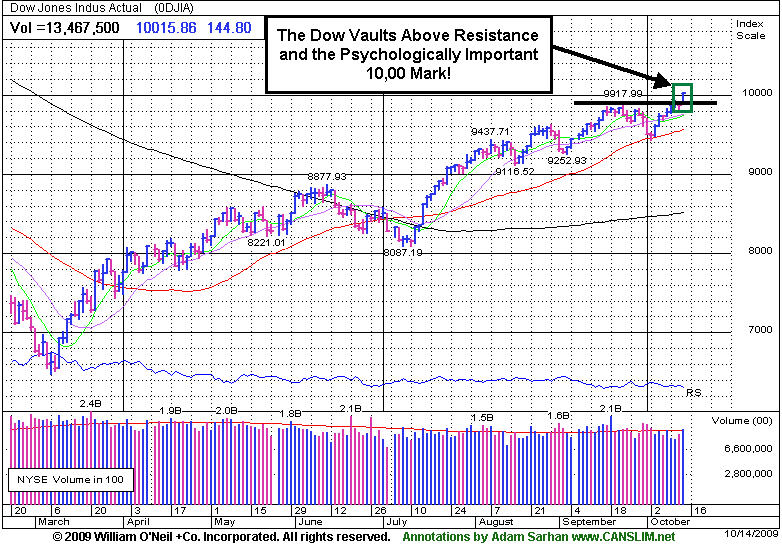
The major averages collectively charged to new 2009 highs which sent the Dow Jones Industrial Average above the psychologically important 10,000 level for the first time since October 2008. It was very encouraging to see volume expand versus the prior session as the major averages hit fresh 2009 highs. The higher volume behind the gains is a powerful sign of institutional accumulation, meaning that mutual funds and other large and very influential investors were more avidly buying stocks. Advancers trumped decliners by about a 3-to-1 ratio on the NYSE and on the Nasdaq exchange. There were 74 high-ranked companies (39% of the total) from the CANSLIM.net Leaders List, which currently includes 189 stocks, making a new 52-week high and appearing on the CANSLIM.net BreakOuts Page. That was sharply higher from the 20 issues that appeared on the prior session. New 52-week highs substantially outnumbered new 52-week lows on both major exchanges, and new lows were again in the single digits.
The market was propelled higher after JPMorgan Chase & Co (JPM +3.29%) and Intel Corp (INTC +1.66%) reported stronger-than-expected Q3 earnings data. JPMorgan jumped to a fresh 2009 on heavy volume after the company reported a surprisingly strong third quarter. Earnings surged +173% to $0.82 per share, up from $0.30 from the same period last year. Meanwhile, sales rose +31% as the company enjoyed healthy gains from fixed-income revenue. Intel, the world’s largest chip manufacturer, also hit a fresh 2009 high after topping the Street's views by as much as $1 billion. Neither of the above mentioned well-known blue chips has the solid earnings track record or high ranks necessary to make it onto the Leaders List. However, the strength in JPM and other financial shares bodes well (see more in the Industry Group Watch section).
In other bullish news, while the US dollar continued to fall, retail stocks caught a bid after the government reported that retail sales fell less than economists expected last month. The series of stronger than expected results and healthier economic data supported the thesis that the global economy will recover from its largest decline since World War II. A flurry of stocks began breaking out of sound bases which also helps the market's (the M criteria) latest rally.
PICTURED: The Dow Jones Industrial Average vaulted above resistance and closed above 10,000 as it charged higher with gains on heavier volume!
|
|
|
 |
Financial Group Spearheads Ongoing Market Rally
Kenneth J. Gruneisen - Passed the CAN SLIM® Master's Exam
Financial shares were among the key players spearheading Wednesday's rally as the Bank Index ($BKX +3.19%) and Broker/Dealer Index ($XBD +3.33%) rallied to new 2009 highs and underpinned the major averages' unanimous gains. The tech sector was led higher by the Networking Index ($NWX +2.22%) and Biotechnology Index ($BTK +2.18%), followed by smaller gains from the Internet Index ($IIX +1.28%) and Semiconductor Index ($SOX +1.37%). The Retail Index ($RLX +1.70%) and Healthcare Index ($HMO +1.77%) posted solid gains. Energy-related shares also rose, boosting the Oil Services Index ($OSX +2.29%) and Integrated Oil Index ($XOI +1.89%). Meanwhile, the popular defensive "safe haven" group, the Gold & Silver Index ($XAU -0.02%), was an obvious laggard, failing to participate in the otherwise widely positive session.
Charts courtesy www.stockcharts.com
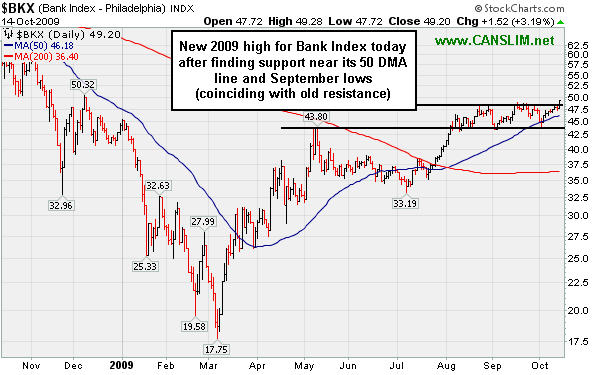
PICTURED: The Bank Index ($BKX +3.19%) rallied to a new 2009 high after recently finding support near its 50-day moving average (DMA) line and September lows (coinciding with old chart resistance). The bullish action in financial shares adds importance now to the old adage "don't fight the tape." Longtime CANSLIM.net members have seen an ongoing theme emphasized concerning the importance of the financial group as a leading indicator for the overall market outlook.
| Oil Services |
$OSX |
204.92 |
+4.58 |
+2.29% |
+68.81% |
| Healthcare |
$HMO |
1,177.20 |
+20.42 |
+1.77% |
+22.60% |
| Integrated Oil |
$XOI |
1,087.20 |
+20.13 |
+1.89% |
+10.98% |
| Semiconductor |
$SOX |
334.51 |
+4.51 |
+1.37% |
+57.66% |
| Networking |
$NWX |
243.40 |
+5.28 |
+2.22% |
+69.16% |
| Internet |
$IIX |
223.86 |
+2.84 |
+1.28% |
+67.35% |
| Broker/Dealer |
$XBD |
126.29 |
+4.07 |
+3.33% |
+63.02% |
| Retail |
$RLX |
397.89 |
+6.66 |
+1.70% |
+42.48% |
| Gold & Silver |
$XAU |
179.24 |
-0.03 |
-0.02% |
+44.72% |
| Bank |
$BKX |
49.20 |
+1.52 |
+3.19% |
+11.01% |
| Biotech |
$BTK |
924.77 |
+19.71 |
+2.18% |
+42.89% |
|
|
|
 |
Chinese IT Firm Finally Broke Out With 5 Times Average Volume
Kenneth J. Gruneisen - Passed the CAN SLIM® Master's Exam
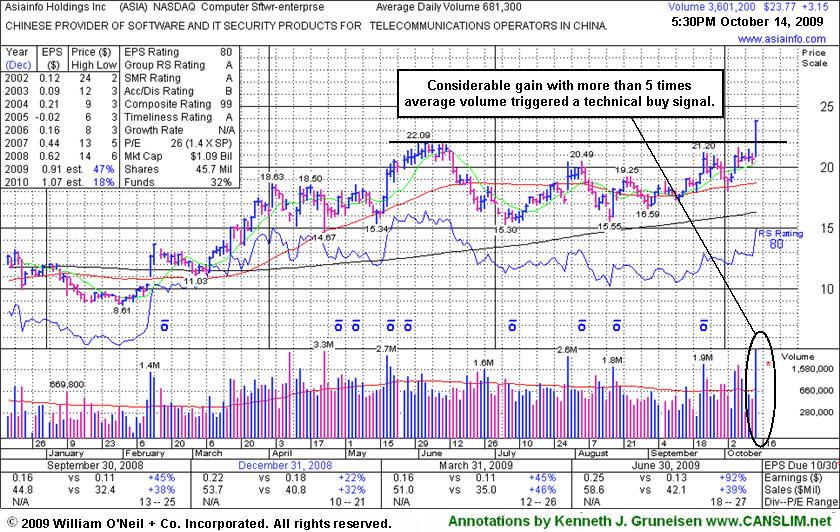
AsiaInfo Holdings, Inc. (ASIA +$3.15 or +13.25% to $23.77) showed up earlier today in yellow in the mid-day report (read here) as it blasted to a new 52-week high (the N criteria). It closed with a considerable gain backed by 5 times average volume, triggering a technical buy signal. Strong sales and earnings growth is indicative of great demand for the goods and services offered by this Chinese provider of software and IT security products.
Concerning the L criteria, now 7 of the 12 current Featured Stocks hail from Computer-Software or Internet industry groups. Its Relative Strength rank has improved to above the minimum 80+ guideline for buyable candidates and it has proven resilient since its last appearance in this FSU section under the headline "Weak Action Never Offered Proper Buy Signal" on 8/17/09. Based on its inability to make progress above its pivot point back then, we observed that "disciplined investors avoided taking action that would have exposed them to any losses." Disciplined entries and exits are critical to investors' success with the investment system. ASIA was featured in the August 2009 CANSLIM.net News (read here). At the time it was dropped from the Featured Stocks list we suggested that, "Technically, it would have to rally above its 50 DMA and rally above recent chart highs in the $20 area for its outlook to improve." Bullish action in recent weeks helped it do just that, and its outlook now is very favorable. Pullbacks near prior chart highs in the $21-22 area might offer patient investors another chance to accumulate shares without chasing it more than +5% above its pivot point.
|
|
|
Color Codes Explained :
Y - Better candidates highlighted by our
staff of experts.
G - Previously featured
in past reports as yellow but may no longer be buyable under the
guidelines.
***Last / Change / Volume quote data in this table corresponds with the timestamp on the note***
Symbol/Exchange
Company Name
Industry Group |
Last |
Chg. |
Vol
% DAV |
Date Featured |
Price Featured |
Latest Pivot Point
Featured |
Status |
| Latest Max Buy Price |
ARO
- NYSE
Aeropostale Inc
RETAIL - Apparel Stores
|
$42.10
|
+0.45
|
2,479,364
92% DAV
2,707,400
|
8/21/2009
(Date
Featured) |
$39.21
(Price
Featured) |
PP = $38.84 |
Y |
| MB = $40.78 |
Most Recent Note - 10/14/2009 6:26:22 PM
Y - Consolidating just above important suport at its 50 DMA line. Last week it actually posted a weekly gain, despite encountering distributional pressure. This high-ranked leader in the Retail - Clothing/shoe group is still trading only -6% from its all-time highs. Color code was changed to yellow, with it permissible under the guidelines to accumulate shares from the first successful test of support at its short-term average line up to as much as 5% above its latest chart highs. A 50 DMA line violation could raise concerns and trigger a technical sell signal. The next key chart support level is prior highs in the $38 area. It was featured in yellow in the 8/21/09 Mid-Day BreakOuts Report (read here).
>>> The latest Featured Stock Update with an annotated graph appeared on 10/6/2009. click here.
|
|
C
A
S
I |
News |
Chart |
SEC
View all notes Alert
me of new notes
Company
Profile
|
ARST
-
|
$25.12
|
+1.54
|
1,454,070
229% DAV
635,800
|
9/1/2009
(Date
Featured) |
$19.91
(Price
Featured) |
PP = $20.90 |
G |
| MB = $21.95 |
Most Recent Note - 10/14/2009 6:28:27 PM
G - Gapped up again today and hit a new all-time high with a considerable gain backed by more than 2 times average volume. It is rallying from a tight trading range resembling a "base-on-base" pattern. ARST was first featured in yellow at $19.91 in the 9/01/09 mid-day report with an annotated daily graph (read here). As previously noted, "Recent lows may be considered an initial support level. Prior chart highs and its 50 DMA line, coinciding in the $20 area, define an important technical support level to watch on pullbacks."
>>> The latest Featured Stock Update with an annotated graph appeared on 10/2/2009. click here.
|
|
C
A
S
I |
News |
Chart |
SEC
View all notes Alert
me of new notes
Company
Profile
|
ASIA
-
|
$23.77
|
+3.15
|
3,610,451
526% DAV
685,900
|
10/14/2009
(Date
Featured) |
$23.05
(Price
Featured) |
PP = $22.19 |
Y |
| MB = $23.30 |
Most Recent Note - 10/14/2009 6:30:41 PM
Y - Gapped up today and it was highlighted in yellow in the mid-day report (read here) as it blasted to a new 52-week high above its long-ago noted pivot point. It has shown bullish action since last noted on 8/17/09 that it "would need to rally above its recent highs in the $20 area for its outlook to improve." Recently featured in the August 2009 CANSLIM.net News (read here).
>>> The latest Featured Stock Update with an annotated graph appeared on 10/14/2009. click here.
|
|
C
A
S
I |
News |
Chart |
SEC
View all notes Alert
me of new notes
Company
Profile
|
BIDU
- NASDAQ
Baidu Inc Ads
INTERNET - Internet Information Providers
|
$410.18
|
+2.68
|
1,823,079
105% DAV
1,743,900
|
9/8/2009
(Date
Featured) |
$351.80
(Price
Featured) |
PP = $368.59 |
G |
| MB = $387.02 |
Most Recent Note - 10/14/2009 6:31:38 PM
G - Consolidating above prior chart highs in the $400 area now after gains with well above average volume last week lifted it to new 2009 highs and challenged its 2007 all-time high of $429. BIDU was featured in yellow in the 9/08/09 Mid-Day BreakOuts Report (read here).
>>> The latest Featured Stock Update with an annotated graph appeared on 10/7/2009. click here.
|
|
C
A
S
I |
News |
Chart |
SEC
View all notes Alert
me of new notes
Company
Profile
|
CACC
- NASDAQ
Credit Acceptance Corp
FINANCIAL SERVICES - Credit Services
|
$36.31
|
+0.47
|
34,215
76% DAV
45,000
|
9/29/2009
(Date
Featured) |
$33.48
(Price
Featured) |
PP = $32.60 |
G |
| MB = $34.23 |
Most Recent Note - 10/14/2009 6:33:07 PM
G - Ended near its session high today as it posted an 8th consecutive gain for another new high close above its "max buy" level. Color code was changed to green as it got extended from its prior base. The Finance - Consumer/Commercial Loans firm has maintained a great track record of annual and quarterly sales revenues and earnings increases. It was featured on 9/29/09 in yellow in the mid-day report (read here).
>>> The latest Featured Stock Update with an annotated graph appeared on 9/29/2009. click here.
|
|
C
A
S
I |
News |
Chart |
SEC
View all notes Alert
me of new notes
Company
Profile
|
CRM
- NYSE
Salesforce.com Inc
INTERNET - Internet Software & Services
|
$62.49
|
+1.36
|
1,447,174
68% DAV
2,118,400
|
8/16/2009
(Date
Featured) |
$47.12
(Price
Featured) |
PP = $45.59 |
G |
| MB = $47.87 |
Most Recent Note - 10/14/2009 6:34:02 PM
G - Gain on light volume today for another new 2009 high. Its latest pullback tested support at prior highs in the $55 area. It is extended from any sound base. Technical support to watch now is an upward trendline connecting its July, August and October chart lows, a line which comes into play above additional support at its 50 DMA line.
>>> The latest Featured Stock Update with an annotated graph appeared on 10/5/2009. click here.
|
|
C
A
S
I |
News |
Chart |
SEC
View all notes Alert
me of new notes
Company
Profile
|
EBIX
- NASDAQ
Ebix Inc
COMPUTER SOFTWARE & SERVICES - Business Software & Services
|
$60.47
|
-0.33
|
231,873
121% DAV
192,200
|
8/28/2009
(Date
Featured) |
$45.86
(Price
Featured) |
PP = $45.35 |
G |
| MB = $47.62 |
Most Recent Note - 10/14/2009 6:34:56 PM
G - Still perched at all-time highs after its considerable gap up gain on 10/12/09 with heavy volume. Very extended from any sound base and well above support at its 50 DMA line, and more than +84% above its 200 DMA line, which are reminders to be watchful for sell signals.
>>> The latest Featured Stock Update with an annotated graph appeared on 10/13/2009. click here.
|
|
C
A
S
I |
News |
Chart |
SEC
View all notes Alert
me of new notes
Company
Profile
|
GMCR
- NASDAQ
Green Mtn Coffee Roastrs
FOOD & BEVERAGE - Processed & Packaged Goods
|
$72.66
|
+0.89
|
1,526,305
114% DAV
1,340,900
|
10/5/2009
(Date
Featured) |
$71.11
(Price
Featured) |
PP = $75.89 |
Y |
| MB = $79.68 |
Most Recent Note - 10/14/2009 6:36:53 PM
Y - Gain on slightly above average volume today was its best showing since its big gain on 9/28/09 with heavy volume. Its 9/29/09 high, before a negative reversal, is the basis for the latest pivot point noted as a "cup-with-high-handle pattern" since 10/05/09. Earlier notes discussed minor flaws in its base which resembled a cup-with-handle. Disciplined investors will watch for volume-driven gains to trigger a new technical buy signal before making any initial buys or add-on purchases.
>>> The latest Featured Stock Update with an annotated graph appeared on 10/12/2009. click here.
|
|
C
A
S
I |
News |
Chart |
SEC
View all notes Alert
me of new notes
Company
Profile
|
NVEC
- NASDAQ
N V E Corp
ELECTRONICS - Semiconductor - Specialized
|
$51.61
|
+1.41
|
100,349
122% DAV
82,200
|
8/26/2009
(Date
Featured) |
$55.32
(Price
Featured) |
PP = $57.60 |
G |
| MB = $60.48 |
Most Recent Note - 10/14/2009 6:37:50 PM
G - Gain today on better volume followed its lowest close since July 22nd. Concerns increase the longer it struggles below its 50 DMA line. That short-term average is now downward sloping and has acted as a resistance level while it has been consolidating. Prior chart lows in the $49 area are an important support level now, and further deterioration may completely negate its 7/23/09 breakaway gap and raise more serious concerns (especially if on heavy volume) and trigger worrisome technical sell signals.
>>> The latest Featured Stock Update with an annotated graph appeared on 9/30/2009. click here.
|
|
C
A
S
I |
News |
Chart |
SEC
View all notes Alert
me of new notes
Company
Profile
|
PEGA
- NASDAQ
Pegasystems Inc
COMPUTER SOFTWARE & SERVICES - Business Software & Services
|
$34.65
|
+0.13
|
133,417
36% DAV
375,200
|
9/9/2009
(Date
Featured) |
$31.14
(Price
Featured) |
PP = $33.35 |
Y |
| MB = $35.02 |
Most Recent Note - 10/14/2009 6:40:41 PM
Y - This high-ranked Computer Software - Financial firm's small gain on light volume today leaves it perched less than -3% from its all-time high. Important support to watch now is its 50 DMA line, where a violation would trigger a technical sell signal.
>>> The latest Featured Stock Update with an annotated graph appeared on 10/8/2009. click here.
|
|
C
A
S
I |
News |
Chart |
SEC
View all notes Alert
me of new notes
Company
Profile
|
SWI
- NYSE
Solarwinds Inc
COMPUTER SOFTWARE & SERVICES - Application Software
|
$22.95
|
-0.03
|
518,509
108% DAV
479,400
|
9/30/2029
(Date
Featured) |
$22.03
(Price
Featured) |
PP = $21.72 |
G |
| MB = $22.81 |
Most Recent Note - 10/14/2009 6:43:21 PM
G - Negatively reversed today after gapping up and having a chance at a new high close, but it closed near the session low after failing to attract strong buying demand. It has quietly rallied up from important support at its 50 DMA line after briefly and quietly consolidating under its last pivot point. It was featured in the October 2009 issue of CANSLIM.net News (read here).
>>> The latest Featured Stock Update with an annotated graph appeared on 9/30/2009. click here.
|
|
C
A
S
I |
News |
Chart |
SEC
View all notes Alert
me of new notes
Company
Profile
|
WNS
- NYSE
W N S Holdings Ltd Ads
DIVERSIFIED SERVICES - Business/Management Services
|
$15.30
|
+0.29
|
49,535
87% DAV
56,700
|
9/28/2009
(Date
Featured) |
$15.28
(Price
Featured) |
PP = $16.10 |
Y |
| MB = $16.91 |
Most Recent Note - 10/14/2009 6:45:33 PM
Y - Small gain today on average volume, finding support thus far right at its 50 DMA line. Color code is changed to yellow again, yet it technically needs to rally for a new high close above $16 for its outlook to meaningfully improve. It has encountered stubborn resistance since featured in yellow in the 9/28/09 mid-day report (read here). Quarterly earnings have been above the +25% guideline and its annual earnings history has been great, satisfying the C & A criteria. However, sales revenues growth has decelerated.
>>> The latest Featured Stock Update with an annotated graph appeared on 9/28/2009. click here.
|
|
C
A
S
I |
News |
Chart |
SEC
View all notes Alert
me of new notes
Company
Profile
|
|
|
|
THESE ARE NOT BUY RECOMMENDATIONS!
Comments contained in the body of this report are technical
opinions only. The material herein has been obtained
from sources believed to be reliable and accurate, however,
its accuracy and completeness cannot be guaranteed.
This site is not an investment advisor, hence it does
not endorse or recommend any securities or other investments.
Any recommendation contained in this report may not
be suitable for all investors and it is not to be deemed
an offer or solicitation on our part with respect to
the purchase or sale of any securities. All trademarks,
service marks and trade names appearing in this report
are the property of their respective owners, and are
likewise used for identification purposes only.
This report is a service available
only to active Paid Premium Members.
You may opt-out of receiving report notifications
at any time. Questions or comments may be submitted
by writing to Premium Membership Services 665 S.E. 10 Street, Suite 201 Deerfield Beach, FL 33441-5634 or by calling 1-800-965-8307
or 954-785-1121.
|
|
|


