You are not logged in.
This means you
CAN ONLY VIEW reports that were published prior to Monday, April 14, 2025.
You
MUST UPGRADE YOUR MEMBERSHIP if you want to see any current reports.
AFTER MARKET UPDATE - TUESDAY, OCTOBER 13TH, 2009
Previous After Market Report Next After Market Report >>>
|
|
|
|
DOW |
-14.74 |
9,871.06 |
-0.15% |
|
Volume |
1,143,413,480 |
+21% |
|
Volume |
2,109,361,290 |
+17% |
|
NASDAQ |
+0.75 |
2,139.89 |
+0.04% |
|
Advancers |
1,292 |
42% |
|
Advancers |
1,214 |
43% |
|
S&P 500 |
-3.00 |
1,073.19 |
-0.28% |
|
Decliners |
1,711 |
55% |
|
Decliners |
1,475 |
52% |
|
Russell 2000 |
-2.11 |
611.70 |
-0.34% |
|
52 Wk Highs |
156 |
|
|
52 Wk Highs |
94 |
|
|
S&P 600 |
-1.16 |
322.57 |
-0.36% |
|
52 Wk Lows |
5 |
|
|
52 Wk Lows |
11 |
|
|
 |
Financial Shares Face Greater Skepticism, Weighing On Major Averages
Adam Sarhan, Contributing Writer,
The major averages ended mixed on Tuesday causing the S&P 500 Index to snap a 6-day winning streak. Volume expanded versus the prior session, however the benchmark index's loss was so slight that it barely amounted to a distribution day of any concern. Decliners led advancers by about a 4-to-3 ratio ratio on the NYSE and on the Nasdaq exchange. There were 20 high-ranked companies from the CANSLIM.net Leaders List that made a new 52-week high and appeared on the CANSLIM.net BreakOuts Page, sharply lower from the 71 issues that appeared on the prior session. New 52-week highs still substantially outnumbered new 52-week lows on both major exchanges.

The bears showed up but failed to make any significant headway on Tuesday after a slew of financial stocks faced selling pressure. Goldman Sachs (GS -1.54%) gapped down after Meredith Whitney downgraded the company and said she was “far less bullish” on banking shares. Whitney cut the bank to “neutral” from "buy" and said investors should sell the stock and book their profits (if applicable) considering the company has more than doubled since the March low. Whitney became famous in 2007 when she called the top of the credit and subprime markets. Goldman is slated to announce earnings on October 15th.
So far, earnings season has been lackluster at best. Analysts believe that the average company in the S&P 500 Index will report a ninth consecutive quarter of declining profits which will be the longest losing streak since the Great Depression. Wall Street believes that earnings growth will resume in the fourth quarter of this year. Remember that over the next few weeks as companies continue reporting in droves expect that data to play a pivotal role on what happens to this mature rally. Furthermore, as long as the major averages continue trading above their respective 50 DMA lines, expect this healthy rally to continue!
PICTURED: The Nasdaq Composite Index closed higher and remains perched just below resistance at recent chart highs (2,168).
|
|
|
 |
Retail Index Climbs To New 2009 High
Kenneth J. Gruneisen - Passed the CAN SLIM® Master's Exam
The Gold & Silver Index ($XAU +1.82%) posted a standout gain while the Healthcare Index ($HMO -2.30%) was one of Tuesday's worst laggards. The energy group showed mixed action as the Oil Services Index ($OSX -0.80%) lost ground and the Integrated Oil Index ($XOI +0.22%) posted a small gain. Financial shares created a drag on the major averages as the Broker/Dealer Index ($XBD -1.04%) and Bank Index ($BKX -0.44%) fell modestly. Positive action from the Retail Index ($RLX +0.88%) and Internet Index ($IIX +0.47%) was offset by losses from the Biotechnology Index ($BTK -1.14%), Semiconductor Index ($SOX -0.31%), and Networking Index ($NWX -0.13%).
Charts courtesy www.stockcharts.com
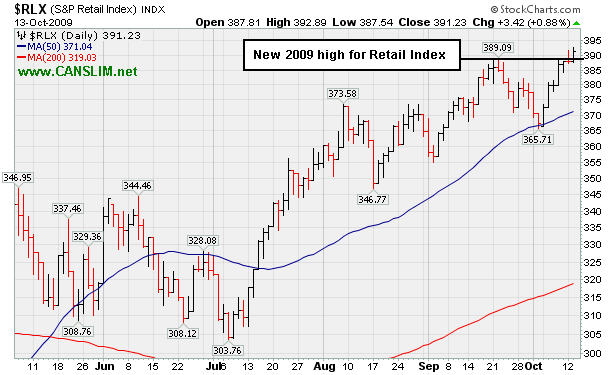
PICTURED: The Retail Index ($RLX +0.88%) rallied to a new 2009 high.
| Oil Services |
$OSX |
200.34 |
-1.61 |
-0.80% |
+65.04% |
| Healthcare |
$HMO |
1,156.78 |
-27.23 |
-2.30% |
+20.48% |
| Integrated Oil |
$XOI |
1,067.07 |
+2.30 |
+0.22% |
+8.92% |
| Semiconductor |
$SOX |
330.00 |
-1.01 |
-0.31% |
+55.54% |
| Networking |
$NWX |
238.12 |
-0.31 |
-0.13% |
+65.49% |
| Internet |
$IIX |
221.02 |
+1.04 |
+0.47% |
+65.22% |
| Broker/Dealer |
$XBD |
122.22 |
-1.29 |
-1.04% |
+57.76% |
| Retail |
$RLX |
391.23 |
+3.42 |
+0.88% |
+40.10% |
| Gold & Silver |
$XAU |
179.27 |
+3.20 |
+1.82% |
+44.75% |
| Bank |
$BKX |
47.68 |
-0.21 |
-0.44% |
+7.58% |
| Biotech |
$BTK |
905.06 |
-10.48 |
-1.14% |
+39.85% |
|
|
|
 |
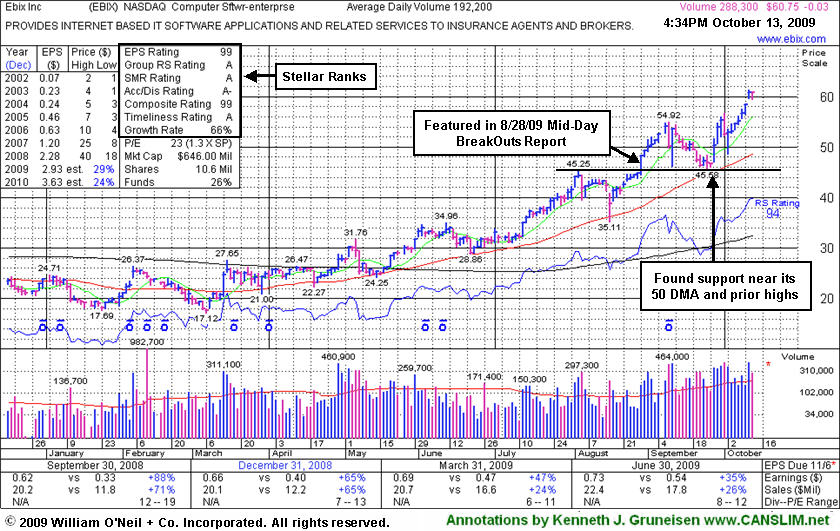
Computer Software Firm Is Extended From Latest Base
Kenneth J. Gruneisen - Passed the CAN SLIM® Master's Exam
Ebix Inc (EBIX +$0.02 or +0.03% to $60.80) held its ground today after a gap up gain on 10/12/09 for a new all-time high. It is very extended from any sound base and well above support at its 50-day moving average (DMA) line, and more than +84% above its 200 DMA line, which are reminders to be watchful for sell signals. It endured some distributional pressure in September but found support at prior chart highs and its 50 DMA line in the $45 area. EBIX has rallied as much as +33.5% since featured in yellow in the 8/28/09 CANSLIM.net Mid-Day BreakOuts Report (read here) as it was reaching a new all-time high. Prior to that, it formed the big cup-with-high-handle shaped pattern (finding great support at its 50 DMA line) since weak action prompted it to be dropped from the Featured Stocks list on 10/07/08. As shown in the annotated graph below, earnings increases in quarterly comparisons have been strong and above the +25% guideline, but previously noted earnings deceleration is of some concern. It is preferred when earnings growth is strong and accelerating, not losing steam.
EBIX had traded up more than +59% after it was first featured in the March 2008 CANSLIM.net News (read here). At that time its average daily volume was only 4,900 shares, whereas today its average volume is at 192,200 shares. Today there are 10.6 million shares (the S criteria) in the public float, so its share price still could be very volatile in the event of heavy institutional buying or selling. The number of top-rated funds owning an interest in its shares rose from 31 in Dec '08 to 58 in Jun '09, which is a good sign concerning the I criteria of the investment system. Return on Equity is now reported at +42%, well above the +17% guideline. Do not be confused by the 3:1 split that took effect on 10/09/08.
|
|
|
Color Codes Explained :
Y - Better candidates highlighted by our
staff of experts.
G - Previously featured
in past reports as yellow but may no longer be buyable under the
guidelines.
***Last / Change / Volume quote data in this table corresponds with the timestamp on the note***
Symbol/Exchange
Company Name
Industry Group |
Last |
Chg. |
Vol
% DAV |
Date Featured |
Price Featured |
Latest Pivot Point
Featured |
Status |
| Latest Max Buy Price |
ARO
- NYSE
Aeropostale Inc
RETAIL - Apparel Stores
|
$41.63
|
-0.28
|
2,596,408
96% DAV
2,707,400
|
8/21/2009
(Date
Featured) |
$39.21
(Price
Featured) |
PP = $38.84 |
Y |
| MB = $40.78 |
Most Recent Note - 10/13/2009 4:03:32 PM
Y - Down today on average volume for a 5th loss in a row. Tested its 50 DMA line last week as it actually posted a weekly gain, despite encountering distributional pressure. This high-ranked leader in the Retail - Clothing/shoe group is still trading only -7% from its all-time highs. Color code was changed to yellow, with it permissible under the guidelines to accumulate shares from the first successful test of support at its short-term average line up to as much as 5% above its latest chart highs. Important support to watch is at its 50 DMA line, where a violation would raise concerns and trigger a technical sell signal. The next key chart support level is prior highs in the $38 area. It was featured in yellow in the 8/21/09 Mid-Day BreakOuts Report (read here).
>>> The latest Featured Stock Update with an annotated graph appeared on 10/6/2009. click here.
|
|
C
A
S
I |
News |
Chart |
SEC
View all notes Alert
me of new notes
Company
Profile
|
ARST
-
|
$23.56
|
+0.57
|
965,967
152% DAV
635,800
|
9/1/2009
(Date
Featured) |
$19.91
(Price
Featured) |
PP = $20.90 |
G |
| MB = $21.95 |
Most Recent Note - 10/13/2009 4:07:00 PM
G - Traded up intra-day near the high end of its tight trading range since its powerful 9/04/09 breakout, but it closed near its session low after a gap up gain with above average volume. As previously noted, "Recent lows may be considered an initial support level. Prior chart highs and its 50 DMA line, coinciding in the $20 area, define an important technical support level to watch on pullbacks."
>>> The latest Featured Stock Update with an annotated graph appeared on 10/2/2009. click here.
|
|
C
A
S
I |
News |
Chart |
SEC
View all notes Alert
me of new notes
Company
Profile
|
BIDU
- NASDAQ
Baidu Inc Ads
INTERNET - Internet Information Providers
|
$407.50
|
-5.99
|
2,709,027
155% DAV
1,743,900
|
9/8/2009
(Date
Featured) |
$351.80
(Price
Featured) |
PP = $368.59 |
G |
| MB = $387.02 |
Most Recent Note - 10/13/2009 4:08:45 PM
G - Pulling back today toward prior chart highs in the $400 area with a second consecutive loss on above average volume. Gains with well above average volume last week lifted it to new 2009 highs and challenged its 2007 all-time high of $429. BIDU was featured in yellow in the 9/08/09 Mid-Day BreakOuts Report (read here).
>>> The latest Featured Stock Update with an annotated graph appeared on 10/7/2009. click here.
|
|
C
A
S
I |
News |
Chart |
SEC
View all notes Alert
me of new notes
Company
Profile
|
CACC
- NASDAQ
Credit Acceptance Corp
FINANCIAL SERVICES - Credit Services
|
$35.35
|
+0.05
|
24,496
54% DAV
45,000
|
9/29/2009
(Date
Featured) |
$33.48
(Price
Featured) |
PP = $32.60 |
G |
| MB = $34.23 |
Most Recent Note - 10/12/2009 4:55:47 PM
G - Ended near its session low yet posted a 7th consecutive gain today for another new high close above its "max buy" level. Color code was changed to green as it got extended from its prior base. The Finance - Consumer/Commercial Loans firm has maintained a great track record of annual and quarterly sales revenues and earnings increases. It was featured on 9/29/09 in yellow in the mid-day report (read here).
>>> The latest Featured Stock Update with an annotated graph appeared on 9/29/2009. click here.
|
|
C
A
S
I |
News |
Chart |
SEC
View all notes Alert
me of new notes
Company
Profile
|
CRM
- NYSE
Salesforce.com Inc
INTERNET - Internet Software & Services
|
$61.13
|
-0.34
|
1,090,955
51% DAV
2,118,400
|
8/16/2009
(Date
Featured) |
$47.12
(Price
Featured) |
PP = $45.59 |
G |
| MB = $47.87 |
Most Recent Note - 10/13/2009 4:15:50 PM
G - Loss on light volume today, pulling back from new 2009 high. Its latest pullback tested support at prior highs in the $55 area. It is extended from any sound base. Technical support to watch now is an upward trendline connecting its July, August and October chart lows, a line which comes into play above additional support at its 50 DMA line.
>>> The latest Featured Stock Update with an annotated graph appeared on 10/5/2009. click here.
|
|
C
A
S
I |
News |
Chart |
SEC
View all notes Alert
me of new notes
Company
Profile
|
EBIX
- NASDAQ
Ebix Inc
COMPUTER SOFTWARE & SERVICES - Business Software & Services
|
$60.80
|
+0.02
|
294,413
153% DAV
192,200
|
8/28/2009
(Date
Featured) |
$45.86
(Price
Featured) |
PP = $45.35 |
G |
| MB = $47.62 |
Most Recent Note - 10/13/2009 4:17:13 PM
G - Small loss today, yet still perched at all-time highs after its considerable gap up gain on 10/12/09 with heavy volume. Very extended from any sound base and well above support at its 50 DMA line, and more than +84 above its 200 DMA line, which are reminders to be watchful for sell signals.
>>> The latest Featured Stock Update with an annotated graph appeared on 10/13/2009. click here.
|
|
C
A
S
I |
News |
Chart |
SEC
View all notes Alert
me of new notes
Company
Profile
|
GMCR
- NASDAQ
Green Mtn Coffee Roastrs
FOOD & BEVERAGE - Processed & Packaged Goods
|
$71.77
|
-0.26
|
428,215
32% DAV
1,340,900
|
10/5/2009
(Date
Featured) |
$71.11
(Price
Featured) |
PP = $75.89 |
Y |
| MB = $79.68 |
Most Recent Note - 10/13/2009 4:18:20 PM
Y - Loss on lighter volume today. Stellar ranks, but it has clearly stalled since its big gain on 9/28/09 with heavy volume. Its 9/29/09 high, before a negative reversal, is the basis for the latest pivot point noted as a "cup-with-high-handle pattern" since 10/05/09. Earlier notes discussed minor flaws in its base which resembled a cup-with-handle. Disciplined investors will watch for volume-driven gains to trigger a new technical buy signal before making any initial buys or add-on purchases.
>>> The latest Featured Stock Update with an annotated graph appeared on 10/12/2009. click here.
|
|
C
A
S
I |
News |
Chart |
SEC
View all notes Alert
me of new notes
Company
Profile
|
NVEC
- NASDAQ
N V E Corp
ELECTRONICS - Semiconductor - Specialized
|
$50.20
|
-1.40
|
65,464
80% DAV
82,200
|
8/26/2009
(Date
Featured) |
$55.32
(Price
Featured) |
PP = $57.60 |
G |
| MB = $60.48 |
Most Recent Note - 10/13/2009 4:23:20 PM
G - Loss today on light volume marked its lowest close since July 22nd. Concerns increase the longer it struggles below its 50 DMA line. That short-term average is now downward sloping and has acted as a resistance level while it has been consolidating. Prior chart lows in the $49 area are an important support level now, and further deterioration may completely negate its 7/23/09 breakaway gap and raise more serious concerns (especially if on heavy volume) and trigger worrisome technical sell signals.
>>> The latest Featured Stock Update with an annotated graph appeared on 9/30/2009. click here.
|
|
C
A
S
I |
News |
Chart |
SEC
View all notes Alert
me of new notes
Company
Profile
|
PEGA
- NASDAQ
Pegasystems Inc
COMPUTER SOFTWARE & SERVICES - Business Software & Services
|
$34.52
|
-0.31
|
184,525
49% DAV
375,200
|
9/9/2009
(Date
Featured) |
$31.14
(Price
Featured) |
PP = $33.35 |
Y |
| MB = $35.02 |
Most Recent Note - 10/13/2009 4:26:00 PM
Y - Ended with another small loss on light volume today, yet perched near its all-time high. This high-ranked Computer Software - Financial firm gapped down on 10/02/09 and traded under its 50 DMA line, then found prompt support, however the pullback raised concerns as it violated an upward trendline connecting its July-September chart lows, an initial support level.
>>> The latest Featured Stock Update with an annotated graph appeared on 10/8/2009. click here.
|
|
C
A
S
I |
News |
Chart |
SEC
View all notes Alert
me of new notes
Company
Profile
|
SWI
- NYSE
Solarwinds Inc
COMPUTER SOFTWARE & SERVICES - Application Software
|
$22.98
|
-0.05
|
221,329
46% DAV
479,400
|
9/30/2029
(Date
Featured) |
$22.03
(Price
Featured) |
PP = $21.72 |
G |
| MB = $22.81 |
Most Recent Note - 10/13/2009 4:27:12 PM
G - Quietly held its ground today. It has quietly rallied up from important support at its 50 DMA line after briefly and quietly consolidating under its last pivot point. It was featured in the October 2009 issue of CANSLIM.net News (read here).
>>> The latest Featured Stock Update with an annotated graph appeared on 9/30/2009. click here.
|
|
C
A
S
I |
News |
Chart |
SEC
View all notes Alert
me of new notes
Company
Profile
|
WNS
- NYSE
W N S Holdings Ltd Ads
DIVERSIFIED SERVICES - Business/Management Services
|
$15.01
|
+0.09
|
18,552
33% DAV
56,700
|
9/28/2009
(Date
Featured) |
$15.28
(Price
Featured) |
PP = $16.10 |
G |
| MB = $16.91 |
Most Recent Note - 10/13/2009 4:28:26 PM
G - Small gain on light volume, hovering right at its 50 DMA line. Color code was changed to green, and it would need to rally for a new high close above $16 for its outlook to improve. It has encountered stubborn resistance since featured in yellow in the 9/28/09 mid-day report (read here). Quarterly earnings have been above the +25% guideline and its annual earnings history has been great, satisfying the C & A criteria. However, sales revenues growth has decelerated.
>>> The latest Featured Stock Update with an annotated graph appeared on 9/28/2009. click here.
|
|
C
A
S
I |
News |
Chart |
SEC
View all notes Alert
me of new notes
Company
Profile
|
|
|
|
THESE ARE NOT BUY RECOMMENDATIONS!
Comments contained in the body of this report are technical
opinions only. The material herein has been obtained
from sources believed to be reliable and accurate, however,
its accuracy and completeness cannot be guaranteed.
This site is not an investment advisor, hence it does
not endorse or recommend any securities or other investments.
Any recommendation contained in this report may not
be suitable for all investors and it is not to be deemed
an offer or solicitation on our part with respect to
the purchase or sale of any securities. All trademarks,
service marks and trade names appearing in this report
are the property of their respective owners, and are
likewise used for identification purposes only.
This report is a service available
only to active Paid Premium Members.
You may opt-out of receiving report notifications
at any time. Questions or comments may be submitted
by writing to Premium Membership Services 665 S.E. 10 Street, Suite 201 Deerfield Beach, FL 33441-5634 or by calling 1-800-965-8307
or 954-785-1121.
|
|
|


