***Last / Change / Volume data in this table is the closing quote data***
Symbol/Exchange
Company Name
Industry Group |
PRICE |
CHANGE
(%Change) |
Day High |
Volume
(% DAV)
(% 50 day avg vol) |
52 Wk Hi
% From Hi |
Featured
Date |
Price
Featured |
Pivot Featured |
|
Max Buy |
ABV
-
NYSE
Comp De Bebidas Adr
FOOD and BEVERAGE - Beverages - Brewers
|
$135.56
|
+2.19
1.64% |
$135.62
|
636,189
102.05% of 50 DAV
50 DAV is 623,400
|
$133.96
1.19%
|
6/29/2010
|
$104.74
|
PP = $109.33
|
|
MB = $114.80
|
Most Recent Note - 10/11/2010 6:51:16 PM
G - This Brazil-based beverage firm hit yet another new all-time high today with 7th consecutive gain. It is very extended from a sound base, and its 50 DMA line ($113.76 now) defines support.
>>> The latest Featured Stock Update with an annotated graph appeared on 10/11/2010. Click here.
View all notes |
Alert me of new notes |
CANSLIM.net Company Profile |
SEC |
Zacks Reports |
StockTalk |
News |
Chart |
Request a new note
C
A N
S L
I M


|
ARUN
-
NASDAQ
Aruba Networks Inc
COMPUTER HARDWARE - Networking andamp; Communication Dev
|
$21.00
|
+1.31
6.65% |
$21.13
|
2,768,100
119.30% of 50 DAV
50 DAV is 2,320,300
|
$22.80
-7.89%
|
8/30/2010
|
$18.12
|
PP = $18.51
|
|
MB = $19.44
|
 Most Recent Note - 10/12/2010 4:58:30 PM
G - Considerable gain and close near the session high, rallying up from its 50 DMA line. Its low of $18.35 on 10/07/10 also helps define important support while serving as a third point for an upward trendline connecting its May- August lows.
>>> The latest Featured Stock Update with an annotated graph appeared on 9/2/2010. Click here.
View all notes |
Alert me of new notes |
CANSLIM.net Company Profile |
SEC |
Zacks Reports |
StockTalk |
News |
Chart |
Request a new note
C
A N
S L
I M
|
BIDU
-
NASDAQ
Baidu Inc Ads
INTERNET - Internet Information Providers
|
$99.62
|
-0.12
-0.12% |
$100.22
|
9,726,103
98.16% of 50 DAV
50 DAV is 9,908,100
|
$107.19
-7.06%
|
9/17/2010
|
$85.73
|
PP = $88.42
|
|
MB = $92.84
|
Most Recent Note - 10/6/2010 12:08:48 PM
G - Perched within close striking distance of its best-ever close ($103.82), it has been repeatedly noted as "extended from any sound base" yet could go on to produce more climactic gains. A subsequent violation of its 10/04/10 low $95.12 would raise concerns, while the nearest chart support is at old highs and its 50 DMA line.
>>> The latest Featured Stock Update with an annotated graph appeared on 10/7/2010. Click here.
View all notes |
Alert me of new notes |
CANSLIM.net Company Profile |
SEC |
Zacks Reports |
StockTalk |
News |
Chart |
Request a new note
C
A N
S L
I M
|
CACC
-
NASDAQ
Credit Acceptance Corp
FINANCIAL SERVICES - Credit Services
|
$58.23
|
-0.57
-0.97% |
$58.55
|
6,724
16.44% of 50 DAV
50 DAV is 40,900
|
$63.45
-8.23%
|
7/29/2010
|
$52.04
|
PP = $54.07
|
|
MB = $56.77
|
Most Recent Note - 10/7/2010 5:09:48 PM
G - Posted a gain today and signs of support near that short-term average have been encouraging. Its 50 DMA line may act as resistance, while a convincing rebound above it would help its outlook improve. The old high ($53.97 on 2/01/10) is the next chart support level to watch.
>>> The latest Featured Stock Update with an annotated graph appeared on 9/30/2010. Click here.
View all notes |
Alert me of new notes |
CANSLIM.net Company Profile |
SEC |
Zacks Reports |
StockTalk |
News |
Chart |
Request a new note
C
A N
S L
I M
|
CMG
-
NYSE
Chipotle Mexican Grill
LEISURE - Restaurants
|
$180.91
|
+2.31
1.29% |
$181.40
|
585,840
96.64% of 50 DAV
50 DAV is 606,200
|
$180.55
0.20%
|
9/1/2010
|
$158.31
|
PP = $155.52
|
|
MB = $163.30
|
Most Recent Note - 10/12/2010 5:11:00 PM
G - Inching to new all-time highs with average volume behind recent gains. Its 50 DMA line (now $161.49) defines chart support above its prior highs in the $155 area.
>>> The latest Featured Stock Update with an annotated graph appeared on 9/1/2010. Click here.
View all notes |
Alert me of new notes |
CANSLIM.net Company Profile |
SEC |
Zacks Reports |
StockTalk |
News |
Chart |
Request a new note
C
A N
S L
I M
|
Symbol/Exchange
Company Name
Industry Group |
PRICE |
CHANGE
(%Change) |
Day High |
Volume
(% DAV)
(% 50 day avg vol) |
52 Wk Hi
% From Hi |
Featured
Date |
Price
Featured |
Pivot Featured |
|
Max Buy |
CTRP
-
NASDAQ
Ctrip.Com Intl Ltd Adr
LEISURE - Resorts and Casinos
|
$47.14
|
+0.44
0.94% |
$47.22
|
1,586,760
89.95% of 50 DAV
50 DAV is 1,764,100
|
$49.23
-4.25%
|
9/24/2010
|
$46.75
|
PP = $47.11
|
|
MB = $49.47
|
Most Recent Note - 10/11/2010 6:17:09 PM
Y - Gain today with below average volume, rising near its pivot point again. More damaging losses would raise greater concerns, as healthy stocks do not typically slump more than -7% below their pivot point after breaking out.
>>> The latest Featured Stock Update with an annotated graph appeared on 9/28/2010. Click here.
View all notes |
Alert me of new notes |
CANSLIM.net Company Profile |
SEC |
Zacks Reports |
StockTalk |
News |
Chart |
Request a new note
C
A N
S L
I M
|
EBIX
-
NASDAQ
Ebix Inc
COMPUTER SOFTWARE and SERVICES - Business Software and Services
|
$23.13
|
+0.19
0.83% |
$23.22
|
367,674
63.26% of 50 DAV
50 DAV is 581,200
|
$25.61
-9.68%
|
9/23/2010
|
$21.78
|
PP = $22.74
|
|
MB = $23.88
|
Most Recent Note - 10/8/2010 3:34:04 PM
G - Holding its ground following a negative reversal on 10/06/10, ending with a loss on heavy volume after touching a new all-time high. As previously noted -"It could go on to produce more climactic gains, but it is extended from an ideal base. Recent highs near $20 define chart support to watch."
>>> The latest Featured Stock Update with an annotated graph appeared on 9/24/2010. Click here.
View all notes |
Alert me of new notes |
CANSLIM.net Company Profile |
SEC |
Zacks Reports |
StockTalk |
News |
Chart |
Request a new note
C
A N
S L
I M
|
EGO
-
NYSE
Eldorado Gold Corp
METALS and MINING - Gold
|
$18.42
|
-0.15
-0.81% |
$18.58
|
3,201,337
68.47% of 50 DAV
50 DAV is 4,675,300
|
$20.23
-8.95%
|
8/19/2010
|
$18.25
|
PP = $19.17
|
|
MB = $20.13
|
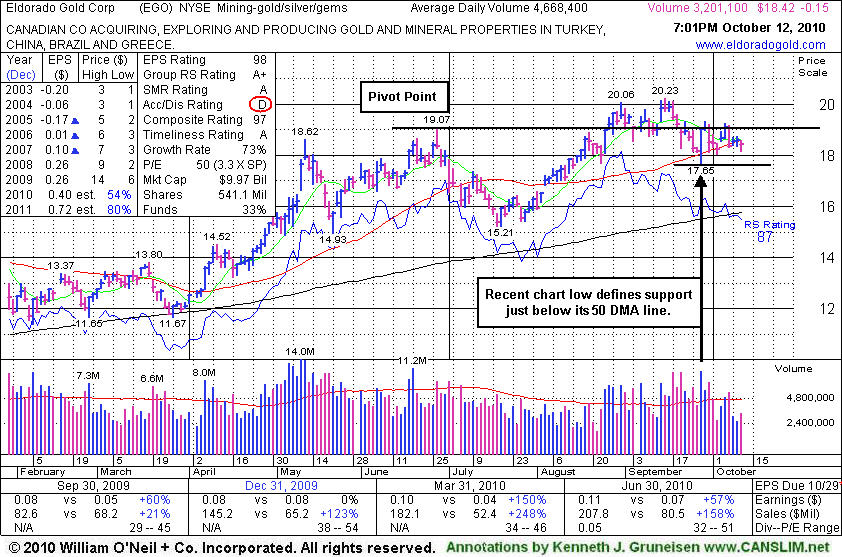
Most Recent Note - 10/12/2010 7:08:28 PM
Y - Volume totals have been cooling while consolidating near its 50 DMA line. Its recent low ($17.65) defines an important chart support level.
>>> The latest Featured Stock Update with an annotated graph appeared on 10/12/2010. Click here.
View all notes |
Alert me of new notes |
CANSLIM.net Company Profile |
SEC |
Zacks Reports |
StockTalk |
News |
Chart |
Request a new note
C
A N
S L
I M
|
FFIV
-
NASDAQ
F 5 Networks Inc
INTERNET - Internet Software and Services
|
$95.61
|
+4.43
4.86% |
$96.65
|
3,643,560
184.01% of 50 DAV
50 DAV is 1,980,100
|
$112.05
-14.67%
|
6/16/2010
|
$74.50
|
PP = $74.10
|
|
MB = $77.81
|
Most Recent Note - 10/12/2010 5:01:25 PM
G - Closed near the session high today as it rebounded above its 50 DMA line. Recent lows in the $90 area define the nearest support below that important short-term average.
>>> The latest Featured Stock Update with an annotated graph appeared on 9/13/2010. Click here.
View all notes |
Alert me of new notes |
CANSLIM.net Company Profile |
SEC |
Zacks Reports |
StockTalk |
News |
Chart |
Request a new note
C
A N
S L
I M
|
FOSL
-
NASDAQ
Fossil Inc
CONSUMER DURABLES - Recreational Goods, Other
|
$54.57
|
-0.46
-0.84% |
$55.11
|
637,325
78.76% of 50 DAV
50 DAV is 809,200
|
$55.51
-1.69%
|
8/10/2010
|
$45.54
|
PP = $42.69
|
|
MB = $44.82
|
Most Recent Note - 10/7/2010 5:12:02 PM
G - Gain today with above average volume for its best-ever close. An upward trendline defines initial support to watch after it has been repeatedly noted as "extended from any sound base."
>>> The latest Featured Stock Update with an annotated graph appeared on 10/5/2010. Click here.
View all notes |
Alert me of new notes |
CANSLIM.net Company Profile |
SEC |
Zacks Reports |
StockTalk |
News |
Chart |
Request a new note
C
A N
S L
I M
|
Symbol/Exchange
Company Name
Industry Group |
PRICE |
CHANGE
(%Change) |
Day High |
Volume
(% DAV)
(% 50 day avg vol) |
52 Wk Hi
% From Hi |
Featured
Date |
Price
Featured |
Pivot Featured |
|
Max Buy |
HMSY
-
NASDAQ
H M S Holdings Corp
COMPUTER SOFTWARE and SERVICES - Healthcare Information Service
|
$60.81
|
+0.05
0.08% |
$61.05
|
213,555
111.87% of 50 DAV
50 DAV is 190,900
|
$61.55
-1.20%
|
9/27/2010
|
$57.97
|
PP = $58.36
|
|
MB = $61.28
|
Most Recent Note - 10/8/2010 4:05:30 PM
G - Color code is changed to green after getting extended from an ideal base. Up on near average volume today for a new high, inching above its "max buy" level higher without great volume conviction behind gains since 9/27/10 when featured in yellow.
>>> The latest Featured Stock Update with an annotated graph appeared on 9/27/2010. Click here.
View all notes |
Alert me of new notes |
CANSLIM.net Company Profile |
SEC |
Zacks Reports |
StockTalk |
News |
Chart |
Request a new note
C
A N
S L
I M
|
HS
-
NYSE
Healthspring Inc
HEALTH SERVICES - Health Care Plans
|
$26.63
|
-0.05
-0.19% |
$26.82
|
641,514
89.80% of 50 DAV
50 DAV is 714,400
|
$27.10
-1.73%
|
8/27/2010
|
$19.91
|
PP = $19.75
|
|
MB = $20.74
|
Most Recent Note - 10/8/2010 4:19:55 PM
G - Gain today with light volume for its second best close ever. Support to watch is prior chart highs in the $19-20 area.
>>> The latest Featured Stock Update with an annotated graph appeared on 8/27/2010. Click here.
View all notes |
Alert me of new notes |
CANSLIM.net Company Profile |
SEC |
Zacks Reports |
StockTalk |
News |
Chart |
Request a new note
C
A N
S L
I M
|
IGTE
-
NASDAQ
Igate Corp
COMPUTER SOFTWARE and SERVICES - Information Technology Service
|
$18.37
|
+0.15
0.82% |
$18.43
|
513,121
127.36% of 50 DAV
50 DAV is 402,900
|
$19.45
-5.55%
|
9/8/2010
|
$17.29
|
PP = $18.26
|
|
MB = $19.17
|
Most Recent Note - 10/11/2010 6:13:56 PM
Y - Gapped up today then negatively reversed for a loss with above average volume. Last week it ended by rallying from important chart support at its 50 DMA line back to near its pivot point. More damaging losses would raise concerns and trigger technical sell signals.
>>> The latest Featured Stock Update with an annotated graph appeared on 9/10/2010. Click here.
View all notes |
Alert me of new notes |
CANSLIM.net Company Profile |
SEC |
Zacks Reports |
StockTalk |
News |
Chart |
Request a new note
C
A N
S L
I M
|
JOBS
-
NASDAQ
Fifty One Job Inc Ads
DIVERSIFIED SERVICES - Staffing and; Outsourcing Service
|
$38.26
|
+0.14
0.37% |
$38.76
|
98,290
62.72% of 50 DAV
50 DAV is 156,700
|
$40.50
-5.53%
|
9/16/2010
|
$31.59
|
PP = $30.40
|
|
MB = $31.92
|
Most Recent Note - 10/8/2010 3:43:27 PM
G - Solid gain today with light volume has halted a streak of 3 consecutive losses. Noted recently - "Very extended from a sound base. Prior highs in the $30 area define chart support."
>>> The latest Featured Stock Update with an annotated graph appeared on 9/16/2010. Click here.
View all notes |
Alert me of new notes |
CANSLIM.net Company Profile |
SEC |
Zacks Reports |
StockTalk |
News |
Chart |
Request a new note
C
A N
S L
I M
|
LULU
-
NASDAQ
Lululemon Athletica
MANUFACTURING - Textile Manufacturing
|
$45.94
|
-0.38
-0.82% |
$46.70
|
1,328,930
124.33% of 50 DAV
50 DAV is 1,068,900
|
$48.45
-5.18%
|
10/8/2010
|
$47.66
|
PP = $46.67
|
|
MB = $49.00
|
Most Recent Note - 10/11/2010 5:25:01 PM
Y - Down today on average volume, closing under its pivot point. Prior highs in the $45-46 area define chart support to watch following last week's technical breakout. See the latest FSU section analysis for details with an annotated graph.
>>> The latest Featured Stock Update with an annotated graph appeared on 10/8/2010. Click here.
View all notes |
Alert me of new notes |
CANSLIM.net Company Profile |
SEC |
Zacks Reports |
StockTalk |
News |
Chart |
Request a new note
C
A N
S L
I M
|
Symbol/Exchange
Company Name
Industry Group |
PRICE |
CHANGE
(%Change) |
Day High |
Volume
(% DAV)
(% 50 day avg vol) |
52 Wk Hi
% From Hi |
Featured
Date |
Price
Featured |
Pivot Featured |
|
Max Buy |
MELI
-
NASDAQ
Mercadolibre Inc
INTERNET - Internet Software and; Services
|
$64.77
|
+0.00
0.00% |
$65.39
|
2,490,110
281.81% of 50 DAV
50 DAV is 883,600
|
$76.81
-15.68%
|
5/13/2010
|
$54.21
|
PP = $55.85
|
|
MB = $58.64
|
Most Recent Note - 10/12/2010 5:27:31 PM
G - After a damaging gap down amid skeptical headlines about its earnings outlook, a strong close today near the session high for a small loss with 3 times average volume was an encouraging sign that it attracted support.
>>> The latest Featured Stock Update with an annotated graph appeared on 8/26/2010. Click here.
View all notes |
Alert me of new notes |
CANSLIM.net Company Profile |
SEC |
Zacks Reports |
StockTalk |
News |
Chart |
Request a new note
C
A N
S L
I M
|
MRX
-
NYSE
Medicis Pharmaceut Cl A
DRUGS - Biotechnology
|
$30.25
|
+0.32
1.07% |
$30.31
|
736,106
64.45% of 50 DAV
50 DAV is 1,142,100
|
$30.64
-1.27%
|
8/12/2010
|
$26.88
|
PP = $26.71
|
|
MB = $28.05
|
Most Recent Note - 10/5/2010 3:58:03 PM
G - Gapped up today rallying for a considerable gain, and hitting a new 52-week high. An upward trendline shown in the latest FSU section analysis defines an initial chart support level to watch.
>>> The latest Featured Stock Update with an annotated graph appeared on 10/4/2010. Click here.
View all notes |
Alert me of new notes |
CANSLIM.net Company Profile |
SEC |
Zacks Reports |
StockTalk |
News |
Chart |
Request a new note
C
A N
S L
I M
|
MWIV
-
NASDAQ
M W I Veterinary Supply
HEALTH SERVICES - Medical Instruments and; Supplies
|
$56.99
|
-0.65
-1.12% |
$57.68
|
123,161
178.49% of 50 DAV
50 DAV is 69,000
|
$59.50
-4.23%
|
7/29/2010
|
$52.05
|
PP = $52.09
|
|
MB = $54.69
|
Most Recent Note - 10/12/2010 1:00:16 PM
G - Pulling back for a small loss today on higher volume, it remains perched near its 52-week high. Volume totals had been cooling in recent weeks. No overhead supply remains to act as resistance. Its nearby 50 DMA line defines chart support.
>>> The latest Featured Stock Update with an annotated graph appeared on 9/7/2010. Click here.
View all notes |
Alert me of new notes |
CANSLIM.net Company Profile |
SEC |
Zacks Reports |
StockTalk |
News |
Chart |
Request a new note
C
A N
S L
I M
|
NEM
-
NYSE
Newmont Mining Corp
METALS and MINING - Gold
|
$62.00
|
-0.54
-0.86% |
$62.13
|
5,983,494
99.41% of 50 DAV
50 DAV is 6,019,300
|
$65.50
-5.34%
|
8/31/2010
|
$61.32
|
PP = $63.48
|
|
MB = $66.65
|
Most Recent Note - 10/7/2010 1:01:57 PM
Y - Loss today with higher volume raises concerns, sinking under its pivot point again after stalling just shy of its best-ever close. While leadership in the Mining - Gold/Silver/Gems group (L criteria) is a nice reassurance, its Relative Strength rank (81) and RS line have been waning for several weeks. It churned a lot of volume but made little price progress since first featured in a Stock Bulletin on 6/22/10 (read here).
>>> The latest Featured Stock Update with an annotated graph appeared on 9/14/2010. Click here.
View all notes |
Alert me of new notes |
CANSLIM.net Company Profile |
SEC |
Zacks Reports |
StockTalk |
News |
Chart |
Request a new note
C
A N
S L
I M
|
NEOG
-
NASDAQ
Neogen Corp
DRUGS - Diagnostic Substances
|
$34.31
|
-0.28
-0.81% |
$34.74
|
38,013
36.98% of 50 DAV
50 DAV is 102,800
|
$34.82
-1.46%
|
9/1/2010
|
$30.79
|
PP = $30.49
|
|
MB = $32.01
|
Most Recent Note - 10/5/2010 5:52:47 PM
G - Consolidating and recently enduring mild distributional pressure after getting extended from a sound base. Prior highs in the $30 area define initial support to watch.
>>> The latest Featured Stock Update with an annotated graph appeared on 8/20/2010. Click here.
View all notes |
Alert me of new notes |
CANSLIM.net Company Profile |
SEC |
Zacks Reports |
StockTalk |
News |
Chart |
Request a new note
C
A N
S L
I M
|
Symbol/Exchange
Company Name
Industry Group |
PRICE |
CHANGE
(%Change) |
Day High |
Volume
(% DAV)
(% 50 day avg vol) |
52 Wk Hi
% From Hi |
Featured
Date |
Price
Featured |
Pivot Featured |
|
Max Buy |
NFLX
-
NASDAQ
Netflix Inc
SPECIALTY RETAIL - Music and Video Stores
|
$155.39
|
+1.70
1.11% |
$155.83
|
3,635,253
63.75% of 50 DAV
50 DAV is 5,702,700
|
$174.40
-10.90%
|
8/10/2010
|
$124.05
|
PP = $124.00
|
|
MB = $130.20
|
Most Recent Note - 10/11/2010 6:10:31 PM
G - Consolidating on quieter volume after enduring distributional pressure following an impressive sprint to new highs that ended with a negative reversal on 9/30/10 at its all-time high. Its 50 DMA line is the next chart support level to watch.
>>> The latest Featured Stock Update with an annotated graph appeared on 10/1/2010. Click here.
View all notes |
Alert me of new notes |
CANSLIM.net Company Profile |
SEC |
Zacks Reports |
StockTalk |
News |
Chart |
Request a new note
C
A N
S L
I M
|
NTAP
-
NASDAQ
Netapp Inc
COMPUTER HARDWARE - Data Storage Devices
|
$48.77
|
+0.73
1.52% |
$48.88
|
5,439,850
63.49% of 50 DAV
50 DAV is 8,567,600
|
$51.40
-5.11%
|
9/8/2010
|
$46.98
|
PP = $44.99
|
|
MB = $47.24
|
Most Recent Note - 10/6/2010 6:15:32 PM
G - Damaging loss today on heavy volume was another clear sign of distributional pressure after repeatedly noted as "extended from a sound base." Support to watch is at prior chart highs near its latest pivot point.
>>> The latest Featured Stock Update with an annotated graph appeared on 9/8/2010. Click here.
View all notes |
Alert me of new notes |
CANSLIM.net Company Profile |
SEC |
Zacks Reports |
StockTalk |
News |
Chart |
Request a new note
C
A N
S L
I M
|
ORCL
-
NASDAQ
Oracle Corp
COMPUTER SOFTWARE and SERVICES - Application Software
|
$27.95
|
+0.10
0.36% |
$28.00
|
27,547,159
73.51% of 50 DAV
50 DAV is 37,471,600
|
$28.10
-0.53%
|
9/20/2010
|
$27.32
|
PP = $26.73
|
|
MB = $28.07
|
Most Recent Note - 10/12/2010 5:14:04 PM
Y - Recent gains on near average or lighter volume have it trading near its "max buy" level after stubbornly holding its ground following the"breakaway gap" on 9/17/10.
>>> The latest Featured Stock Update with an annotated graph appeared on 9/20/2010. Click here.
View all notes |
Alert me of new notes |
CANSLIM.net Company Profile |
SEC |
Zacks Reports |
StockTalk |
News |
Chart |
Request a new note
C
A N
S L
I M
|
PAY
-
NYSE
Verifone Systems Inc
COMPUTER HARDWARE - Transaction Automation Systems
|
$28.66
|
+0.59
2.10% |
$28.90
|
1,068,526
73.96% of 50 DAV
50 DAV is 1,444,700
|
$31.40
-8.73%
|
8/25/2010
|
$24.30
|
PP = $23.74
|
|
MB = $24.93
|
Most Recent Note - 10/12/2010 5:07:06 PM
G - Closed near the session high today with a 4th consecutive gain on light volume. Consolidating above support at its 50 DMA line (now $25.78) after recent distributional pressure.
>>> The latest Featured Stock Update with an annotated graph appeared on 8/30/2010. Click here.
View all notes |
Alert me of new notes |
CANSLIM.net Company Profile |
SEC |
Zacks Reports |
StockTalk |
News |
Chart |
Request a new note
C
A N
S L
I M
|
PRGO
-
NASDAQ
Perrigo Co
DRUGS - Drug Related Products
|
$66.67
|
+1.10
1.68% |
$66.83
|
692,275
73.91% of 50 DAV
50 DAV is 936,600
|
$67.49
-1.21%
|
9/15/2010
|
$63.73
|
PP = $64.76
|
|
MB = $68.00
|
Most Recent Note - 10/12/2010 5:17:54 PM
Y - Gain today with light volume led to its best ever close by just a few cents. Its action has been healthy and volume totals have cooled in recent weeks while it has consolidated in a tight range between its pivot point and "max buy" levels
>>> The latest Featured Stock Update with an annotated graph appeared on 9/15/2010. Click here.
View all notes |
Alert me of new notes |
CANSLIM.net Company Profile |
SEC |
Zacks Reports |
StockTalk |
News |
Chart |
Request a new note
C
A N
S L
I M
|
Symbol/Exchange
Company Name
Industry Group |
PRICE |
CHANGE
(%Change) |
Day High |
Volume
(% DAV)
(% 50 day avg vol) |
52 Wk Hi
% From Hi |
Featured
Date |
Price
Featured |
Pivot Featured |
|
Max Buy |
RAX
-
NYSE
Rackspace Hosting Inc
INTERNET - Internet Software and; Services
|
$24.14
|
+0.13
0.54% |
$24.26
|
1,488,810
61.42% of 50 DAV
50 DAV is 2,424,000
|
$26.50
-8.91%
|
9/21/2010
|
$22.84
|
PP = $23.61
|
|
MB = $24.79
|
Most Recent Note - 10/11/2010 6:07:10 PM
G - Consolidating on quieter volume today, yet holding its ground following a damaging gap down on 10/06/10 that was indicative of heavy distributional pressure.
>>> The latest Featured Stock Update with an annotated graph appeared on 9/21/2010. Click here.
View all notes |
Alert me of new notes |
CANSLIM.net Company Profile |
SEC |
Zacks Reports |
StockTalk |
News |
Chart |
Request a new note
C
A N
S L
I M
|
ROVI
-
NASDAQ
Rovi Corp
COMPUTER SOFTWARE andamp; SERVICES - Security Software andamp; Services
|
$50.15
|
+0.75
1.52% |
$50.35
|
1,234,337
78.44% of 50 DAV
50 DAV is 1,573,700
|
$53.00
-5.38%
|
8/31/2010
|
$43.31
|
PP = $45.06
|
|
MB = $47.31
|
Most Recent Note - 10/12/2010 5:35:40 PM
G - Volume totals have been cooling recently while consolidating in a healthy fashion well above support at prior highs and its 50 DMA line coinciding in the $45 area.
>>> The latest Featured Stock Update with an annotated graph appeared on 8/24/2010. Click here.
View all notes |
Alert me of new notes |
CANSLIM.net Company Profile |
SEC |
Zacks Reports |
StockTalk |
News |
Chart |
Request a new note
C
A N
S L
I M
|
SHOO
-
NASDAQ
Steven Madden Limited
CONSUMER NON-DURABLES - Textile - Apparel Footwear
|
$44.08
|
-0.03
-0.07% |
$44.45
|
243,347
55.43% of 50 DAV
50 DAV is 439,000
|
$44.74
-1.46%
|
9/15/2010
|
$38.94
|
PP = $40.27
|
|
MB = $42.28
|
Most Recent Note - 10/8/2010 3:58:00 PM
G - Hit yet another new 52-week high with today's gain on light volume. Prior highs in the $40 area define chart support to watch now. Color code was changed to green after getting extended more than +5% above its prior highs.
>>> The latest Featured Stock Update with an annotated graph appeared on 9/29/2010. Click here.
View all notes |
Alert me of new notes |
CANSLIM.net Company Profile |
SEC |
Zacks Reports |
StockTalk |
News |
Chart |
Request a new note
C
A N
S L
I M
|
SLW
-
NYSE
Silver Wheaton Corp
METALS and; MINING - Silver
|
$26.75
|
+0.16
0.60% |
$26.83
|
5,262,214
90.50% of 50 DAV
50 DAV is 5,814,400
|
$27.31
-2.05%
|
8/25/2010
|
$21.40
|
PP = $21.99
|
|
MB = $23.09
|
Most Recent Note - 10/8/2010 4:10:17 PM
G - Net weekly loss of just pennies at Friday's close barely broke the streak of 11 consecutive weekly gains to all-time highs. Prior highs and its 50 DMA line in the $22 area define chart support to watch on pullbacks.
>>> The latest Featured Stock Update with an annotated graph appeared on 8/25/2010. Click here.
View all notes |
Alert me of new notes |
CANSLIM.net Company Profile |
SEC |
Zacks Reports |
StockTalk |
News |
Chart |
Request a new note
C
A N
S L
I M
|
SVR
-
NYSE
Syniverse Holdings Inc
TELECOMMUNICATIONS - Diversified Communication Serv
|
$22.79
|
+0.08
0.35% |
$22.93
|
335,476
43.86% of 50 DAV
50 DAV is 764,900
|
$24.24
-5.98%
|
9/22/2010
|
$23.60
|
PP = $23.87
|
|
MB = $25.06
|
Most Recent Note - 10/12/2010 5:20:35 PM
G - Volume totals have cooled since it halted its recent worrisome slide near its 50 DMA line. The recent chart low ($21.47) defines important support to watch. Concerns have been raised as its Relative Strength rank has slumped under the 80+ guideline after promptly negating its latest breakout and encountering distributional pressure.
>>> The latest Featured Stock Update with an annotated graph appeared on 9/22/2010. Click here.
View all notes |
Alert me of new notes |
CANSLIM.net Company Profile |
SEC |
Zacks Reports |
StockTalk |
News |
Chart |
Request a new note
C
A N
S L
I M
|
Symbol/Exchange
Company Name
Industry Group |
PRICE |
CHANGE
(%Change) |
Day High |
Volume
(% DAV)
(% 50 day avg vol) |
52 Wk Hi
% From Hi |
Featured
Date |
Price
Featured |
Pivot Featured |
|
Max Buy |
UA
-
NYSE
Under Armour Inc Cl A
CONSUMER NON-DURABLES - Textile - Apparel Clothing
|
$46.40
|
+0.48
1.05% |
$46.74
|
589,392
81.40% of 50 DAV
50 DAV is 724,100
|
$47.00
-1.28%
|
9/9/2010
|
$39.99
|
PP = $40.10
|
|
MB = $42.11
|
Most Recent Note - 10/8/2010 3:38:48 PM
G - Big gain today with volume slightly above average volume has it poised for a new 2010 high close. It is extended from its latest sound base pattern after a considerable streak of gains.
>>> The latest Featured Stock Update with an annotated graph appeared on 9/9/2010. Click here.
View all notes |
Alert me of new notes |
CANSLIM.net Company Profile |
SEC |
Zacks Reports |
StockTalk |
News |
Chart |
Request a new note
C
A N
S L
I M
|
UFPT
-
NASDAQ
U F P Tech Inc
CONSUMER NON-DURABLES - Packaging and Containers
|
$12.74
|
-0.04
-0.31% |
$12.97
|
57,724
98.84% of 50 DAV
50 DAV is 58,400
|
$13.20
-3.48%
|
9/16/2010
|
$11.20
|
PP = $11.69
|
|
MB = $12.27
|
Most Recent Note - 10/11/2010 12:53:46 PM
G - Gain today with above average volume has it poised for a possible new high close. Prior highs in the $11 area define chart support to watch.
>>> The latest Featured Stock Update with an annotated graph appeared on 9/17/2010. Click here.
View all notes |
Alert me of new notes |
CANSLIM.net Company Profile |
SEC |
Zacks Reports |
StockTalk |
News |
Chart |
Request a new note
C
A N
S L
I M
|
ULTA
-
NASDAQ
Ulta Salon Cosm & Frag
SPECIALTY RETAIL - Specialty Retail, Other
|
$30.90
|
+1.87
6.44% |
$31.00
|
1,571,609
249.26% of 50 DAV
50 DAV is 630,500
|
$30.19
2.35%
|
9/3/2010
|
$26.36
|
PP = $25.89
|
|
MB = $27.18
|
Most Recent Note - 10/12/2010 1:15:24 PM
G - Considerable gain today with above average volume for a new 52-week high. Prior highs and its 50 DMA line coincide in the $26 area defining support to watch. No overhead supply remains to act as resistance.
>>> The latest Featured Stock Update with an annotated graph appeared on 9/3/2010. Click here.
View all notes |
Alert me of new notes |
CANSLIM.net Company Profile |
SEC |
Zacks Reports |
StockTalk |
News |
Chart |
Request a new note
C
A N
S L
I M
|
VIT
-
NYSE
Vanceinfo Tech Inc Ads
COMPUTER SOFTWARE and SERVICES - Business Software and Services
|
$33.13
|
+0.55
1.69% |
$33.19
|
536,958
83.37% of 50 DAV
50 DAV is 644,100
|
$33.30
-0.51%
|
7/8/2010
|
$25.20
|
PP = $26.58
|
|
MB = $27.91
|
Most Recent Note - 10/11/2010 6:12:09 PM
G - Still holding its ground stubbornly while perched at its all-time high. It is extended after rallying from a prior resistance level in the $26 area. Its 50 DMA line defines chart support to watch.
>>> The latest Featured Stock Update with an annotated graph appeared on 8/31/2010. Click here.
View all notes |
Alert me of new notes |
CANSLIM.net Company Profile |
SEC |
Zacks Reports |
StockTalk |
News |
Chart |
Request a new note
C
A N
S L
I M
|
WCRX
-
NASDAQ
Warner Chilcott Plc
DRUGS - Drug Manufacturers - Other
|
$24.96
|
+1.08
4.52% |
$25.06
|
5,690,032
201.00% of 50 DAV
50 DAV is 2,830,900
|
$24.34
2.55%
|
8/23/2010
|
$21.04
|
PP = $20.84
|
|
MB = $21.88
|
Most Recent Note - 10/12/2010 5:03:47 PM
G - Hit another new high today, and its color code is changed to green after rallying more than +5% above recent chart highs. Gapped up on 10/11/10 for a new high following a consolidation near its 10-week moving average line.
>>> The latest Featured Stock Update with an annotated graph appeared on 8/23/2010. Click here.
View all notes |
Alert me of new notes |
CANSLIM.net Company Profile |
SEC |
Zacks Reports |
StockTalk |
News |
Chart |
Request a new note
C
A N
S L
I M
|
Symbol/Exchange
Company Name
Industry Group |
PRICE |
CHANGE
(%Change) |
Day High |
Volume
(% DAV)
(% 50 day avg vol) |
52 Wk Hi
% From Hi |
Featured
Date |
Price
Featured |
Pivot Featured |
|
Max Buy |