You are not logged in.
This means you
CAN ONLY VIEW reports that were published prior to Monday, April 14, 2025.
You
MUST UPGRADE YOUR MEMBERSHIP if you want to see any current reports.
AFTER MARKET UPDATE - MONDAY, OCTOBER 12TH, 2009
Previous After Market Report Next After Market Report >>>
|
|
|
|
DOW |
+20.86 |
9,885.80 |
+0.21% |
|
Volume |
946,805,390 |
-4% |
|
Volume |
1,797,541,770 |
-9% |
|
NASDAQ |
-0.14 |
2,139.14 |
-0.01% |
|
Advancers |
1,643 |
53% |
|
Advancers |
1,236 |
44% |
|
S&P 500 |
+4.70 |
1,076.19 |
+0.44% |
|
Decliners |
1,347 |
44% |
|
Decliners |
1,461 |
52% |
|
Russell 2000 |
-1.11 |
613.81 |
-0.18% |
|
52 Wk Highs |
397 |
|
|
52 Wk Highs |
199 |
|
|
S&P 600 |
+0.38 |
323.73 |
+0.12% |
|
52 Wk Lows |
1 |
|
|
52 Wk Lows |
9 |
|
|
 |
Indices Close Mixed On Quiet Columbus Day Session
Adam Sarhan, Contributing Writer,
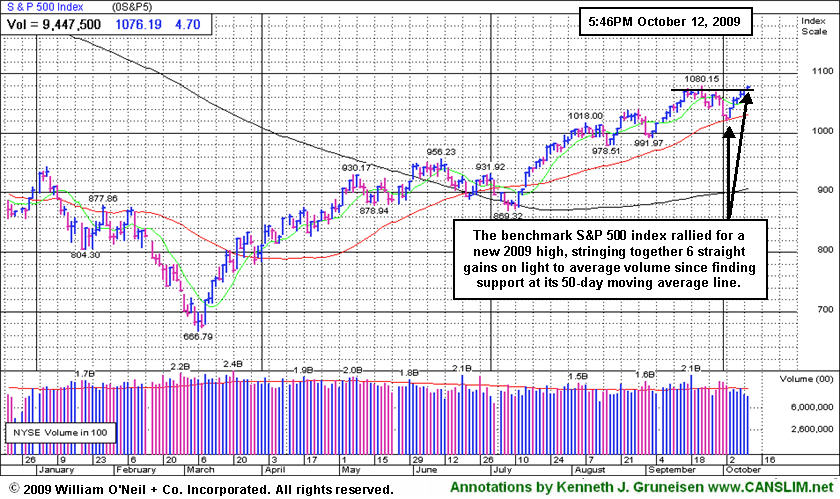
The major averages closed mixed and without any great changes after central banks, flush with record reserves, announced that they are moving away from the US dollar and into the euro and the yen. Volume was reported lighter, revealing no great buying conviction, or any further distribution from the institutional crowd. Advancers narrowly led decliners on the NYSE and while decliners slightly outnumbered advancers on the Nasdaq exchange. There were 71 high-ranked companies from the CANSLIM.net Leaders List that made a new 52-week high and appeared on the CANSLIM.net BreakOuts Page, sharply higher from the 46 issues that appeared on the prior session. New 52-week highs were in the triple digits, substantially outnumbering new 52-week lows, the later of which were in the single digits on both major exchanges. The recent expansion in the new highs list is another encouraging sign of healthier market action, as any sustainable market rally requires a healthy crop of strong leaders.
The major averages opened higher after policy makers across the globe announced record reserves during the third quarter. Bloomberg.com reported that foreign currency holdings grew by $413 billion last quarter, which is the highest reading since 2003, to $7.3 trillion. Central banks which reported currency breakdowns put +63% of the new cash into euros and yen in the third quarter according to Barclays Capital. That is the highest percentage in any quarter, with more than an $80 billion increase. The US currency has lost -10.3% on a trade-weighted basis over the past six months, which is the largest decline since 1991. The report showed the US dollar’s 37% share of new reserves fell from about a +63% average since 1999. The US dollar has steadily fallen over the past few years which has led many to question the official position of the US government vis-a-vis the greenback. The dollar continues to fall as the Treasury sells a record amount of debt to finance a budget deficit that totaled $1.4 trillion in fiscal 2009 ended Sept. 30. Many critics say that the US government is debasing its currency to help stimulate economic growth and that, in the long term, is a failed policy. Remember that a weaker currency boosts exports which helps economic growth but also hurts the nation’s creditors (mainly Asian countries). The US dollar index fell to 75.77 last week which is the lowest level since August 2008 and down from the high this year of 89.624 on March 4. The index, traded above 76.10 on Monday, which is within six points of its record low reached in March 2008.
The current rally remains intact as it currently enters its 32nd week from the March 12, 2009 follow-through day. That said, the market deserves the bullish benefit of the doubt until support is breached. So far, the Federal Reserve has helped the rally as they have kept rates near historic lows. The latest survey from Bloomberg (of 54 economists) shows that they believe the Fed will lift its overnight lending rate to 1.25% by the end of 2010. A separate poll shows that the European Central Bank (ECB) will increase its benchmark rate by half a percentage point to 1.5%. Economists believe that America’s economy will grow +2.4% in 2010, compared with +0.95% in the euro-zone, and +1% in Japan, median predictions show.
PICTURED: The S&P 500 Index rallied to a new 2009 high close, posting a 6th consecutive gain on light or average volume since finding support at its 50-day moving average line.
|
|
|
 |
Semiconductor Index Rallies Toward 2009 Highs Again
Kenneth J. Gruneisen - Passed the CAN SLIM® Master's Exam
Financial shares showed mixed action as the Bank Index ($BKX +0.97%) rose and the Broker/Dealer Index ($XBD -0.44%) fell modestly, meanwhile the Retail Index ($RLX -0.00%) was unchanged. The Healthcare Index ($HMO +1.06%) posted a gain, and energy-related shares' gains lifted the Integrated Oil Index ($XOI +0.99%) and Oil Services Index ($OSX +1.22%), however the Gold & Silver Index ($XAU -0.18%) failed to keep pace with other defensive groups. The Semiconductor Index ($SOX +1.40%) rallied higher, but that not enough to lift the tech-heavy Nasdaq Composite Index. Meanwhile, the Biotechnology Index ($BTK +0.16%) and Networking Index ($NWX +0.07%) only managed minor gains, and the Internet Index ($IIX -0.40%) edged lower.
Charts courtesy www.stockcharts.com
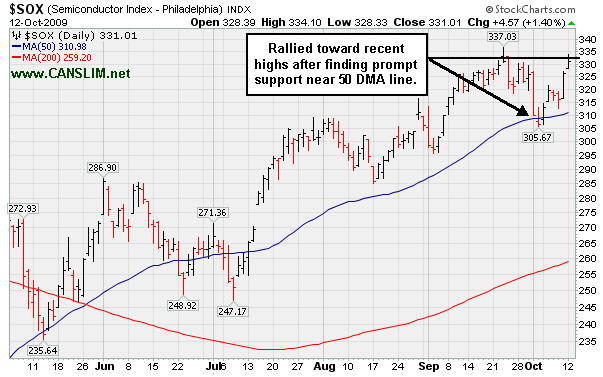
PICTURED: The Semiconductor Index ($SOX +1.40%) rallied toward recent highs after finding prompt support near its 50-day moving average (DMA) line.
| Oil Services |
$OSX |
201.95 |
+2.44 |
+1.22% |
+66.36% |
| Healthcare |
$HMO |
1,184.01 |
+12.44 |
+1.06% |
+23.31% |
| Integrated Oil |
$XOI |
1,064.77 |
+10.41 |
+0.99% |
+8.69% |
| Semiconductor |
$SOX |
331.01 |
+4.57 |
+1.40% |
+56.01% |
| Networking |
$NWX |
238.43 |
+0.17 |
+0.07% |
+65.70% |
| Internet |
$IIX |
219.98 |
-0.89 |
-0.40% |
+64.45% |
| Broker/Dealer |
$XBD |
123.51 |
-0.55 |
-0.44% |
+59.43% |
| Retail |
$RLX |
387.81 |
-0.01 |
-0.00% |
+38.87% |
| Gold & Silver |
$XAU |
176.07 |
-0.31 |
-0.18% |
+42.16% |
| Bank |
$BKX |
47.89 |
+0.46 |
+0.97% |
+8.06% |
| Biotech |
$BTK |
915.54 |
+1.48 |
+0.16% |
+41.47% |
|
|
|
 |
High Handle Forming On Light Volume
Kenneth J. Gruneisen - Passed the CAN SLIM® Master's Exam
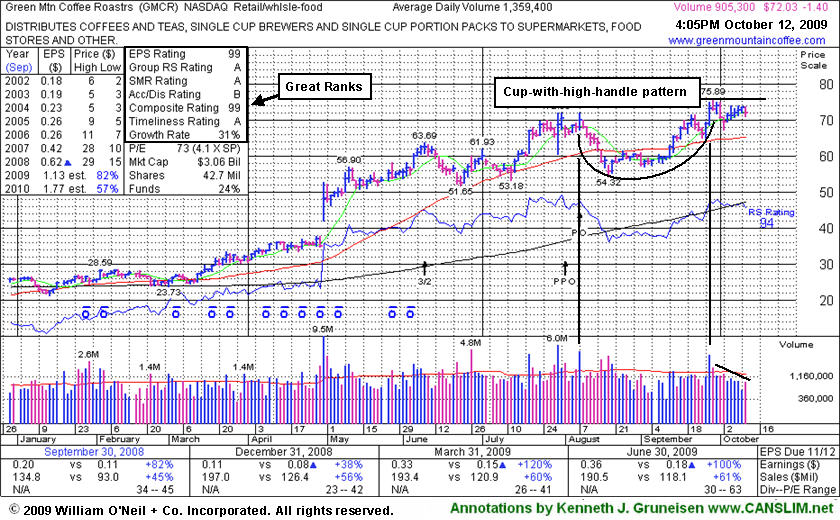
Green Mountain Coffee Roasters (GMCR -$1.40 or -1.94% to $72.03) has been quietly consolidating on the right side of a cup-with-high-handle pattern. It completed an additional share offering on 8/07/09, then slumped under its 50-day moving average (DMA) line and nearly tested support at prior chart lows before rallying back. Its big gain for a new 52-week high on 9/28/09 came with high volume, but while it cleared all chart resistance, it had not completed a sufficient length base or a proper handle for a cup-with-handle pattern. It negatively reversed on the next session after reaching the $75.89 high, which is the basis for the pivot point of its "high handle" being cited in notes since 10/05/09. Any deterioration under recent chart lows would raise concerns, and subsequent losses under its 50 DMA line would be even more worrisome signs of waekness.
A fresh breakout to new highs with a gain on heavy volume would trigger a valid technical buy signal, meanwhile it should remain on investors' watch lists. Disciplined investors will watch for volume-driven gains to trigger a new technical buy signal before making any initial buys or add-on purchases. Do not be confused by the 3-for-2 split that occurred in the interim, as GMCR has traded up as much as +191% since appearing with an annotated graph under the headline "It May Soon Be Time To Go Green" when featured in the January 2009 CANSLIM.net News (read here).
|
|
|
Color Codes Explained :
Y - Better candidates highlighted by our
staff of experts.
G - Previously featured
in past reports as yellow but may no longer be buyable under the
guidelines.
***Last / Change / Volume quote data in this table corresponds with the timestamp on the note***
Symbol/Exchange
Company Name
Industry Group |
Last |
Chg. |
Vol
% DAV |
Date Featured |
Price Featured |
Latest Pivot Point
Featured |
Status |
| Latest Max Buy Price |
ARO
- NYSE
Aeropostale Inc
RETAIL - Apparel Stores
|
$41.91
|
-0.52
|
2,146,497
79% DAV
2,718,600
|
8/21/2009
(Date
Featured) |
$39.21
(Price
Featured) |
PP = $38.84 |
Y |
| MB = $40.78 |
Most Recent Note - 10/12/2009 4:48:43 PM
Y - Down today on lighter volume, falling for a 4th session in a row. Tested its 50 DMA line last week as it actually posted a weekly gain, despite encountering distributional pressure. This high-ranked leader in the Retail - Clothing/shoe group is still trading only -6.6% from its all-time highs. Color code was changed to yellow, with it permissible under the guidelines to accumulate shares from the first successful test of support at its short-term average line up to as much as 5% above its latest chart highs. Important support to watch is at its 50 DMA line, where a violation would raise concerns and trigger a technical sell signal. The next key chart support level is prior highs in the $38 area. It was featured in yellow in the 8/21/09 Mid-Day BreakOuts Report (read here).
>>> The latest Featured Stock Update with an annotated graph appeared on 10/6/2009. click here.
|
|
C
A
S
I |
News |
Chart |
SEC
View all notes Alert
me of new notes
Company
Profile
|
ARST
-
|
$22.99
|
+0.22
|
604,171
95% DAV
634,500
|
9/1/2009
(Date
Featured) |
$19.91
(Price
Featured) |
PP = $20.90 |
G |
| MB = $21.95 |
Most Recent Note - 10/12/2009 4:50:09 PM
G - Small gain on near average volume today. Consolidating in a very tight trading range with volume generally drying up since its powerful 9/04/09 breakout. As previously noted, "Recent lows may be considered an initial support level. Prior chart highs and its 50 DMA line, coinciding in the $20 area, define an important technical support level to watch on pullbacks."
>>> The latest Featured Stock Update with an annotated graph appeared on 10/2/2009. click here.
|
|
C
A
S
I |
News |
Chart |
SEC
View all notes Alert
me of new notes
Company
Profile
|
BIDU
- NASDAQ
Baidu Inc Ads
INTERNET - Internet Information Providers
|
$413.49
|
-13.58
|
2,768,561
162% DAV
1,711,700
|
9/8/2009
(Date
Featured) |
$351.80
(Price
Featured) |
PP = $368.59 |
G |
| MB = $387.02 |
Most Recent Note - 10/12/2009 4:52:49 PM
G - Pulled back today with above average volume. Gains with well above average volume last week lifted it to new 2009 highs and challenged its 2007 all-time high of $429. Recently found prompt support after consolidating near its prior chart highs and pivot point, meanwhile staying well above its 50 DMA line. BIDU was featured in yellow in the 9/08/09 Mid-Day BreakOuts Report (read here).
>>> The latest Featured Stock Update with an annotated graph appeared on 10/7/2009. click here.
|
|
C
A
S
I |
News |
Chart |
SEC
View all notes Alert
me of new notes
Company
Profile
|
CACC
- NASDAQ
Credit Acceptance Corp
FINANCIAL SERVICES - Credit Services
|
$35.35
|
+0.05
|
24,496
54% DAV
45,000
|
9/29/2009
(Date
Featured) |
$33.48
(Price
Featured) |
PP = $32.60 |
G |
| MB = $34.23 |
Most Recent Note - 10/12/2009 4:55:47 PM
G - Ended near its session low yet posted a 7th consecutive gain today for another new high close above its "max buy" level. Color code was changed to green as it got extended from its prior base. The Finance - Consumer/Commercial Loans firm has maintained a great track record of annual and quarterly sales revenues and earnings increases. It was featured on 9/29/09 in yellow in the mid-day report (read here).
>>> The latest Featured Stock Update with an annotated graph appeared on 9/29/2009. click here.
|
|
C
A
S
I |
News |
Chart |
SEC
View all notes Alert
me of new notes
Company
Profile
|
CRM
- NYSE
Salesforce.com Inc
INTERNET - Internet Software & Services
|
$61.47
|
+0.50
|
1,569,286
74% DAV
2,108,400
|
8/16/2009
(Date
Featured) |
$47.12
(Price
Featured) |
PP = $45.59 |
G |
| MB = $47.87 |
Most Recent Note - 10/12/2009 4:57:40 PM
G - Small gain on light volume for another new 2009 high. Its latest pullback tested support at prior highs in the $55 area. It is extended from any sound base. Technical support to watch now is an upward trendline connecting its July, August and October chart lows, a line which comes into play above additional support at its 50 DMA line.
>>> The latest Featured Stock Update with an annotated graph appeared on 10/5/2009. click here.
|
|
C
A
S
I |
News |
Chart |
SEC
View all notes Alert
me of new notes
Company
Profile
|
EBIX
- NASDAQ
Ebix Inc
COMPUTER SOFTWARE & SERVICES - Business Software & Services
|
$60.78
|
+2.47
|
486,594
265% DAV
183,700
|
8/28/2009
(Date
Featured) |
$45.86
(Price
Featured) |
PP = $45.35 |
G |
| MB = $47.62 |
Most Recent Note - 10/12/2009 5:01:06 PM
G - Gapped up today for a new all-time high, with its considerable gain on heavy volume adding to its winning streak of 10 gains in the 11 prior sessions. It is extended from any sound base, well above support at its 50 DMA line. It is also more than +80% above its 200 DMA line, which is a reminder to be watchful for sell signals, rather than chasing it and making reckless buys without a new base forming.
>>> The latest Featured Stock Update with an annotated graph appeared on 9/24/2009. click here.
|
|
C
A
S
I |
News |
Chart |
SEC
View all notes Alert
me of new notes
Company
Profile
|
GMCR
- NASDAQ
Green Mtn Coffee Roastrs
FOOD & BEVERAGE - Processed & Packaged Goods
|
$72.03
|
-1.40
|
905,662
67% DAV
1,359,400
|
10/5/2009
(Date
Featured) |
$71.11
(Price
Featured) |
PP = $75.89 |
Y |
| MB = $79.68 |
Most Recent Note - 10/12/2009 5:02:42 PM
Y - Loss on light volume today. Stellar ranks, but it has clearly stalled since its big gain on 9/28/09 with heavy volume. Its 9/29/09 high, before a negative reversal, is the basis for the latest pivot point noted as a "cup-with-high-handle pattern" since 10/05/09. Earlier notes discussed minor flaws in its base which resembled a cup-with-handle. Disciplined investors will watch for volume-driven gains to trigger a new technical buy signal before making any initial buys or add-on purchases.
>>> The latest Featured Stock Update with an annotated graph appeared on 10/12/2009. click here.
|
|
C
A
S
I |
News |
Chart |
SEC
View all notes Alert
me of new notes
Company
Profile
|
NVEC
- NASDAQ
N V E Corp
ELECTRONICS - Semiconductor - Specialized
|
$51.60
|
-1.12
|
59,879
73% DAV
82,000
|
8/26/2009
(Date
Featured) |
$55.32
(Price
Featured) |
PP = $57.60 |
G |
| MB = $60.48 |
Most Recent Note - 10/12/2009 5:04:06 PM
G - Down today on light volume. Concerns increase the longer it struggles below its 50 DMA line. That short-term average is now downward sloping and has acted as a resistance level while it has been consolidating. Prior chart lows in the $49 area are an important support level now, and further deterioration may completely negate its 7/23/09 breakaway gap and raise more serious concerns (especially if on heavy volume) and trigger worrisome technical sell signals.
>>> The latest Featured Stock Update with an annotated graph appeared on 9/30/2009. click here.
|
|
C
A
S
I |
News |
Chart |
SEC
View all notes Alert
me of new notes
Company
Profile
|
PEGA
- NASDAQ
Pegasystems Inc
COMPUTER SOFTWARE & SERVICES - Business Software & Services
|
$34.83
|
-0.10
|
253,529
67% DAV
378,100
|
9/9/2009
(Date
Featured) |
$31.14
(Price
Featured) |
PP = $33.35 |
Y |
| MB = $35.02 |
Most Recent Note - 10/12/2009 5:06:41 PM
Y - Ended with a loss today on light volume after early gains for a new all-time high. This high-ranked Computer Software - Financial firm gapped down on 10/02/09 and traded under its 50 DMA line, then found prompt support, however the pullback raised concerns as it violated an upward trendline connecting its July-September chart lows, an initial support level.
>>> The latest Featured Stock Update with an annotated graph appeared on 10/8/2009. click here.
|
|
C
A
S
I |
News |
Chart |
SEC
View all notes Alert
me of new notes
Company
Profile
|
SWI
- NYSE
Solarwinds Inc
COMPUTER SOFTWARE & SERVICES - Application Software
|
$23.03
|
+0.59
|
412,463
87% DAV
475,600
|
9/30/2029
(Date
Featured) |
$22.03
(Price
Featured) |
PP = $21.72 |
G |
| MB = $22.81 |
Most Recent Note - 10/12/2009 5:11:05 PM
G - Gain on near average volume today, rising back above its previously cited "max buy" level, so its color code is changed to green. It has quietly rallied up from important support at its 50 DMA line after briefly and quietly consolidating under its last pivot point. It was featured in the October 2009 issue of CANSLIM.net News (read here).
>>> The latest Featured Stock Update with an annotated graph appeared on 9/30/2009. click here.
|
|
C
A
S
I |
News |
Chart |
SEC
View all notes Alert
me of new notes
Company
Profile
|
WNS
- NYSE
W N S Holdings Ltd Ads
DIVERSIFIED SERVICES - Business/Management Services
|
$14.92
|
-0.06
|
51,504
92% DAV
55,900
|
9/28/2009
(Date
Featured) |
$15.28
(Price
Featured) |
PP = $16.10 |
G |
| MB = $16.91 |
Most Recent Note - 10/12/2009 5:15:54 PM
G - Down today for its 8th loss in 9 sessions, closing at its 50 DMA line. Color code is changed to green, and it would need to rally for a new high close above $16 for its outlook to improve. It has encountered stubborn resistance since featured in yellow in the 9/28/09 mid-day report (read here). Quarterly earnings have been above the +25% guideline and its annual earnings history has been great, satisfying the C & A criteria. However, sales revenues growth has decelerated.
>>> The latest Featured Stock Update with an annotated graph appeared on 9/28/2009. click here.
|
|
C
A
S
I |
News |
Chart |
SEC
View all notes Alert
me of new notes
Company
Profile
|
|
|
|
THESE ARE NOT BUY RECOMMENDATIONS!
Comments contained in the body of this report are technical
opinions only. The material herein has been obtained
from sources believed to be reliable and accurate, however,
its accuracy and completeness cannot be guaranteed.
This site is not an investment advisor, hence it does
not endorse or recommend any securities or other investments.
Any recommendation contained in this report may not
be suitable for all investors and it is not to be deemed
an offer or solicitation on our part with respect to
the purchase or sale of any securities. All trademarks,
service marks and trade names appearing in this report
are the property of their respective owners, and are
likewise used for identification purposes only.
This report is a service available
only to active Paid Premium Members.
You may opt-out of receiving report notifications
at any time. Questions or comments may be submitted
by writing to Premium Membership Services 665 S.E. 10 Street, Suite 201 Deerfield Beach, FL 33441-5634 or by calling 1-800-965-8307
or 954-785-1121.
|
|
|


