***Last / Change / Volume data in this table is the closing quote data***
Symbol/Exchange
Company Name
Industry Group |
PRICE |
CHANGE
(%Change) |
Day High |
Volume
(% DAV)
(% 50 day avg vol) |
52 Wk Hi
% From Hi |
Featured
Date |
Price
Featured |
Pivot Featured |
|
Max Buy |
AVG
-
NYSE
A V G Technologies N.V.
INTERNET - Internet Software and Services
|
$23.89
|
-0.04
-0.17% |
$24.22
|
458,940
47.89% of 50 DAV
50 DAV is 958,400
|
$26.56
-10.04%
|
9/13/2013
|
$23.06
|
PP = $23.88
|
|
MB = $25.07
|
Most Recent Note - 10/10/2013 7:06:46 PM
Y - The prompt rebound above its 50 DMA line helped its outlook and its color code is changed to yellow. Rebounded above prior highs in the $23 area and its 50 DMA line with gains on lighter volume after triggering technical sell signals with volume-driven losses.
>>> FEATURED STOCK ARTICLE : Rallying Near Pivot Point With Greater Volume Conviction - 9/13/2013
View all notes |
Set NEW NOTE alert |
CANSLIM.net Company Profile |
SEC
News |
Chart |
Request a new note
C
A N
S L
I M


|
BITA
-
NYSE
Bitauto Hldgs Ltd Ads
INTERNET - Internet Information Providers
|
$20.49
|
+0.83
4.22% |
$20.55
|
581,406
95.13% of 50 DAV
50 DAV is 611,200
|
$22.67
-9.62%
|
9/24/2013
|
$16.40
|
PP = $17.31
|
|
MB = $18.18
|
 Most Recent Note - 10/11/2013 6:04:02 PM
G - Posted a gain today on lighter volume following 2 negative reversals in the prior 3 sessions. Prior highs in the $18 area define initial support to watch on pullbacks.
>>> FEATURED STOCK ARTICLE : Volume-Driven Gains Cleared Latest Pivot Point - 10/2/2013
View all notes |
Set NEW NOTE alert |
CANSLIM.net Company Profile |
SEC
News |
Chart |
Request a new note
C
A N
S L
I M
|
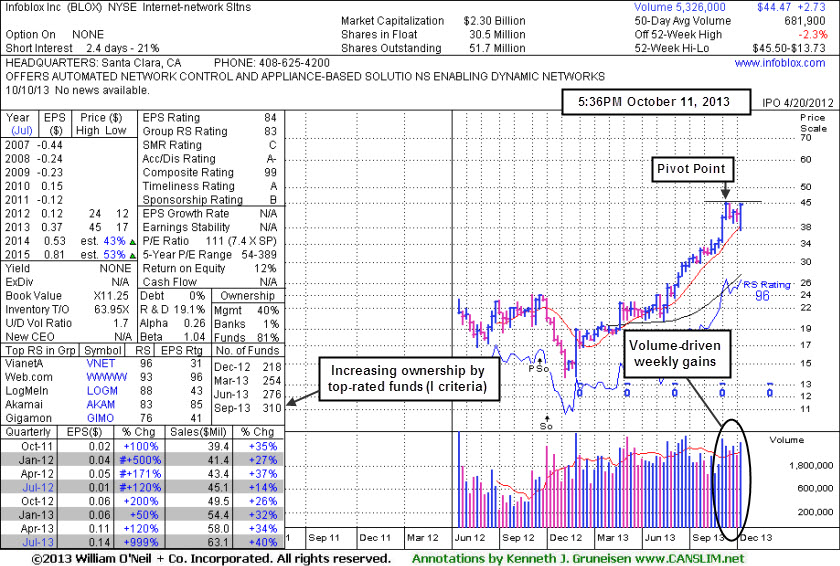
BLOX
-
NYSE
Infoblox Inc
COMPUTER HARDWARE - Networking and Communication Dev
|
$44.47
|
+3.26
7.91% |
$44.79
|
1,425,443
209.04% of 50 DAV
50 DAV is 681,900
|
$45.50
-2.26%
|
10/11/2013
|
$43.02
|
PP = $45.60
|
|
MB = $47.88
|
Most Recent Note - 10/11/2013 6:09:14 PM
Y - Rallied near its 52-week high with today's 3rd consecutive volume-driven gain. Highlighted in yellow while building on a flat base in the earlier mid-day report (read here). Subsequent volume-driven gains for new highs may trigger a technical buy signal. Found support while consolidating in an orderly fashion above its 50 DMA line. Strong sales revenues and solid earnings increases in the Oct '12, Jan, Apr, and Jul '13 quarterly comparisons versus the year ago periods satisfy the C criteria. Up and down annual earnings (A criteria) prior to its 2012 IPO is a concern. Since completing a Secondary Offering on 10/04/12 it followed with choppy action and then an impressive rebound and rally. See the latest Featured Stock analysis for more details and an annotated weekly graph.

>>> FEATURED STOCK ARTICLE : Finished Another Week Higher With Volume Behind Gains - 10/11/2013
View all notes |
Set NEW NOTE alert |
CANSLIM.net Company Profile |
SEC
News |
Chart |
Request a new note
C
A N
S L
I M
|
CELG
-
NASDAQ
Celgene Corp
DRUGS - Drug Manufacturers - Major
|
$153.17
|
+0.62
0.41% |
$154.78
|
2,047,841
79.74% of 50 DAV
50 DAV is 2,568,100
|
$157.95
-3.03%
|
9/12/2013
|
$149.50
|
PP = $150.02
|
|
MB = $157.52
|
Most Recent Note - 10/11/2013 6:13:07 PM
Y - Posted gains on lighter volume after finding support at its 50 DMA line this week. The recent low ($143.13 on 10/09/13) defines important near-term support where a subsequent violation may trigger a more worrisome technical sell signal.
>>> FEATURED STOCK ARTICLE : Volume-Driven Gain Challenging New Pivot Point - 9/20/2013
View all notes |
Set NEW NOTE alert |
CANSLIM.net Company Profile |
SEC
News |
Chart |
Request a new note
C
A N
S L
I M
|
EGBN
-
NASDAQ
Eagle Bancorp Inc
BANKING - Regional - Mid-Atlantic Banks
|
$28.76
|
+1.22
4.43% |
$29.00
|
46,477
66.87% of 50 DAV
50 DAV is 69,500
|
$28.78
-0.07%
|
9/16/2013
|
$27.48
|
PP = $27.77
|
|
MB = $29.16
|
Most Recent Note - 10/11/2013 6:01:34 PM
Y - Hit a new 52-week high today with a considerable gain backed by light volume. Recent lows and 50 DMA line define near-term support.
>>> FEATURED STOCK ARTICLE : Finished Lower After "Negative Reversal" - 9/16/2013
View all notes |
Set NEW NOTE alert |
CANSLIM.net Company Profile |
SEC
News |
Chart |
Request a new note
C
A N
S L
I M
|
Symbol/Exchange
Company Name
Industry Group |
PRICE |
CHANGE
(%Change) |
Day High |
Volume
(% DAV)
(% 50 day avg vol) |
52 Wk Hi
% From Hi |
Featured
Date |
Price
Featured |
Pivot Featured |
|
Max Buy |
FLT
-
NYSE
Fleetcor Technologies
DIVERSIFIED SERVICES - Business/Management Services
|
$106.59
|
-0.49
-0.46% |
$108.24
|
745,483
106.51% of 50 DAV
50 DAV is 699,900
|
$113.68
-6.24%
|
8/19/2013
|
$99.01
|
PP = $100.97
|
|
MB = $106.02
|
Most Recent Note - 10/10/2013 12:16:12 PM
G - Undercut its 50 DMA line on the prior session. Today's prompt rebound above that important short-term average is a sign of support that helps its outlook.
>>> FEATURED STOCK ARTICLE : Extended After 13 Weekly Gains in Span of 14 Weeks - 10/7/2013
View all notes |
Set NEW NOTE alert |
CANSLIM.net Company Profile |
SEC
News |
Chart |
Request a new note
C
A N
S L
I M
|
GNRC
-
NYSE
Generac Hldgs Inc
CONSUMER DURABLES - Electronic Equipment
|
$40.93
|
+0.50
1.24% |
$41.32
|
890,338
117.69% of 50 DAV
50 DAV is 756,500
|
$44.30
-7.61%
|
9/12/2013
|
$41.40
|
PP = $43.27
|
|
MB = $45.43
|
Most Recent Note - 10/8/2013 5:04:44 PM
G - Color code is changed to green after a considerable loss today on above average volume violated its 50 DMA line triggering a technical sell signal. Prior lows in $39 area define important near-term support. Disciplined investors limit losses by selling if any stock falls more than -7% from their purchase price.
>>> FEATURED STOCK ARTICLE : Pullback Following Friday's Technical Buy Signal - 9/23/2013
View all notes |
Set NEW NOTE alert |
CANSLIM.net Company Profile |
SEC
News |
Chart |
Request a new note
C
A N
S L
I M
|
JAZZ
-
NASDAQ
Jazz Pharmaceuticals Plc
DRUGS - Biotechnology
|
$83.51
|
-1.26
-1.49% |
$85.20
|
702,357
97.90% of 50 DAV
50 DAV is 717,400
|
$93.84
-11.01%
|
9/30/2013
|
$93.20
|
PP = $89.10
|
|
MB = $93.56
|
Most Recent Note - 10/8/2013 12:09:58 PM
G- Violated its 50 DMA line with a damaging loss on heavy volume today triggering a technical sell signal. Color code is changed to green. Disciplined investors limit losses if any stock falls more than -7% from their purchase price.
>>> FEATURED STOCK ARTICLE : Strong Finish With High Volume Indicative of Accumulation - 9/30/2013
View all notes |
Set NEW NOTE alert |
CANSLIM.net Company Profile |
SEC
News |
Chart |
Request a new note
C
A N
S L
I M
|
KORS
-
NYSE
Michael Kors Hldgs Ltd
RETAIL - Apparel Stores
|
$72.88
|
-1.35
-1.82% |
$74.60
|
2,753,270
82.67% of 50 DAV
50 DAV is 3,330,600
|
$78.62
-7.30%
|
8/6/2013
|
$69.66
|
PP = $66.28
|
|
MB = $69.59
|
Most Recent Note - 10/8/2013 5:15:40 PM
G - Violated its 50 DMA line with a damaging loss today triggering a technical sell signal. Prior highs in the $66 area define the next chart support area.
>>> FEATURED STOCK ARTICLE : Extended From Base After Additional Volume-Driven Gains - 9/27/2013
View all notes |
Set NEW NOTE alert |
CANSLIM.net Company Profile |
SEC
News |
Chart |
Request a new note
C
A N
S L
I M
|
LOPE
-
NASDAQ
Grand Canyon Education
DIVERSIFIED SERVICES - Education and; Training Services
|
$40.71
|
+0.34
0.84% |
$40.78
|
239,733
71.93% of 50 DAV
50 DAV is 333,300
|
$41.33
-1.50%
|
6/19/2013
|
$31.47
|
PP = $34.17
|
|
MB = $35.88
|
Most Recent Note - 10/10/2013 7:11:11 PM
G - Perched near all-time highs. Fundamental concerns remain while technical action has been reassuring.
>>> FEATURED STOCK ARTICLE : Perched Near All-Time High After Sub Par Quarterly Increase - 9/12/2013
View all notes |
Set NEW NOTE alert |
CANSLIM.net Company Profile |
SEC
News |
Chart |
Request a new note
C
A N
S L
I M
|
Symbol/Exchange
Company Name
Industry Group |
PRICE |
CHANGE
(%Change) |
Day High |
Volume
(% DAV)
(% 50 day avg vol) |
52 Wk Hi
% From Hi |
Featured
Date |
Price
Featured |
Pivot Featured |
|
Max Buy |
MRLN
-
NASDAQ
Marlin Business Services
DIVERSIFIED SERVICES - Rental and Leasing Services
|
$25.31
|
+1.55
6.52% |
$25.45
|
21,183
59.17% of 50 DAV
50 DAV is 35,800
|
$26.96
-6.12%
|
9/9/2013
|
$23.75
|
PP = $24.03
|
|
MB = $25.23
|
Most Recent Note - 10/11/2013 6:15:09 PM
G - Finished near the session high with a solid gain while rallying from support at its 50 DMA line. Subsequent losses below the recent low ($23.25) would trigger a more worrisome technical sell signal.
>>> FEATURED STOCK ARTICLE : Faring Better Than Others While Testing 50-Day Average Line - 10/8/2013
View all notes |
Set NEW NOTE alert |
CANSLIM.net Company Profile |
SEC
News |
Chart |
Request a new note
C
A N
S L
I M
|
PCLN
-
NASDAQ
Priceline.Com Inc
INTERNET - Internet Software and Services
|
$1,010.63
|
-2.56
-0.25% |
$1,028.35
|
829,288
131.17% of 50 DAV
50 DAV is 632,200
|
$1,074.89
-5.98%
|
9/13/2013
|
$966.82
|
PP = $995.08
|
|
MB = $1,044.83
|
Most Recent Note - 10/9/2013 12:43:47 PM
Y - Slumped under prior highs near $995 defining initial support to watch and tested support near its 50 DMA line today. Disciplined investors limit losses by selling if any stock falls more than -7% from their purchase price.
>>> FEATURED STOCK ARTICLE : Wedging to New Highs With Gains Lacking Volume Conviction - 9/19/2013
View all notes |
Set NEW NOTE alert |
CANSLIM.net Company Profile |
SEC
News |
Chart |
Request a new note
C
A N
S L
I M
|
PRAA
-
NASDAQ
Portfolio Recovery Assoc
DIVERSIFIED SERVICES - Business/Management Services
|
$59.10
|
+0.74
1.27% |
$59.75
|
377,304
77.33% of 50 DAV
50 DAV is 487,900
|
$61.60
-4.06%
|
7/31/2013
|
$51.43
|
PP = $54.72
|
|
MB = $57.46
|
Most Recent Note - 10/7/2013 6:33:42 PM
G - Down today for a 4th consecutive small loss on light volume. Pulling back from its 52-week high after gains on light volume, wedging higher and getting extended from its prior base.
>>> FEATURED STOCK ARTICLE : Wedging to New Highs With Gains Lacking Volume Conviction - 9/26/2013
View all notes |
Set NEW NOTE alert |
CANSLIM.net Company Profile |
SEC
News |
Chart |
Request a new note
C
A N
S L
I M
|
PRLB
-
NYSE
Proto Labs Inc
MANUFACTURING - Small Tools and Accessories
|
$76.73
|
+2.04
2.73% |
$77.25
|
197,238
47.63% of 50 DAV
50 DAV is 414,100
|
$80.91
-5.17%
|
7/29/2013
|
$64.86
|
PP = $67.50
|
|
MB = $70.88
|
Most Recent Note - 10/10/2013 7:08:17 PM
G - Posted a gain on lighter volume today. Found prompt support at its 50 DMA line. More damaging losses would raise greater concerns.
>>> FEATURED STOCK ARTICLE : Extended Following Additional Volume-Driven Gains - 9/25/2013
View all notes |
Set NEW NOTE alert |
CANSLIM.net Company Profile |
SEC
News |
Chart |
Request a new note
C
A N
S L
I M
|
SFUN
-
NYSE
Soufun Hldgs Ltd Ads A
INTERNET - Internet Information Providers
|
$51.42
|
-0.48
-0.92% |
$52.59
|
1,402,728
111.82% of 50 DAV
50 DAV is 1,254,400
|
$53.77
-4.37%
|
7/16/2013
|
$29.54
|
PP = $27.90
|
|
MB = $29.30
|
Most Recent Note - 10/10/2013 6:41:00 PM
G - Rallied from its 50 DMA line for a 2nd consecutive solid gain. Subsequent violations of the 50 DMA line and recent lows may trigger technical sell signals.
>>> FEATURED STOCK ARTICLE : Following Great Rally No New Base Has Been Formed - 10/1/2013
View all notes |
Set NEW NOTE alert |
CANSLIM.net Company Profile |
SEC
News |
Chart |
Request a new note
C
A N
S L
I M
|
Symbol/Exchange
Company Name
Industry Group |
PRICE |
CHANGE
(%Change) |
Day High |
Volume
(% DAV)
(% 50 day avg vol) |
52 Wk Hi
% From Hi |
Featured
Date |
Price
Featured |
Pivot Featured |
|
Max Buy |
SSNC
-
NASDAQ
S S & C Technologies
COMPUTER SOFTWARE and SERVICES - Application Software
|
$36.88
|
+0.63
1.74% |
$36.89
|
222,235
50.08% of 50 DAV
50 DAV is 443,800
|
$39.94
-7.66%
|
9/5/2013
|
$36.01
|
PP = $38.90
|
|
MB = $40.85
|
Most Recent Note - 10/8/2013 12:48:50 PM
G - Color code is changed to green while deteriorating and violating its 50 DMA line with today's loss on higher volume triggering a technical sell signal. Completed a Secondary Offering on 9/20/13 while perched at all-time highs.
>>> FEATURED STOCK ARTICLE : Finding Support Near 50-Day Average After Secondary Offering - 10/4/2013
View all notes |
Set NEW NOTE alert |
CANSLIM.net Company Profile |
SEC
News |
Chart |
Request a new note
C
A N
S L
I M
|
SSYS
-
NASDAQ
Stratasys Ltd
COMPUTER HARDWARE - Computer Peripherals
|
$102.94
|
+3.70
3.73% |
$103.56
|
1,351,144
117.66% of 50 DAV
50 DAV is 1,148,300
|
$113.49
-9.30%
|
10/11/2013
|
$102.94
|
PP = $105.38
|
|
MB = $110.65
|
Most Recent Note - 10/11/2013 6:26:35 PM
Y - Forming a "double bottom" base and its color code is changed to yellow as a new pivot point cited is based on its 9/26/13 high. Rebound above its 50 DMA line with 2 consecutive volume-driven gains helped its technical stance improve.
>>> FEATURED STOCK ARTICLE : Faltering and Relative Strength Waning After Offering - 10/9/2013
View all notes |
Set NEW NOTE alert |
CANSLIM.net Company Profile |
SEC
News |
Chart |
Request a new note
C
A N
S L
I M
|
STMP
-
NASDAQ
Stamps.Com Inc
INTERNET - Internet Software and Services
|
$43.52
|
+1.41
3.35% |
$43.63
|
86,082
74.66% of 50 DAV
50 DAV is 115,300
|
$46.80
-7.00%
|
9/24/2013
|
$45.54
|
PP = $46.57
|
|
MB = $48.90
|
Most Recent Note - 10/11/2013 6:28:09 PM
Y - Color code is changed to yellow after rebounding above its 50 DMA line helping its technical stance improve.
>>> FEATURED STOCK ARTICLE : Forming New Set-Up After 50-Day Average Acted as Support - 9/24/2013
View all notes |
Set NEW NOTE alert |
CANSLIM.net Company Profile |
SEC
News |
Chart |
Request a new note
C
A N
S L
I M
|
TBBK
-
NASDAQ
Bancorp Inc
BANKING - Regional - Mid-Atlantic Banks
|
$18.54
|
+0.13
0.71% |
$18.81
|
190,856
108.13% of 50 DAV
50 DAV is 176,500
|
$18.61
-0.38%
|
9/4/2013
|
$16.26
|
PP = $16.79
|
|
MB = $17.63
|
Most Recent Note - 10/11/2013 6:29:55 PM
G - Color code is changed to green after rising back beyond its "max buy" level. Recent lows define near-term support above its 50 DMA line.
>>> FEATURED STOCK ARTICLE : Encountering Distributional Pressure While Consolidating Above Prior Highs - 10/3/2013
View all notes |
Set NEW NOTE alert |
CANSLIM.net Company Profile |
SEC
News |
Chart |
Request a new note
C
A N
S L
I M
|
TNGO
-
NASDAQ
Tangoe Inc
COMPUTER SOFTWARE and SERVICES - Technical and System Software
|
$24.80
|
+1.03
4.33% |
$25.19
|
644,085
111.41% of 50 DAV
50 DAV is 578,100
|
$24.60
0.82%
|
9/12/2013
|
$21.30
|
PP = $23.15
|
|
MB = $24.31
|
Most Recent Note - 10/11/2013 6:20:14 PM
G - Color code is changed to green after rising beyond its "max buy"level and hitting a new 52-week high with today's 3rd consecutive gain, wedging higher without great volume conviction behind its gains.
>>> FEATURED STOCK ARTICLE : Gains Today Lacked Volume Conviction of Institutional Demand - 9/17/2013
View all notes |
Set NEW NOTE alert |
CANSLIM.net Company Profile |
SEC
News |
Chart |
Request a new note
C
A N
S L
I M
|
Symbol/Exchange
Company Name
Industry Group |
PRICE |
CHANGE
(%Change) |
Day High |
Volume
(% DAV)
(% 50 day avg vol) |
52 Wk Hi
% From Hi |
Featured
Date |
Price
Featured |
Pivot Featured |
|
Max Buy |
VRX
-
NYSE
Valeant Pharmaceuticals
DRUGS - Drug Manufacturers - Other
|
$109.43
|
-0.57
-0.52% |
$111.02
|
407,502
33.25% of 50 DAV
50 DAV is 1,225,500
|
$113.79
-3.83%
|
9/11/2013
|
$100.26
|
PP = $105.50
|
|
MB = $110.78
|
Most Recent Note - 10/10/2013 6:31:32 PM
Y- Found support above prior highs defining important support in the $105 area. See latest FSU analysis for more details and a new annotated graph.
>>> FEATURED STOCK ARTICLE : Found Support Above Prior Highs on Pullback - 10/10/2013
View all notes |
Set NEW NOTE alert |
CANSLIM.net Company Profile |
SEC
News |
Chart |
Request a new note
C
A N
S L
I M
|
YNDX
-
NASDAQ
Yandex N V Class A
INTERNET - Internet Information Providers
|
$38.33
|
-0.20
-0.52% |
$38.94
|
5,698,627
249.84% of 50 DAV
50 DAV is 2,280,900
|
$39.44
-2.81%
|
9/5/2013
|
$34.24
|
PP = $34.79
|
|
MB = $36.53
|
Most Recent Note - 10/11/2013 1:03:07 PM
G - Perched within close striking distance of its 52-week high. Found prompt support above prior highs in the $34 area and its 50 DMA line while dipping below its "max buy" level earlier this week.
>>> FEATURED STOCK ARTICLE : Gains Lacked Volume Conviction While Hitting New Highs - 9/18/2013
View all notes |
Set NEW NOTE alert |
CANSLIM.net Company Profile |
SEC
News |
Chart |
Request a new note
C
A N
S L
I M
|