You are not logged in.
This means you
CAN ONLY VIEW reports that were published prior to Monday, April 14, 2025.
You
MUST UPGRADE YOUR MEMBERSHIP if you want to see any current reports.
AFTER MARKET UPDATE - THURSDAY, OCTOBER 10TH, 2013
Previous After Market Report Next After Market Report >>>
|
|
|
|
DOW |
+323.09 |
15,126.07 |
+2.18% |
|
Volume |
738,025,740 |
+1% |
|
Volume |
1,830,241,320 |
-16% |
|
NASDAQ |
+82.97 |
3,760.75 |
+2.26% |
|
Advancers |
2,605 |
84% |
|
Advancers |
2,160 |
82% |
|
S&P 500 |
+36.16 |
1,692.56 |
+2.18% |
|
Decliners |
431 |
14% |
|
Decliners |
404 |
15% |
|
Russell 2000 |
+26.04 |
1,069.50 |
+2.50% |
|
52 Wk Highs |
113 |
|
|
52 Wk Highs |
96 |
|
|
S&P 600 |
+14.13 |
606.77 |
+2.38% |
|
52 Wk Lows |
25 |
|
|
52 Wk Lows |
13 |
|
|
 |
Market Indices Rebounded on Mixed Volume Totals
Kenneth J. Gruneisen - Passed the CAN SLIM® Master's Exam
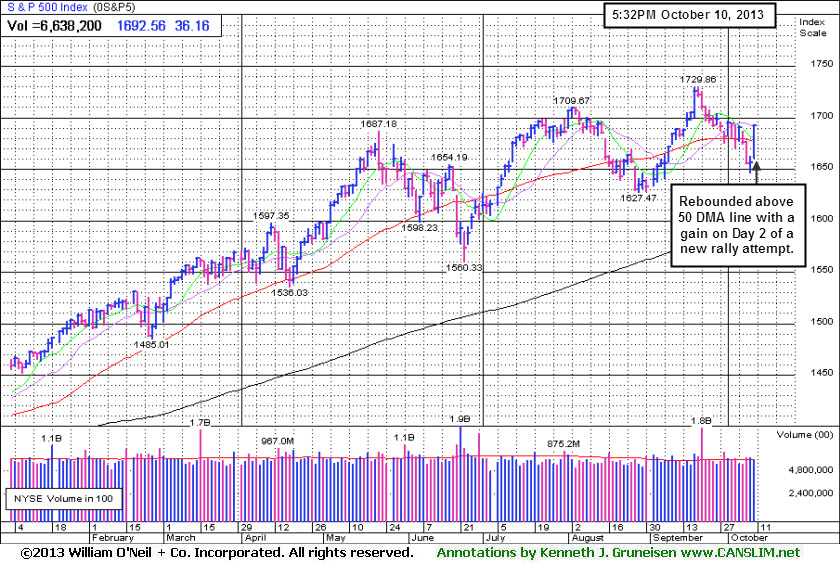
The markets extended their gains into the closing bell. The Dow Jones Industrial Average gained 323 points to 15,126, the S&P 500 Index added 36 points to 1,692 and the Nasdaq Composite Index advanced more than 82 points to close at 3,760. The volume totals were mixed, higher on the NYSE and lower on the Nasdaq exchange versus the prior session's volume totals. Breadth was positive as advancers led decliners by 6-1 on the NYSE and about 5-1 on the Nasdaq exchange. Leadership expanded as there were 37 high-ranked companies from the CANSLIM.net Leaders List that made new 52-week highs and appeared on the CANSLIM.net BreakOuts Page, up from 6 stocks on the prior session. The list of stocks hitting new 52-week highs outnumbered new lows on the NYSE and on the Nasdaq exchange both, an encouraging shift. There were gains for 20 of the 21 high-ranked companies currently included on the Featured Stocks Page, many of these individual issues rebounding with much larger percentage gains than seen by the broader market indices.
The major averages climbed throughout the session as concerns over the debt limit eased. Republican lawmakers announced an offer for a short-term increase to the debt limit in exchange for structured talks aimed at longer-term solutions.
All 10 sectors on the S&P ended higher, led by gains in financial stocks including Bank of America Corp (BAC +2.82%). On the earnings front, Safeway Inc (SWY +2.50%) rose following their quarterly report. On the downside, Ruby Tuesday Inc (RT -17.09%) fell after the company reported a wider-than-expected loss. In other news, luxury retailer Tiffany & Co. (TIF +1.99%) rose as the stock received an analyst's upgrade. In other news, Blackberry Ltd (BBRY +1.11%) rose on news that co-founder Mike Lazaridis increased his stake in the company.
Turning to fixed income markets, Treasuries were mixed along the curve. The benchmark 10-year note was down 3/16 of a point to yield 2.69% and the 30-year bond gained 3/32 to yield 3.74%.
The market (M criteria) remains in a "correction" based on the latest technical damage. Confirming follow-through gains are still needed for disciplined fact-based investors to change their stance back toward a buying mode. Individual holdings should be closely monitored for any worrisome technical sell signals. This is precisely how the fact-based system helps investors avoid serious setbacks and raise cash levels during market downdrafts. Historic studies suggest that no new buying efforts should be made during market corrections.
This is a good time to have your watchlist ready! The CANSLIM.net Featured Stocks Page shows the most action-worthy candidates and their latest notes and a new Headline Link directs members to the latest detailed analysis with data-packed graphs annotated by a Certified expert along with links to additional resources. The Premium Member Homepage - includes "dynamic archives" to all prior pay reports published. Watch for an announcement via email concerning the next WEBCAST.
PICTURED: The S&P 500 Index rebounded above its 50-day moving average (DMA) line on Day 2 of a new rally attempt.
|
 Kenneth J. Gruneisen started out as a licensed stockbroker in August 1987, a couple of months prior to the historic stock market crash that took the Dow Jones Industrial Average down -22.6% in a single day. He has published daily fact-based fundamental and technical analysis on high-ranked stocks online for two decades. Through FACTBASEDINVESTING.COM, Kenneth provides educational articles, news, market commentary, and other information regarding proven investment systems that work in good times and bad.
Comments contained in the body of this report are technical opinions only and are not necessarily those of Gruneisen Growth Corp. The material herein has been obtained from sources believed to be reliable and accurate, however, its accuracy and completeness cannot be guaranteed. Our firm, employees, and customers may effect transactions, including transactions contrary to any recommendation herein, or have positions in the securities mentioned herein or options with respect thereto. Any recommendation contained in this report may not be suitable for all investors and it is not to be deemed an offer or solicitation on our part with respect to the purchase or sale of any securities. |
|
 |
Retail, Financial, Healthcare, Energy, and Tech Sector Rose
Kenneth J. Gruneisen - Passed the CAN SLIM® Master's Exam
The Retail Index ($RLX +2.03%) and influential financial groups underpinned the major averages' gains as the Bank Index ($BKX +2.98%) and the Broker/Dealer Index ($XBD +2.58%) rallied for solid gains. The Biotechnology Index ($BTK +3.54%) l;ed the tech sector while the Internet Index ($IIX +2.61%), Semiconductor Index ($SOX +2.34%), and the Networking Index ($NWX +1.92%) rallied. The Oil Services Index ($OSX +2.29%) and the Integrated Oil Index ($XOI +1.74%) rose as energy-related shares spurted higher. The Healthcare Index ($HMO +2.59%) also posted a large gain while the Gold & Silver Index ($XAU -0.29%) edged lower and was a clear laggard.
Charts courtesy www.stockcharts.com
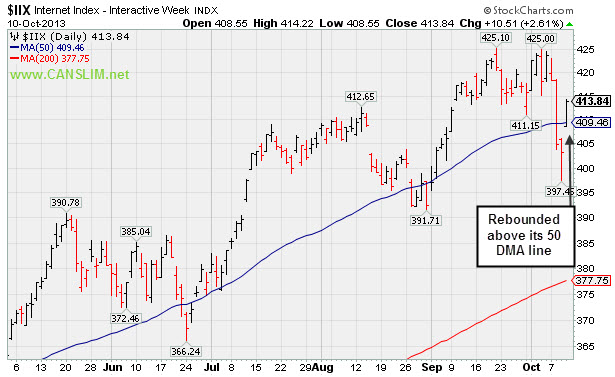
PICTURED: The Internet Index ($IIX +2.61%) rebounded above its 50-day moving average (DMA) line.
| Oil Services |
$OSX |
277.21 |
+6.20 |
+2.29% |
+25.91% |
| Healthcare |
$HMO |
3,560.59 |
+89.99 |
+2.59% |
+41.62% |
| Integrated Oil |
$XOI |
1,407.21 |
+24.05 |
+1.74% |
+13.32% |
| Semiconductor |
$SOX |
496.48 |
+11.37 |
+2.34% |
+29.27% |
| Networking |
$NWX |
299.62 |
+5.66 |
+1.92% |
+32.25% |
| Internet |
$IIX |
413.84 |
+10.51 |
+2.61% |
+26.56% |
| Broker/Dealer |
$XBD |
136.53 |
+3.43 |
+2.58% |
+44.73% |
| Retail |
$RLX |
839.37 |
+16.67 |
+2.03% |
+28.53% |
| Gold & Silver |
$XAU |
88.53 |
-0.26 |
-0.29% |
-46.54% |
| Bank |
$BKX |
63.30 |
+1.83 |
+2.98% |
+23.44% |
| Biotech |
$BTK |
2,092.98 |
+71.65 |
+3.54% |
+35.29% |
|
|
|
 |
Found Support Above Prior Highs on Pullback
Kenneth J. Gruneisen - Passed the CAN SLIM® Master's Exam
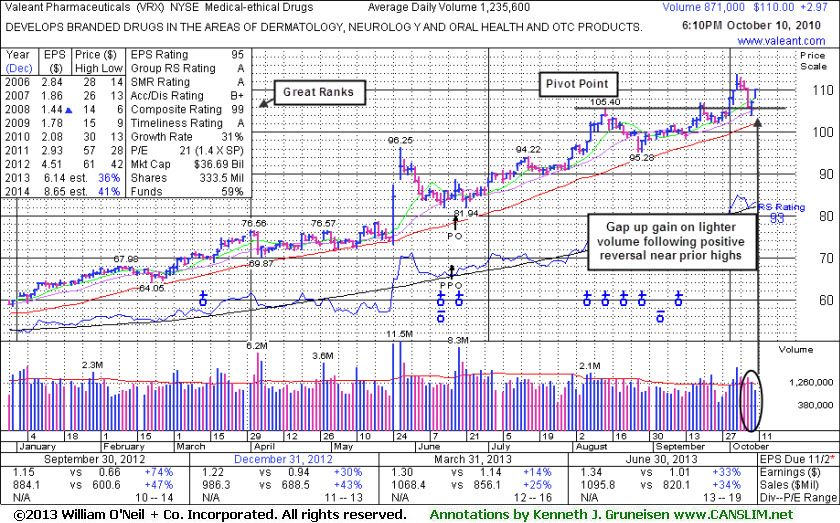
Valeant Pharmaceuticals International, Inc (VRX +$2.97 or +2.77% to $110.00) posted a gain on lighter volume today. On the prior session it managed a "positive reversal" after testing prior highs defining important support in the $105 area. It was last shown in this FSU section on 9/11/13 with an annotated graph under the headline, "Insider Buying While Forming New 'Late Stage' Base". A new pivot point was cited based on its 8/14/13 high plus 10 cents. Subsequent gains above the pivot point lacked great volume until it was already getting extended from the risker "late-stage" base, then it endured mild distributional pressure. Deterioration into the prior base would raise more serious concerns, and disciplined investors always should follow strict selling rules.
Recent insider buying (indicated by circles with plus signs above) while trading near its highs has been noted as an encouraging sign. It reported earnings +33% on +34% sales revenues for the Jun '13 quarter, above the +25% minimum earnings guideline (C criteria). Concerns had been raised by its Mar '13 earnings report with only a +14% earnings increase, below the +25% minimum guideline (C criteria) for buy candidates. A downturn in FY '07 and '08 earnings (A criteria) has been followed by a strong earnings rebound in recent years. Return On Equity is currently reported at 37%, well above the 17% minimum guideline of the fact-based system.
The number of top-rated funds owning its shares rose from 818 in Mar '12 in to 1,063 in Jun '13, a reassuring trend concerning the I criteria. Its current Up/Down Volume Ratio of 1.7 is an unbiased indication that its shares have been under accumulation over the past 50 days.
The high-ranked Medical - Ethical Drugs firm's shares spiked higher in late May at around the time of M&A news that it would buy Bausch & Lomb for $8.7 billion. That move and other recent acquisitions resulted in stronger earnings in the latest quarterly comparison.
It completed Public Offering on 6/18/13. The upshot of Public Offerings is that when completed the end result is typically an increase in the total number of institutional owners. Institutional owners are often supportive of their existing positions and will even accumulate more shares when they consolidate near classic support levels like the 50-day and 200-day moving average (DMA) lines, if they are still believers in the company. If too many become pessimistic and decide to unload, this is what ends up sending the stocks slicing through support.
Prior reports noted - "Investors are taught in the Certification to only buy stocks with a combination of both strong fundamentals and strong technical action, however stocks should be sold based on their technical action only. In this example, more bullish action rewarded patient investors still giving it the benefit of the doubt until any technical sell signals start adding up."
 |
|
|
Color Codes Explained :
Y - Better candidates highlighted by our
staff of experts.
G - Previously featured
in past reports as yellow but may no longer be buyable under the
guidelines.
***Last / Change / Volume data in this table is the closing quote data***
Symbol/Exchange
Company Name
Industry Group |
PRICE |
CHANGE
(%Change) |
Day High |
Volume
(% DAV)
(% 50 day avg vol) |
52 Wk Hi
% From Hi |
Featured
Date |
Price
Featured |
Pivot Featured |
|
Max Buy |
AVG
-
NYSE
A V G Technologies N.V.
INTERNET - Internet Software and Services
|
$23.88
|
-0.05
-0.21% |
$24.22
|
342,243
35.71% of 50 DAV
50 DAV is 958,400
|
$26.56
-10.08%
|
9/13/2013
|
$23.06
|
PP = $23.88
|
|
MB = $25.07
|
Most Recent Note - 10/10/2013 7:06:46 PM
Y - The prompt rebound above its 50 DMA line helped its outlook and its color code is changed to yellow. Rebounded above prior highs in the $23 area and its 50 DMA line with gains on lighter volume after triggering technical sell signals with volume-driven losses.
>>> FEATURED STOCK ARTICLE : Rallying Near Pivot Point With Greater Volume Conviction - 9/13/2013
View all notes |
Set NEW NOTE alert |
CANSLIM.net Company Profile |
SEC
News |
Chart |
Request a new note
C
A N
S L
I M


|
BITA
-
NYSE
Bitauto Hldgs Ltd Ads
INTERNET - Internet Information Providers
|
$20.24
|
+0.58
2.95% |
$20.47
|
431,608
70.62% of 50 DAV
50 DAV is 611,200
|
$22.67
-10.72%
|
9/24/2013
|
$16.40
|
PP = $17.31
|
|
MB = $18.18
|
Most Recent Note - 10/10/2013 7:10:05 PM
G - Finished in the red after a 2nd negative reversal in the past 3 sessions. Prior highs in the $18 area define initial support to watch on pullbacks.
>>> FEATURED STOCK ARTICLE : Volume-Driven Gains Cleared Latest Pivot Point - 10/2/2013
View all notes |
Set NEW NOTE alert |
CANSLIM.net Company Profile |
SEC
News |
Chart |
Request a new note
C
A N
S L
I M
|
BLOX
-
NYSE
Infoblox Inc
COMPUTER HARDWARE - Networking and Communication Dev
|
$44.00
|
+2.79
6.77% |
$44.79
|
1,052,445
154.34% of 50 DAV
50 DAV is 681,900
|
$45.50
-3.30%
|
10/11/2013
|
$43.02
|
PP = $45.60
|
|
MB = $47.88
|
 Most Recent Note - 10/11/2013 12:19:32 PM
Y - Consolidating within close striking distance of its 52-week high. Color code is changed to yellow while building on a flat base. Subsequent volume-driven gains for new highs may trigger a technical buy signal. Found support while consolidating in an orderly fashion above its 50 DMA line. Strong sales revenues and solid earnings increases in the Oct '12, Jan, Apr, and Jul '13 quarterly comparisons versus the year ago periods satisfy the C criteria. Up and down annual earnings (A criteria) prior to its 2012 IPO is a concern. Since completing a Secondary Offering on 10/04/12 it followed with choppy action and then an impressive rebound and rally.
 There are no Featured Stock Updates™ available for this stock at this time. You may request one by clicking the Request a New Note link below
View all notes |
Set NEW NOTE alert |
CANSLIM.net Company Profile |
SEC
News |
Chart |
Request a new note
C
A N
S L
I M
|
CELG
-
NASDAQ
Celgene Corp
DRUGS - Drug Manufacturers - Major
|
$153.37
|
+0.82
0.54% |
$154.78
|
1,480,581
57.65% of 50 DAV
50 DAV is 2,568,100
|
$157.95
-2.90%
|
9/12/2013
|
$149.50
|
PP = $150.02
|
|
MB = $157.52
|
Most Recent Note - 10/9/2013 12:24:47 PM
Y - Today's 3rd consecutive loss is testing important near-term support near its 50 DMA line ($145.17 now) and prior lows where violations may trigger technical sell signals.
>>> FEATURED STOCK ARTICLE : Volume-Driven Gain Challenging New Pivot Point - 9/20/2013
View all notes |
Set NEW NOTE alert |
CANSLIM.net Company Profile |
SEC
News |
Chart |
Request a new note
C
A N
S L
I M
|
EGBN
-
NASDAQ
Eagle Bancorp Inc
BANKING - Regional - Mid-Atlantic Banks
|
$28.96
|
+1.42
5.16% |
$29.00
|
20,472
29.46% of 50 DAV
50 DAV is 69,500
|
$28.78
0.63%
|
9/16/2013
|
$27.48
|
PP = $27.77
|
|
MB = $29.16
|
Most Recent Note - 10/10/2013 12:12:40 PM
Y - Consolidating near prior highs and above its 50 DMA line defining important support. Holding its ground stubbornly with volume totals cooling after a recent spurt of volume-driven gains.
>>> FEATURED STOCK ARTICLE : Finished Lower After "Negative Reversal" - 9/16/2013
View all notes |
Set NEW NOTE alert |
CANSLIM.net Company Profile |
SEC
News |
Chart |
Request a new note
C
A N
S L
I M
|
Symbol/Exchange
Company Name
Industry Group |
PRICE |
CHANGE
(%Change) |
Day High |
Volume
(% DAV)
(% 50 day avg vol) |
52 Wk Hi
% From Hi |
Featured
Date |
Price
Featured |
Pivot Featured |
|
Max Buy |
FLT
-
NYSE
Fleetcor Technologies
DIVERSIFIED SERVICES - Business/Management Services
|
$107.24
|
+0.16
0.15% |
$108.24
|
436,110
62.31% of 50 DAV
50 DAV is 699,900
|
$113.68
-5.67%
|
8/19/2013
|
$99.01
|
PP = $100.97
|
|
MB = $106.02
|
Most Recent Note - 10/10/2013 12:16:12 PM
G - Undercut its 50 DMA line on the prior session. Today's prompt rebound above that important short-term average is a sign of support that helps its outlook.
>>> FEATURED STOCK ARTICLE : Extended After 13 Weekly Gains in Span of 14 Weeks - 10/7/2013
View all notes |
Set NEW NOTE alert |
CANSLIM.net Company Profile |
SEC
News |
Chart |
Request a new note
C
A N
S L
I M
|
GNRC
-
NYSE
Generac Hldgs Inc
CONSUMER DURABLES - Electronic Equipment
|
$40.63
|
+0.20
0.49% |
$41.32
|
612,763
81.00% of 50 DAV
50 DAV is 756,500
|
$44.30
-8.28%
|
9/12/2013
|
$41.40
|
PP = $43.27
|
|
MB = $45.43
|
Most Recent Note - 10/8/2013 5:04:44 PM
G - Color code is changed to green after a considerable loss today on above average volume violated its 50 DMA line triggering a technical sell signal. Prior lows in $39 area define important near-term support. Disciplined investors limit losses by selling if any stock falls more than -7% from their purchase price.
>>> FEATURED STOCK ARTICLE : Pullback Following Friday's Technical Buy Signal - 9/23/2013
View all notes |
Set NEW NOTE alert |
CANSLIM.net Company Profile |
SEC
News |
Chart |
Request a new note
C
A N
S L
I M
|
JAZZ
-
NASDAQ
Jazz Pharmaceuticals Plc
DRUGS - Biotechnology
|
$83.60
|
-1.17
-1.38% |
$85.20
|
456,802
63.67% of 50 DAV
50 DAV is 717,400
|
$93.84
-10.91%
|
9/30/2013
|
$93.20
|
PP = $89.10
|
|
MB = $93.56
|
Most Recent Note - 10/8/2013 12:09:58 PM
G- Violated its 50 DMA line with a damaging loss on heavy volume today triggering a technical sell signal. Color code is changed to green. Disciplined investors limit losses if any stock falls more than -7% from their purchase price.
>>> FEATURED STOCK ARTICLE : Strong Finish With High Volume Indicative of Accumulation - 9/30/2013
View all notes |
Set NEW NOTE alert |
CANSLIM.net Company Profile |
SEC
News |
Chart |
Request a new note
C
A N
S L
I M
|
KORS
-
NYSE
Michael Kors Hldgs Ltd
RETAIL - Apparel Stores
|
$72.73
|
-1.50
-2.02% |
$74.60
|
1,771,775
53.20% of 50 DAV
50 DAV is 3,330,600
|
$78.62
-7.49%
|
8/6/2013
|
$69.66
|
PP = $66.28
|
|
MB = $69.59
|
Most Recent Note - 10/8/2013 5:15:40 PM
G - Violated its 50 DMA line with a damaging loss today triggering a technical sell signal. Prior highs in the $66 area define the next chart support area.
>>> FEATURED STOCK ARTICLE : Extended From Base After Additional Volume-Driven Gains - 9/27/2013
View all notes |
Set NEW NOTE alert |
CANSLIM.net Company Profile |
SEC
News |
Chart |
Request a new note
C
A N
S L
I M
|
LOPE
-
NASDAQ
Grand Canyon Education
DIVERSIFIED SERVICES - Education and; Training Services
|
$40.50
|
+0.13
0.32% |
$40.78
|
114,553
34.37% of 50 DAV
50 DAV is 333,300
|
$41.33
-2.01%
|
6/19/2013
|
$31.47
|
PP = $34.17
|
|
MB = $35.88
|
Most Recent Note - 10/10/2013 7:11:11 PM
G - Perched near all-time highs. Fundamental concerns remain while technical action has been reassuring.
>>> FEATURED STOCK ARTICLE : Perched Near All-Time High After Sub Par Quarterly Increase - 9/12/2013
View all notes |
Set NEW NOTE alert |
CANSLIM.net Company Profile |
SEC
News |
Chart |
Request a new note
C
A N
S L
I M
|
Symbol/Exchange
Company Name
Industry Group |
PRICE |
CHANGE
(%Change) |
Day High |
Volume
(% DAV)
(% 50 day avg vol) |
52 Wk Hi
% From Hi |
Featured
Date |
Price
Featured |
Pivot Featured |
|
Max Buy |
MRLN
-
NASDAQ
Marlin Business Services
DIVERSIFIED SERVICES - Rental and Leasing Services
|
$25.08
|
+1.32
5.56% |
$25.38
|
12,142
33.92% of 50 DAV
50 DAV is 35,800
|
$26.96
-6.97%
|
9/9/2013
|
$23.75
|
PP = $24.03
|
|
MB = $25.23
|
Most Recent Note - 10/8/2013 8:02:33 PM
G - Trading near its 50 DMA line. See the latest FSU analysis for more details and a new annotated graph.
>>> FEATURED STOCK ARTICLE : Faring Better Than Others While Testing 50-Day Average Line - 10/8/2013
View all notes |
Set NEW NOTE alert |
CANSLIM.net Company Profile |
SEC
News |
Chart |
Request a new note
C
A N
S L
I M
|
PCLN
-
NASDAQ
Priceline.Com Inc
INTERNET - Internet Software and Services
|
$1,016.58
|
+3.39
0.33% |
$1,028.35
|
538,955
85.25% of 50 DAV
50 DAV is 632,200
|
$1,074.89
-5.42%
|
9/13/2013
|
$966.82
|
PP = $995.08
|
|
MB = $1,044.83
|
Most Recent Note - 10/9/2013 12:43:47 PM
Y - Slumped under prior highs near $995 defining initial support to watch and tested support near its 50 DMA line today. Disciplined investors limit losses by selling if any stock falls more than -7% from their purchase price.
>>> FEATURED STOCK ARTICLE : Wedging to New Highs With Gains Lacking Volume Conviction - 9/19/2013
View all notes |
Set NEW NOTE alert |
CANSLIM.net Company Profile |
SEC
News |
Chart |
Request a new note
C
A N
S L
I M
|
PRAA
-
NASDAQ
Portfolio Recovery Assoc
DIVERSIFIED SERVICES - Business/Management Services
|
$59.16
|
+0.80
1.37% |
$59.75
|
257,983
52.88% of 50 DAV
50 DAV is 487,900
|
$61.60
-3.96%
|
7/31/2013
|
$51.43
|
PP = $54.72
|
|
MB = $57.46
|
Most Recent Note - 10/7/2013 6:33:42 PM
G - Down today for a 4th consecutive small loss on light volume. Pulling back from its 52-week high after gains on light volume, wedging higher and getting extended from its prior base.
>>> FEATURED STOCK ARTICLE : Wedging to New Highs With Gains Lacking Volume Conviction - 9/26/2013
View all notes |
Set NEW NOTE alert |
CANSLIM.net Company Profile |
SEC
News |
Chart |
Request a new note
C
A N
S L
I M
|
PRLB
-
NYSE
Proto Labs Inc
MANUFACTURING - Small Tools and Accessories
|
$76.50
|
+1.81
2.42% |
$77.25
|
153,686
37.11% of 50 DAV
50 DAV is 414,100
|
$80.91
-5.45%
|
7/29/2013
|
$64.86
|
PP = $67.50
|
|
MB = $70.88
|
Most Recent Note - 10/10/2013 7:08:17 PM
G - Posted a gain on lighter volume today. Found prompt support at its 50 DMA line. More damaging losses would raise greater concerns.
>>> FEATURED STOCK ARTICLE : Extended Following Additional Volume-Driven Gains - 9/25/2013
View all notes |
Set NEW NOTE alert |
CANSLIM.net Company Profile |
SEC
News |
Chart |
Request a new note
C
A N
S L
I M
|
SFUN
-
NYSE
Soufun Hldgs Ltd Ads A
INTERNET - Internet Information Providers
|
$51.26
|
-0.64
-1.23% |
$52.59
|
1,172,049
93.44% of 50 DAV
50 DAV is 1,254,400
|
$53.77
-4.67%
|
7/16/2013
|
$29.54
|
PP = $27.90
|
|
MB = $29.30
|
Most Recent Note - 10/10/2013 6:41:00 PM
G - Rallied from its 50 DMA line for a 2nd consecutive solid gain. Subsequent violations of the 50 DMA line and recent lows may trigger technical sell signals.
>>> FEATURED STOCK ARTICLE : Following Great Rally No New Base Has Been Formed - 10/1/2013
View all notes |
Set NEW NOTE alert |
CANSLIM.net Company Profile |
SEC
News |
Chart |
Request a new note
C
A N
S L
I M
|
Symbol/Exchange
Company Name
Industry Group |
PRICE |
CHANGE
(%Change) |
Day High |
Volume
(% DAV)
(% 50 day avg vol) |
52 Wk Hi
% From Hi |
Featured
Date |
Price
Featured |
Pivot Featured |
|
Max Buy |
SSNC
-
NASDAQ
S S & C Technologies
COMPUTER SOFTWARE and SERVICES - Application Software
|
$36.67
|
+0.42
1.16% |
$36.86
|
133,557
30.09% of 50 DAV
50 DAV is 443,800
|
$39.94
-8.19%
|
9/5/2013
|
$36.01
|
PP = $38.90
|
|
MB = $40.85
|
Most Recent Note - 10/8/2013 12:48:50 PM
G - Color code is changed to green while deteriorating and violating its 50 DMA line with today's loss on higher volume triggering a technical sell signal. Completed a Secondary Offering on 9/20/13 while perched at all-time highs.
>>> FEATURED STOCK ARTICLE : Finding Support Near 50-Day Average After Secondary Offering - 10/4/2013
View all notes |
Set NEW NOTE alert |
CANSLIM.net Company Profile |
SEC
News |
Chart |
Request a new note
C
A N
S L
I M
|
SSYS
-
NASDAQ
Stratasys Ltd
COMPUTER HARDWARE - Computer Peripherals
|
$100.53
|
+1.29
1.30% |
$101.48
|
671,281
58.46% of 50 DAV
50 DAV is 1,148,300
|
$113.49
-11.42%
|
7/8/2013
|
$91.44
|
PP = $95.00
|
|
MB = $99.75
|
Most Recent Note - 10/10/2013 7:03:39 PM
G - Rebounded near its 50 DMA line with today's considerable volume-driven gain. That short-term average line may now act as a resistance level.
>>> FEATURED STOCK ARTICLE : Faltering and Relative Strength Waning After Offering - 10/9/2013
View all notes |
Set NEW NOTE alert |
CANSLIM.net Company Profile |
SEC
News |
Chart |
Request a new note
C
A N
S L
I M
|
STMP
-
NASDAQ
Stamps.Com Inc
INTERNET - Internet Software and Services
|
$43.42
|
+1.31
3.11% |
$43.63
|
55,915
48.50% of 50 DAV
50 DAV is 115,300
|
$46.80
-7.21%
|
9/24/2013
|
$45.54
|
PP = $46.57
|
|
MB = $48.90
|
Most Recent Note - 10/8/2013 12:51:19 PM
G - Color code is changed to green while violating its 50 DMA line today triggering a worrisome technical sell signal.
>>> FEATURED STOCK ARTICLE : Forming New Set-Up After 50-Day Average Acted as Support - 9/24/2013
View all notes |
Set NEW NOTE alert |
CANSLIM.net Company Profile |
SEC
News |
Chart |
Request a new note
C
A N
S L
I M
|
TBBK
-
NASDAQ
Bancorp Inc
BANKING - Regional - Mid-Atlantic Banks
|
$18.58
|
+0.17
0.92% |
$18.81
|
141,415
80.12% of 50 DAV
50 DAV is 176,500
|
$18.61
-0.16%
|
9/4/2013
|
$16.26
|
PP = $16.79
|
|
MB = $17.63
|
Most Recent Note - 10/8/2013 12:52:00 PM
Y - Consolidating above prior highs and its 50 DMA line defining important support to watch on pullbacks.
>>> FEATURED STOCK ARTICLE : Encountering Distributional Pressure While Consolidating Above Prior Highs - 10/3/2013
View all notes |
Set NEW NOTE alert |
CANSLIM.net Company Profile |
SEC
News |
Chart |
Request a new note
C
A N
S L
I M
|
TNGO
-
NASDAQ
Tangoe Inc
COMPUTER SOFTWARE and SERVICES - Technical and System Software
|
$24.97
|
+1.20
5.05% |
$25.01
|
379,066
65.57% of 50 DAV
50 DAV is 578,100
|
$24.60
1.51%
|
9/12/2013
|
$21.30
|
PP = $23.15
|
|
MB = $24.31
|
Most Recent Note - 10/8/2013 5:19:55 PM
Y - Down again today with above average volume, encountering distributional pressure. Convincing volume-driven gains above its pivot point cited based on its May 2012 high plus 10 cents may signal the beginning of a substantial leg higher.
>>> FEATURED STOCK ARTICLE : Gains Today Lacked Volume Conviction of Institutional Demand - 9/17/2013
View all notes |
Set NEW NOTE alert |
CANSLIM.net Company Profile |
SEC
News |
Chart |
Request a new note
C
A N
S L
I M
|
Symbol/Exchange
Company Name
Industry Group |
PRICE |
CHANGE
(%Change) |
Day High |
Volume
(% DAV)
(% 50 day avg vol) |
52 Wk Hi
% From Hi |
Featured
Date |
Price
Featured |
Pivot Featured |
|
Max Buy |
VRX
-
NYSE
Valeant Pharmaceuticals
DRUGS - Drug Manufacturers - Other
|
$109.35
|
-0.65
-0.59% |
$111.02
|
284,922
23.25% of 50 DAV
50 DAV is 1,225,500
|
$113.79
-3.90%
|
9/11/2013
|
$100.26
|
PP = $105.50
|
|
MB = $110.78
|
Most Recent Note - 10/10/2013 6:31:32 PM
Y- Found support above prior highs defining important support in the $105 area. See latest FSU analysis for more details and a new annotated graph.
>>> FEATURED STOCK ARTICLE : Found Support Above Prior Highs on Pullback - 10/10/2013
View all notes |
Set NEW NOTE alert |
CANSLIM.net Company Profile |
SEC
News |
Chart |
Request a new note
C
A N
S L
I M
|
YNDX
-
NASDAQ
Yandex N V Class A
INTERNET - Internet Information Providers
|
$38.63
|
+0.10
0.26% |
$38.94
|
4,625,049
202.77% of 50 DAV
50 DAV is 2,280,900
|
$39.44
-2.05%
|
9/5/2013
|
$34.24
|
PP = $34.79
|
|
MB = $36.53
|
Most Recent Note - 10/11/2013 1:03:07 PM
G - Perched within close striking distance of its 52-week high. Found prompt support above prior highs in the $34 area and its 50 DMA line while dipping below its "max buy" level earlier this week.
>>> FEATURED STOCK ARTICLE : Gains Lacked Volume Conviction While Hitting New Highs - 9/18/2013
View all notes |
Set NEW NOTE alert |
CANSLIM.net Company Profile |
SEC
News |
Chart |
Request a new note
C
A N
S L
I M
|
|
|
|
THESE ARE NOT BUY RECOMMENDATIONS!
Comments contained in the body of this report are technical
opinions only. The material herein has been obtained
from sources believed to be reliable and accurate, however,
its accuracy and completeness cannot be guaranteed.
This site is not an investment advisor, hence it does
not endorse or recommend any securities or other investments.
Any recommendation contained in this report may not
be suitable for all investors and it is not to be deemed
an offer or solicitation on our part with respect to
the purchase or sale of any securities. All trademarks,
service marks and trade names appearing in this report
are the property of their respective owners, and are
likewise used for identification purposes only.
This report is a service available
only to active Paid Premium Members.
You may opt-out of receiving report notifications
at any time. Questions or comments may be submitted
by writing to Premium Membership Services 665 S.E. 10 Street, Suite 201 Deerfield Beach, FL 33441-5634 or by calling 1-800-965-8307
or 954-785-1121.
|
|
|

