***Last / Change / Volume data in this table is the closing quote data***
Symbol/Exchange
Company Name
Industry Group |
PRICE |
CHANGE
(%Change) |
Day High |
Volume
(% DAV)
(% 50 day avg vol) |
52 Wk Hi
% From Hi |
Featured
Date |
Price
Featured |
Pivot Featured |
|
Max Buy |
AVG
-
NYSE
A V G Technologies N.V.
INTERNET - Internet Software and Services
|
$22.63
|
+0.33
1.48% |
$22.86
|
594,270
61.90% of 50 DAV
50 DAV is 960,100
|
$26.56
-14.78%
|
9/13/2013
|
$23.06
|
PP = $23.88
|
|
MB = $25.07
|
Most Recent Note - 10/8/2013 12:53:50 PM
G - Color code is changed to green while slumping below prior highs in the $23 area and violating its 50 DMA line triggering technical sell signals. Only a prompt rebound above that important short-term average would help its outlook.
>>> FEATURED STOCK ARTICLE : Rallying Near Pivot Point With Greater Volume Conviction - 9/13/2013
View all notes |
Set NEW NOTE alert |
CANSLIM.net Company Profile |
SEC
News |
Chart |
Request a new note
C
A N
S L
I M


|
BITA
-
NYSE
Bitauto Hldgs Ltd Ads
INTERNET - Internet Information Providers
|
$20.42
|
+1.29
6.74% |
$21.00
|
1,027,780
179.12% of 50 DAV
50 DAV is 573,800
|
$22.67
-9.92%
|
9/24/2013
|
$16.40
|
PP = $17.31
|
|
MB = $18.18
|
 Most Recent Note - 10/9/2013 6:23:49 PM
G - Posted a solid gain today with above average volume. Prior highs in the $18 area define define initial support to watch on pullbacks.
>>> FEATURED STOCK ARTICLE : Volume-Driven Gains Cleared Latest Pivot Point - 10/2/2013
View all notes |
Set NEW NOTE alert |
CANSLIM.net Company Profile |
SEC
News |
Chart |
Request a new note
C
A N
S L
I M
|
CELG
-
NASDAQ
Celgene Corp
DRUGS - Drug Manufacturers - Major
|
$146.87
|
-1.66
-1.12% |
$150.32
|
5,363,220
212.80% of 50 DAV
50 DAV is 2,520,300
|
$157.95
-7.01%
|
9/12/2013
|
$149.50
|
PP = $150.02
|
|
MB = $157.52
|
Most Recent Note - 10/9/2013 12:24:47 PM
Y - Today's 3rd consecutive loss is testing important near-term support near its 50 DMA line ($145.17 now) and prior lows where violations may trigger technical sell signals.
>>> FEATURED STOCK ARTICLE : Volume-Driven Gain Challenging New Pivot Point - 9/20/2013
View all notes |
Set NEW NOTE alert |
CANSLIM.net Company Profile |
SEC
News |
Chart |
Request a new note
C
A N
S L
I M
|
EGBN
-
NASDAQ
Eagle Bancorp Inc
BANKING - Regional - Mid-Atlantic Banks
|
$27.23
|
+0.05
0.18% |
$27.68
|
59,314
86.21% of 50 DAV
50 DAV is 68,800
|
$28.78
-5.39%
|
9/16/2013
|
$27.48
|
PP = $27.77
|
|
MB = $29.16
|
Most Recent Note - 10/8/2013 5:17:39 PM
Y - Consolidating above prior highs and above its 50 DMA line, still holding its ground stubbornly after a recent spurt of volume-driven gains.
>>> FEATURED STOCK ARTICLE : Finished Lower After "Negative Reversal" - 9/16/2013
View all notes |
Set NEW NOTE alert |
CANSLIM.net Company Profile |
SEC
News |
Chart |
Request a new note
C
A N
S L
I M
|
FLT
-
NYSE
Fleetcor Technologies
DIVERSIFIED SERVICES - Business/Management Services
|
$103.09
|
-1.48
-1.42% |
$104.70
|
1,281,303
187.27% of 50 DAV
50 DAV is 684,200
|
$113.68
-9.32%
|
8/19/2013
|
$99.01
|
PP = $100.97
|
|
MB = $106.02
|
Most Recent Note - 10/9/2013 12:30:52 PM
G - Undercut its 50 DMA line today then rebounded near that important short-term average. Only a prompt rebound above the 50 DMA line would help its outlook.
>>> FEATURED STOCK ARTICLE : Extended After 13 Weekly Gains in Span of 14 Weeks - 10/7/2013
View all notes |
Set NEW NOTE alert |
CANSLIM.net Company Profile |
SEC
News |
Chart |
Request a new note
C
A N
S L
I M
|
Symbol/Exchange
Company Name
Industry Group |
PRICE |
CHANGE
(%Change) |
Day High |
Volume
(% DAV)
(% 50 day avg vol) |
52 Wk Hi
% From Hi |
Featured
Date |
Price
Featured |
Pivot Featured |
|
Max Buy |
GNRC
-
NYSE
Generac Hldgs Inc
CONSUMER DURABLES - Electronic Equipment
|
$39.12
|
-1.14
-2.83% |
$40.28
|
732,877
91.40% of 50 DAV
50 DAV is 801,800
|
$44.30
-11.69%
|
9/12/2013
|
$41.40
|
PP = $43.27
|
|
MB = $45.43
|
Most Recent Note - 10/8/2013 5:04:44 PM
G - Color code is changed to green after a considerable loss today on above average volume violated its 50 DMA line triggering a technical sell signal. Prior lows in $39 area define important near-term support. Disciplined investors limit losses by selling if any stock falls more than -7% from their purchase price.
>>> FEATURED STOCK ARTICLE : Pullback Following Friday's Technical Buy Signal - 9/23/2013
View all notes |
Set NEW NOTE alert |
CANSLIM.net Company Profile |
SEC
News |
Chart |
Request a new note
C
A N
S L
I M
|
JAZZ
-
NASDAQ
Jazz Pharmaceuticals Plc
DRUGS - Biotechnology
|
$84.28
|
+0.50
0.60% |
$85.26
|
1,410,728
201.42% of 50 DAV
50 DAV is 700,400
|
$93.84
-10.19%
|
9/30/2013
|
$93.20
|
PP = $89.10
|
|
MB = $93.56
|
Most Recent Note - 10/8/2013 12:09:58 PM
G- Violated its 50 DMA line with a damaging loss on heavy volume today triggering a technical sell signal. Color code is changed to green. Disciplined investors limit losses if any stock falls more than -7% from their purchase price.
>>> FEATURED STOCK ARTICLE : Strong Finish With High Volume Indicative of Accumulation - 9/30/2013
View all notes |
Set NEW NOTE alert |
CANSLIM.net Company Profile |
SEC
News |
Chart |
Request a new note
C
A N
S L
I M
|
KORS
-
NYSE
Michael Kors Hldgs Ltd
RETAIL - Apparel Stores
|
$72.49
|
+1.57
2.21% |
$72.96
|
3,688,735
109.52% of 50 DAV
50 DAV is 3,368,200
|
$78.62
-7.80%
|
8/6/2013
|
$69.66
|
PP = $66.28
|
|
MB = $69.59
|
Most Recent Note - 10/8/2013 5:15:40 PM
G - Violated its 50 DMA line with a damaging loss today triggering a technical sell signal. Prior highs in the $66 area define the next chart support area.
>>> FEATURED STOCK ARTICLE : Extended From Base After Additional Volume-Driven Gains - 9/27/2013
View all notes |
Set NEW NOTE alert |
CANSLIM.net Company Profile |
SEC
News |
Chart |
Request a new note
C
A N
S L
I M
|
LOPE
-
NASDAQ
Grand Canyon Education
DIVERSIFIED SERVICES - Education and; Training Services
|
$39.07
|
+0.02
0.05% |
$39.38
|
324,904
87.39% of 50 DAV
50 DAV is 371,800
|
$41.33
-5.47%
|
6/19/2013
|
$31.47
|
PP = $34.17
|
|
MB = $35.88
|
Most Recent Note - 10/3/2013 5:53:22 PM
G - Pulling back from new all-time high with small losses on light or average volume. Fundamental concerns remain while technical action has been reassuring.
>>> FEATURED STOCK ARTICLE : Perched Near All-Time High After Sub Par Quarterly Increase - 9/12/2013
View all notes |
Set NEW NOTE alert |
CANSLIM.net Company Profile |
SEC
News |
Chart |
Request a new note
C
A N
S L
I M
|
MRLN
-
NASDAQ
Marlin Business Services
DIVERSIFIED SERVICES - Rental and Leasing Services
|
$23.28
|
-0.32
-1.36% |
$24.02
|
20,856
57.93% of 50 DAV
50 DAV is 36,000
|
$26.96
-13.65%
|
9/9/2013
|
$23.75
|
PP = $24.03
|
|
MB = $25.23
|
Most Recent Note - 10/8/2013 8:02:33 PM
G - Trading near its 50 DMA line. See the latest FSU analysis for more details and a new annotated graph.
>>> FEATURED STOCK ARTICLE : Faring Better Than Others While Testing 50-Day Average Line - 10/8/2013
View all notes |
Set NEW NOTE alert |
CANSLIM.net Company Profile |
SEC
News |
Chart |
Request a new note
C
A N
S L
I M
|
Symbol/Exchange
Company Name
Industry Group |
PRICE |
CHANGE
(%Change) |
Day High |
Volume
(% DAV)
(% 50 day avg vol) |
52 Wk Hi
% From Hi |
Featured
Date |
Price
Featured |
Pivot Featured |
|
Max Buy |
PCLN
-
NASDAQ
Priceline.Com Inc
INTERNET - Internet Software and Services
|
$989.03
|
-9.10
-0.91% |
$1,001.83
|
1,054,308
170.38% of 50 DAV
50 DAV is 618,800
|
$1,074.89
-7.99%
|
9/13/2013
|
$966.82
|
PP = $995.08
|
|
MB = $1,044.83
|
Most Recent Note - 10/9/2013 12:43:47 PM
Y - Slumped under prior highs near $995 defining initial support to watch and tested support near its 50 DMA line today. Disciplined investors limit losses by selling if any stock falls more than -7% from their purchase price.
>>> FEATURED STOCK ARTICLE : Wedging to New Highs With Gains Lacking Volume Conviction - 9/19/2013
View all notes |
Set NEW NOTE alert |
CANSLIM.net Company Profile |
SEC
News |
Chart |
Request a new note
C
A N
S L
I M
|
PRAA
-
NASDAQ
Portfolio Recovery Assoc
DIVERSIFIED SERVICES - Business/Management Services
|
$56.79
|
+0.06
0.11% |
$57.45
|
399,066
77.29% of 50 DAV
50 DAV is 516,300
|
$61.60
-7.81%
|
7/31/2013
|
$51.43
|
PP = $54.72
|
|
MB = $57.46
|
Most Recent Note - 10/7/2013 6:33:42 PM
G - Down today for a 4th consecutive small loss on light volume. Pulling back from its 52-week high after gains on light volume, wedging higher and getting extended from its prior base.
>>> FEATURED STOCK ARTICLE : Wedging to New Highs With Gains Lacking Volume Conviction - 9/26/2013
View all notes |
Set NEW NOTE alert |
CANSLIM.net Company Profile |
SEC
News |
Chart |
Request a new note
C
A N
S L
I M
|
PRLB
-
NYSE
Proto Labs Inc
MANUFACTURING - Small Tools and Accessories
|
$71.50
|
-1.48
-2.03% |
$74.11
|
614,199
147.11% of 50 DAV
50 DAV is 417,500
|
$80.91
-11.63%
|
7/29/2013
|
$64.86
|
PP = $67.50
|
|
MB = $70.88
|
Most Recent Note - 10/8/2013 5:08:31 PM
G - Pulled back considerably on above average volume today testing important support at its 50 DMA line.
>>> FEATURED STOCK ARTICLE : Extended Following Additional Volume-Driven Gains - 9/25/2013
View all notes |
Set NEW NOTE alert |
CANSLIM.net Company Profile |
SEC
News |
Chart |
Request a new note
C
A N
S L
I M
|
SFUN
-
NYSE
Soufun Hldgs Ltd Ads A
INTERNET - Internet Information Providers
|
$47.92
|
+3.30
7.40% |
$48.59
|
2,208,529
184.27% of 50 DAV
50 DAV is 1,198,500
|
$53.77
-10.88%
|
7/16/2013
|
$29.54
|
PP = $27.90
|
|
MB = $29.30
|
Most Recent Note - 10/9/2013 6:25:55 PM
G - Rallied from its 50 DMA line with a solid volume-driven gain today. Violations of the 50 DMA line and recent lows may trigger technical sell signals.
>>> FEATURED STOCK ARTICLE : Following Great Rally No New Base Has Been Formed - 10/1/2013
View all notes |
Set NEW NOTE alert |
CANSLIM.net Company Profile |
SEC
News |
Chart |
Request a new note
C
A N
S L
I M
|
SSNC
-
NASDAQ
S S & C Technologies
COMPUTER SOFTWARE and SERVICES - Application Software
|
$34.94
|
+0.01
0.03% |
$35.40
|
319,510
72.78% of 50 DAV
50 DAV is 439,000
|
$39.94
-12.52%
|
9/5/2013
|
$36.01
|
PP = $38.90
|
|
MB = $40.85
|
Most Recent Note - 10/8/2013 12:48:50 PM
G - Color code is changed to green while deteriorating and violating its 50 DMA line with today's loss on higher volume triggering a technical sell signal. Completed a Secondary Offering on 9/20/13 while perched at all-time highs.
>>> FEATURED STOCK ARTICLE : Finding Support Near 50-Day Average After Secondary Offering - 10/4/2013
View all notes |
Set NEW NOTE alert |
CANSLIM.net Company Profile |
SEC
News |
Chart |
Request a new note
C
A N
S L
I M
|
Symbol/Exchange
Company Name
Industry Group |
PRICE |
CHANGE
(%Change) |
Day High |
Volume
(% DAV)
(% 50 day avg vol) |
52 Wk Hi
% From Hi |
Featured
Date |
Price
Featured |
Pivot Featured |
|
Max Buy |
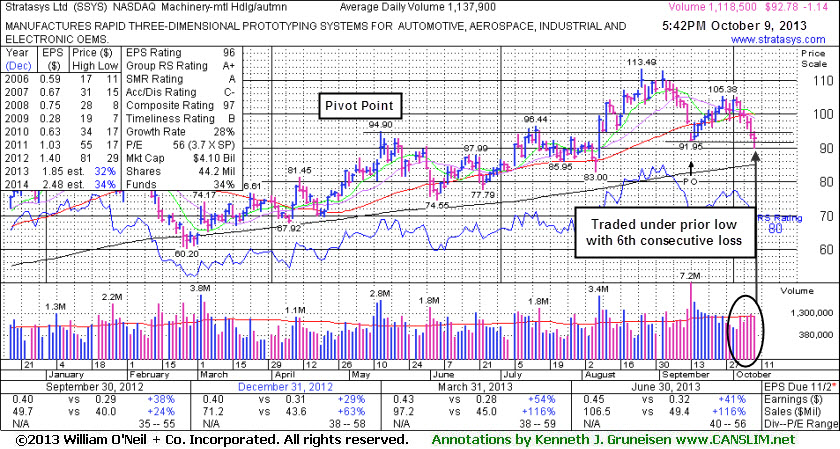
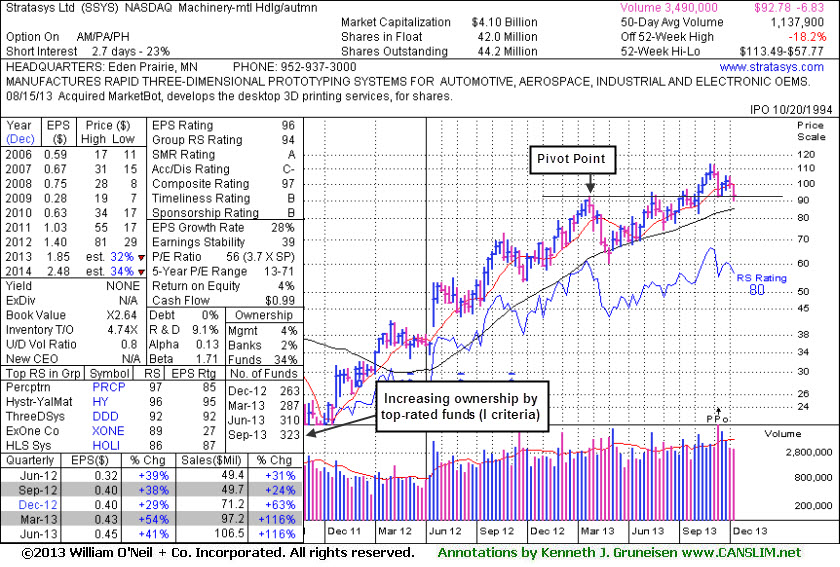
SSYS
-
NASDAQ
Stratasys Ltd
COMPUTER HARDWARE - Computer Peripherals
|
$92.78
|
-1.14
-1.21% |
$94.96
|
1,118,539
98.30% of 50 DAV
50 DAV is 1,137,900
|
$113.49
-18.25%
|
7/8/2013
|
$91.44
|
PP = $95.00
|
|
MB = $99.75
|
Most Recent Note - 10/9/2013 6:20:16 PM
G - Slumped further below its 50 DMA line and undercut prior lows defining the next near-term support. See the latest FSU analysis for more details and a new annotated graph.
>>> FEATURED STOCK ARTICLE : Faltering and Relative Strength Waning After Offering - 10/9/2013
View all notes |
Set NEW NOTE alert |
CANSLIM.net Company Profile |
SEC
News |
Chart |
Request a new note
C
A N
S L
I M
|
STMP
-
NASDAQ
Stamps.Com Inc
INTERNET - Internet Software and Services
|
$41.16
|
+0.87
2.16% |
$41.62
|
73,740
60.84% of 50 DAV
50 DAV is 121,200
|
$46.80
-12.04%
|
9/24/2013
|
$45.54
|
PP = $46.57
|
|
MB = $48.90
|
Most Recent Note - 10/8/2013 12:51:19 PM
G - Color code is changed to green while violating its 50 DMA line today triggering a worrisome technical sell signal.
>>> FEATURED STOCK ARTICLE : Forming New Set-Up After 50-Day Average Acted as Support - 9/24/2013
View all notes |
Set NEW NOTE alert |
CANSLIM.net Company Profile |
SEC
News |
Chart |
Request a new note
C
A N
S L
I M
|
TBBK
-
NASDAQ
Bancorp Inc
BANKING - Regional - Mid-Atlantic Banks
|
$17.84
|
+0.40
2.29% |
$17.91
|
169,972
95.92% of 50 DAV
50 DAV is 177,200
|
$18.61
-4.14%
|
9/4/2013
|
$16.26
|
PP = $16.79
|
|
MB = $17.63
|
Most Recent Note - 10/8/2013 12:52:00 PM
Y - Consolidating above prior highs and its 50 DMA line defining important support to watch on pullbacks.
>>> FEATURED STOCK ARTICLE : Encountering Distributional Pressure While Consolidating Above Prior Highs - 10/3/2013
View all notes |
Set NEW NOTE alert |
CANSLIM.net Company Profile |
SEC
News |
Chart |
Request a new note
C
A N
S L
I M
|
TNGO
-
NASDAQ
Tangoe Inc
COMPUTER SOFTWARE and SERVICES - Technical and System Software
|
$23.20
|
+0.18
0.78% |
$23.41
|
547,852
95.61% of 50 DAV
50 DAV is 573,000
|
$24.60
-5.68%
|
9/12/2013
|
$21.30
|
PP = $23.15
|
|
MB = $24.31
|
Most Recent Note - 10/8/2013 5:19:55 PM
Y - Down again today with above average volume, encountering distributional pressure. Convincing volume-driven gains above its pivot point cited based on its May 2012 high plus 10 cents may signal the beginning of a substantial leg higher.
>>> FEATURED STOCK ARTICLE : Gains Today Lacked Volume Conviction of Institutional Demand - 9/17/2013
View all notes |
Set NEW NOTE alert |
CANSLIM.net Company Profile |
SEC
News |
Chart |
Request a new note
C
A N
S L
I M
|
VRX
-
NYSE
Valeant Pharmaceuticals
DRUGS - Drug Manufacturers - Other
|
$107.03
|
+1.11
1.05% |
$107.36
|
1,307,795
106.38% of 50 DAV
50 DAV is 1,229,400
|
$113.79
-5.94%
|
9/11/2013
|
$100.26
|
PP = $105.50
|
|
MB = $110.78
|
Most Recent Note - 10/8/2013 5:43:42 PM
Y- Color code is changed to yellow after ending near the session low with a large loss with above average volume, slumping toward prior highs defining important support in the $105 area.
>>> FEATURED STOCK ARTICLE : Insider Buying While Forming New "Late Stage" Base - 9/11/2013
View all notes |
Set NEW NOTE alert |
CANSLIM.net Company Profile |
SEC
News |
Chart |
Request a new note
C
A N
S L
I M
|
Symbol/Exchange
Company Name
Industry Group |
PRICE |
CHANGE
(%Change) |
Day High |
Volume
(% DAV)
(% 50 day avg vol) |
52 Wk Hi
% From Hi |
Featured
Date |
Price
Featured |
Pivot Featured |
|
Max Buy |
YNDX
-
NASDAQ
Yandex N V Class A
INTERNET - Internet Information Providers
|
$36.16
|
+0.62
1.74% |
$36.88
|
3,990,078
175.79% of 50 DAV
50 DAV is 2,269,800
|
$39.44
-8.32%
|
9/5/2013
|
$34.24
|
PP = $34.79
|
|
MB = $36.53
|
Most Recent Note - 10/8/2013 5:09:45 PM
G - Down considerably today with above average volume, sinking to prior highs in the $34 area and its 50 DMA line defining important support to watch.
>>> FEATURED STOCK ARTICLE : Gains Lacked Volume Conviction While Hitting New Highs - 9/18/2013
View all notes |
Set NEW NOTE alert |
CANSLIM.net Company Profile |
SEC
News |
Chart |
Request a new note
C
A N
S L
I M
|