You are not logged in.
This means you
CAN ONLY VIEW reports that were published prior to Monday, April 14, 2025.
You
MUST UPGRADE YOUR MEMBERSHIP if you want to see any current reports.
AFTER MARKET UPDATE - FRIDAY, OCTOBER 9TH, 2009
Previous After Market Report Next After Market Report >>>
|
|
|
|
DOW |
+78.07 |
9,864.94 |
+0.80% |
|
Volume |
989,914,170 |
-23% |
|
Volume |
1,975,387,890 |
-19% |
|
NASDAQ |
+15.35 |
2,139.28 |
+0.72% |
|
Advancers |
1,806 |
58% |
|
Advancers |
1,832 |
64% |
|
S&P 500 |
+6.01 |
1,071.49 |
+0.56% |
|
Decliners |
1,187 |
38% |
|
Decliners |
934 |
32% |
|
Russell 2000 |
+7.17 |
614.92 |
+1.18% |
|
52 Wk Highs |
283 |
|
|
52 Wk Highs |
138 |
|
|
S&P 600 |
+3.85 |
323.35 |
+1.21% |
|
52 Wk Lows |
6 |
|
|
52 Wk Lows |
7 |
|
|
 |
Dow Marks 2009 High Close on 2-Year Anniversary Of Historic High
Adam Sarhan, Contributing Writer,
The major averages bounced off support this week as the bulls showed up and quelled the latest round of selling pressure. Volume was reported lighter, revealing no great buying conviction or further distribution from the institutional crowd. Advancers led decliners by a 3-to-2 ratio on the NYSE and by a 2-to-1 ratio on the Nasdaq exchange. There were 46 high-ranked companies from the CANSLIM.net Leaders List that made a new 52-week high and appeared on the CANSLIM.net BreakOuts Page, down from the 57 issues that appeared on the prior session. New 52-week highs were in the triple digits, substantially outnumbering new 52-week lows, the later of which were in the single digits on both major exchanges. The recent expansion in the new highs list is another encouraging sign of healthier market action, as any sustainable market rally requires a healthy crop of strong leaders.
The major averages bounced off their respective 50-day moving average (DMA) lines on Monday after the dollar fell and the Institute for Supply Management(ISM) released a strong service index. The ISM released its gauge of non-manufacturing businesses (a.k.a. service index) which was stronger than expected and the first month of "positive growth" in a year. The index rose to 50.9, which was slightly above the boom/bust line of 50 and higher than the 48.4 reading expected on Wall Street.
On Tuesday, the market continued to rally as speculation spread that third quarter earnings will top estimates. Overnight, the Australian Central Bank surprised the world and raised their overnight cash rate target to 3.25% from a 49-year low of 3%. The Australian Central Bank was one of the first major central banks to raise rates after the coordinated global stimulus package was passed last year. The Australian Central bank said that they are raising rates to help offset the possibility of inflation as the economic recovery continues. Another negative data point for the greenback was that several world governments reportedly met to discuss the notion of replacing the dollar as the primary means to trade crude oil. The group mulled a notion to use a basket of currencies to replace the dollar. Both events put significant pressure on the dollar which in turn sent stocks and a slew of commodities higher. After Tuesday's close, Alcoa (AA -0.77%) officially kicked off the third quarter earnings season when they reported a Q3 profit of $77 million.
On Wednesday, stocks ended mixed as gold surged to a new all-time high, and earnings season officially began. Analysts believe that this earnings season will mark the ninth consecutive quarterly decline in corporate profits as the economy begins showing signs of a recovery. Now that earnings season has officially begun, it is imperative to watch how your stocks react to their Q3 results.
On Thursday, housing stocks caught a bid after Treasury Secretary Timothy Geithner said the housing market is improving and House Speaker Nancy Pelosi said Congress will consider extending a tax-credit for home buyers. The government reported that first-time jobless claims fell to 521,000 last week, which was the lowest level since January and lower than the Street's estimate of 540,000 claims. Stocks advanced after retail sales rose for the first time in 13 months as discounts continued to attract shoppers. Retail Metrics released a report that showed sales at US chains open at least a year rose +1.1% last month and nearly seventy percent of retailers reported sales results that exceeded the average of estimates it has compiled. The US dollar fell again, which sparked a rally in commodities and helped send gold to another new all-time high.
Stocks rallied on Friday even as the dollar advanced, which is considered "consolidating" after its recent decline. In a surprise move, President Obama was awarded the Nobel Peace Prize. The White House staff said it was a "total surprise" and claimed they were unaware of the nomination. The market rally remains in full swing as the bulls showed up and defended support during the first week of October. As long as the major averages continue trading above support (respective 50 DMA lines and 7-month upward trendlines) the bulls deserve the bullish benefit of the doubt.
PICTURED: The Dow Jones Industrial Average ended near its session high and finished at a fresh 2009 high close while marking the 2-year anniversary of its all-time high close (14,164). The blue chip index is still -30% off its historic high.
Does Your "Expert" Portfolio Manager Have You Over-Diversified And Under-Performing?
In recent weeks we have heard from a number of investors who were frustrated to see their accounts over diversified and under performing at the hands of investment managers claiming to make their moves based on this fact-based system. To find out more about working directly with full service professionals doing it the right way, simply fill out this form and we will contact you to discuss a specific course of action that suits you best (CLICK HERE) *Accounts over $250,000 please, and serious inquiries only.
|
|
|
 |
Financial Group Shows Influential Strength
Kenneth J. Gruneisen - Passed the CAN SLIM® Master's Exam
The Healthcare Index ($HMO +4.31%) remains well below its 50-day moving average, but it was a standout gainer on Friday. Other defensive areas failed to keep pace, as the Oil Services Index ($OSX -0.93%) and Gold & Silver Index ($XAU -0.47%) edged lower and the Integrated Oil Index ($XOI +0.06%) basically held its ground. The major averages were helped into producing gains by a slightly positive bias shown in the influential financial groups as the Bank Index ($BKX +1.00%) and Broker/Dealer Index ($XBD +0.85%) proved their resilience and leadership. The Semiconductor Index ($SOX +3.28%) led the tech sector higher, followed by more modest gains form the Biotechnology Index ($BTK +1.43%) and Networking Index ($NWX +1.49%). Meanwhile, the Internet Index ($IIX +0.54%) lagged, as did the Retail Index ($RLX +0.25%).
Charts courtesy www.stockcharts.com
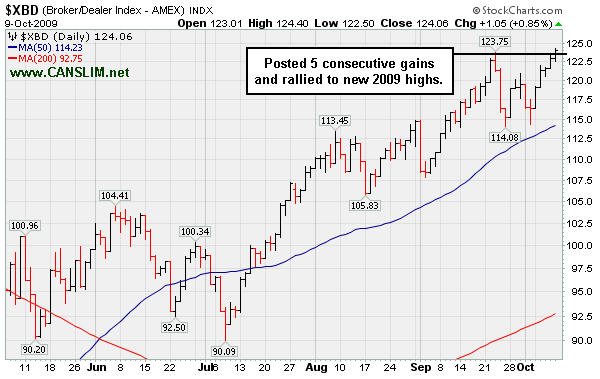
PICTURED: The Broker/Dealer Index ($XBD +0.85%) posted 5 consecutive gains and rallied to new 2009 highs, which bodes well for the current market rally (the M criteria). Many firms in this industry group have endured huge losses in the past year or more which hurts their annual earnings histories (A criteria), making the stocks not meet all of the investment system guidelines. However, the ongoing strength of the financial group serves as a very important leading indicator concerning the overall market outlook.
| Oil Services |
$OSX |
199.51 |
-1.87 |
-0.93% |
+64.35% |
| Healthcare |
$HMO |
1,171.57 |
+48.40 |
+4.31% |
+22.02% |
| Integrated Oil |
$XOI |
1,054.36 |
+0.65 |
+0.06% |
+7.62% |
| Semiconductor |
$SOX |
326.44 |
+10.38 |
+3.28% |
+53.86% |
| Networking |
$NWX |
238.26 |
+3.49 |
+1.49% |
+65.58% |
| Internet |
$IIX |
220.87 |
+1.18 |
+0.54% |
+65.11% |
| Broker/Dealer |
$XBD |
124.06 |
+1.05 |
+0.85% |
+60.14% |
| Retail |
$RLX |
387.82 |
+0.96 |
+0.25% |
+38.87% |
| Gold & Silver |
$XAU |
176.38 |
-0.84 |
-0.47% |
+42.41% |
| Bank |
$BKX |
47.43 |
+0.47 |
+1.00% |
+7.02% |
| Biotech |
$BTK |
914.06 |
+12.87 |
+1.43% |
+41.24% |
|
|
|
 |
Weakness Prompts Removal From Featured Stocks List After 80% Gain In 6 Months
Kenneth J. Gruneisen - Passed the CAN SLIM® Master's Exam
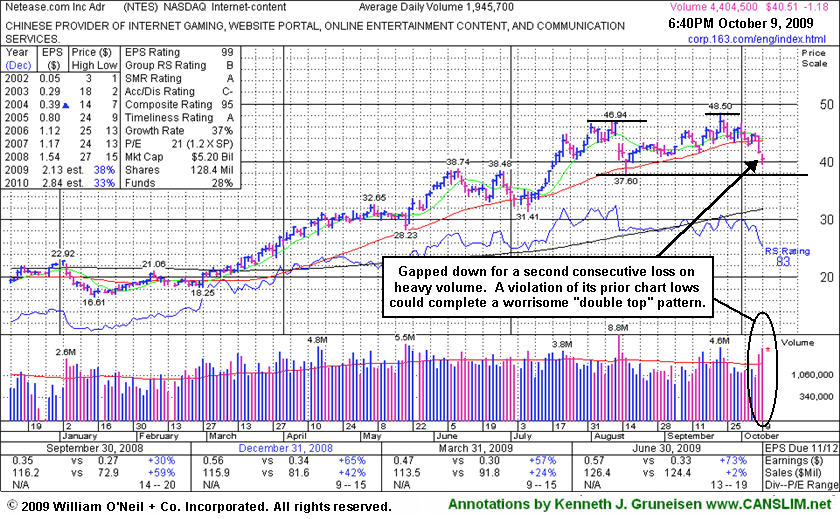
Netease.com Inc (NTES -$1.18 or -2.91% to $40.51) gapped down today, falling hard for a second day in a row with more than twice average volume, a clear sign of distributional pressure. Based on weak technical action it will be dropped from the Featured Stocks list tonight. The high-ranked Internet - Content firm traded up more than +80% following its appearance at $26.85 in the April 2009 issue of the monthly newsletter, CANSLIM.net News (read here). On 10/08/09 it triggered a technical sell signal with its loss on above average volume that more decisively violated its 50 DMA line and the upward trendline connecting its July-September chart lows. After encountering heavy distributional pressure in August, NTES had made an admirable stand above its 50 DMA line and prior chart highs in the $38 area. Now, any subsequent deterioration under its August lows could complete a worrisome "double top" pattern which would have additional bearish implications. Its color code was changed to green on 9/30/09 based on having promptly negating its latest breakout and then trading more than -7% below its pivot point.
Its last appearance in this FSU section under the headline, "Encountered Prompt Resistance When Rising From Late-Stage Base", included an annotated graph showing it falling toward important support at its upward trendline and its 50-day moving average (DMA) line where it was said "violations would raise concerns and trigger sell signals." Since then it technically broke down and it has failed to produce gains with anything other than light volume behind them. Now it would need to promptly rebound above its short-term average for its outlook to improve and possibly return to the Featured Stocks list.
|
|
|
Color Codes Explained :
Y - Better candidates highlighted by our
staff of experts.
G - Previously featured
in past reports as yellow but may no longer be buyable under the
guidelines.
***Last / Change / Volume quote data in this table corresponds with the timestamp on the note***
Symbol/Exchange
Company Name
Industry Group |
Last |
Chg. |
Vol
% DAV |
Date Featured |
Price Featured |
Latest Pivot Point
Featured |
Status |
| Latest Max Buy Price |
ARO
- NYSE
Aeropostale Inc
RETAIL - Apparel Stores
|
$42.45
|
-0.32
|
3,572,350
133% DAV
2,690,600
|
8/21/2009
(Date
Featured) |
$39.21
(Price
Featured) |
PP = $38.84 |
Y |
| MB = $40.78 |
Most Recent Note - 10/9/2009 4:31:55 PM
Y - Gapped down today for a second consecutive loss with above average volume, trading below its "max buy" level and near its 50 DMA line intra-day before rebounding to close near the session high. It actually posted a weekly gain, despite encountering distributional pressure, and this high-ranked leader in the Retail - Clothing/shoe group is still trading only -5% from its all-time highs. Color code is changed to yellow, with it permissible under the guidelines to accumulate shares from the first successful test of support at its short-term average line up to as much as 5% above its latest chart highs. Important support to watch is at its 50 DMA line, where a violation would raise concerns and trigger a technical sell signal. The next key chart support level is prior highs in the $38 area. It was featured in yellow in the 8/21/09 Mid-Day BreakOuts Report (read here).
>>> The latest Featured Stock Update with an annotated graph appeared on 10/6/2009. click here.
|
|
C
A
S
I |
News |
Chart |
SEC
View all notes Alert
me of new notes
Company
Profile
|
ARST
-
|
$22.77
|
+0.06
|
431,262
66% DAV
649,000
|
9/1/2009
(Date
Featured) |
$19.91
(Price
Featured) |
PP = $20.90 |
G |
| MB = $21.95 |
Most Recent Note - 10/9/2009 4:35:22 PM
G - Quietly consolidating in a very tight trading range with volume generally drying up since its powerful 9/04/09 breakout. As previously noted, "Recent lows may be considered an initial support level. Prior chart highs and its 50 DMA line, coinciding in the $20 area, define an important technical support level to watch on pullbacks."
>>> The latest Featured Stock Update with an annotated graph appeared on 10/2/2009. click here.
|
|
C
A
S
I |
News |
Chart |
SEC
View all notes Alert
me of new notes
Company
Profile
|
BIDU
- NASDAQ
Baidu Inc Ads
INTERNET - Internet Information Providers
|
$427.07
|
+14.40
|
2,691,279
159% DAV
1,693,000
|
9/8/2009
(Date
Featured) |
$351.80
(Price
Featured) |
PP = $368.59 |
G |
| MB = $387.02 |
Most Recent Note - 10/9/2009 4:38:27 PM
G - Gapped up today and posted a 3rd gain with well above average volume in the past 4 sessions, hitting new 2009 highs and challenging its 2007 all-time high of $429. Recently found prompt support after consolidating near its prior chart highs and pivot point, meanwhile staying well above its 50 DMA line. BIDU was featured in yellow in the 9/08/09 Mid-Day BreakOuts Report (read here).
>>> The latest Featured Stock Update with an annotated graph appeared on 10/7/2009. click here.
|
|
C
A
S
I |
News |
Chart |
SEC
View all notes Alert
me of new notes
Company
Profile
|
CACC
- NASDAQ
Credit Acceptance Corp
FINANCIAL SERVICES - Credit Services
|
$35.30
|
+0.08
|
45,281
102% DAV
44,500
|
9/29/2009
(Date
Featured) |
$33.48
(Price
Featured) |
PP = $32.60 |
G |
| MB = $34.23 |
Most Recent Note - 10/9/2009 4:43:33 PM
G - Quietly held its gains after rallying to new all-time highs earlier in the week with above average volume lifting it above its "max buy" level. Color code was changed to green as it got extended from its prior base. The Finance - Consumer/Commercial Loans firm has maintained a great track record of annual and quarterly sales revenues and earnings increases. It was featured on 9/29/09 in yellow in the mid-day report (read here).
>>> The latest Featured Stock Update with an annotated graph appeared on 9/29/2009. click here.
|
|
C
A
S
I |
News |
Chart |
SEC
View all notes Alert
me of new notes
Company
Profile
|
CRM
- NYSE
Salesforce.com Inc
INTERNET - Internet Software & Services
|
$60.97
|
+0.61
|
1,155,839
55% DAV
2,117,900
|
8/16/2009
(Date
Featured) |
$47.12
(Price
Featured) |
PP = $45.59 |
G |
| MB = $47.87 |
Most Recent Note - 10/9/2009 4:51:14 PM
G - Rallied to a new 2009 highs this week after a pullback tested support at prior highs in the $55 area. It is extended from any sound base. Technical support to watch now is an upward trendline connecting its July, August and October chart lows, a line which comes into play above additional support at its 50 DMA line.
>>> The latest Featured Stock Update with an annotated graph appeared on 10/5/2009. click here.
|
|
C
A
S
I |
News |
Chart |
SEC
View all notes Alert
me of new notes
Company
Profile
|
EBIX
- NASDAQ
Ebix Inc
COMPUTER SOFTWARE & SERVICES - Business Software & Services
|
$58.31
|
+1.60
|
156,672
86% DAV
182,300
|
8/28/2009
(Date
Featured) |
$45.86
(Price
Featured) |
PP = $45.35 |
G |
| MB = $47.62 |
Most Recent Note - 10/9/2009 5:00:16 PM
G - Hit a new all-time high today with a gain on lighter volume marking its 9th gain in 10 sessions. It is extended from any sound base, well above support at its 50 DMA line. It is also more than +80% above its 200 DMA line, which is a reminder to be watchful for sell signals, rather than chasing it and making reckless buys without a new base forming.
>>> The latest Featured Stock Update with an annotated graph appeared on 9/24/2009. click here.
|
|
C
A
S
I |
News |
Chart |
SEC
View all notes Alert
me of new notes
Company
Profile
|
GMCR
- NASDAQ
Green Mtn Coffee Roastrs
FOOD & BEVERAGE - Processed & Packaged Goods
|
$73.43
|
+0.83
|
570,360
39% DAV
1,467,100
|
10/5/2009
(Date
Featured) |
$71.11
(Price
Featured) |
PP = $75.89 |
Y |
| MB = $79.68 |
Most Recent Note - 10/9/2009 5:21:34 PM
Y - Posted a 5th consecutive gain on light volume today. Stellar ranks, but it has clearly stalled since its big gain on 9/28/09 with heavy volume. Its 9/29/09 high, before a negative reversal, is the basis for the latest pivot point noted as a "cup-with-high-handle pattern" since 10/05/09. Earlier notes discussed minor flaws in its base which resembled a cup-with-handle. Disciplined investors will watch for volume-driven gains to trigger a new technical buy signal before making any initial buys or add-on purchases.
>>> The latest Featured Stock Update with an annotated graph appeared on 9/23/2009. click here.
|
|
C
A
S
I |
News |
Chart |
SEC
View all notes Alert
me of new notes
Company
Profile
|
NTES
- NASDAQ
Netease Inc Adr
INTERNET - Internet Information Providers
|
$40.51
|
-1.18
|
4,411,526
N/A
|
9/23/2009
(Date
Featured) |
$47.11
(Price
Featured) |
PP = $47.04 |
|
| MB = $49.39 |
Most Recent Note - 10/9/2009
Gapped down today, falling on more than twice average volume. Based on weak technical action it will be dropped from the Featured Stocks list tonight. On 10/08/09 it triggered a technical sell signal with its loss on above average volume that more decisively violated its 50 DMA line and the upward trendline connecting its July-September chart lows. Subsequent deterioration under its August lows could complete a worrisome "double top" pattern which would have additional bearish implications. Color code was changed to green based on promptly negating its latest breakout and then trading more than -7% below its pivot point.
>>> The latest Featured Stock Update with an annotated graph appeared on 10/9/2009. click here.
|
|
C
A
S
I |
News |
Chart |
SEC
View all notes Alert
me of new notes
Company
Profile
|
NVEC
- NASDAQ
N V E Corp
ELECTRONICS - Semiconductor - Specialized
|
$52.72
|
+1.72
|
41,715
50% DAV
83,000
|
8/26/2009
(Date
Featured) |
$55.32
(Price
Featured) |
PP = $57.60 |
G |
| MB = $60.48 |
Most Recent Note - 10/9/2009 5:46:37 PM
G - Concerns increase the longer it struggles below its 50 DMA line. That short-term average is now downward sloping and has acted as a resistance level while it has been consolidating. Prior chart lows in the $49 area are an important support level now, and further deterioration may completely negate its 7/23/09 breakaway gap and raise more serious concerns (especially if on heavy volume) and trigger worrisome technical sell signals.
>>> The latest Featured Stock Update with an annotated graph appeared on 9/30/2009. click here.
|
|
C
A
S
I |
News |
Chart |
SEC
View all notes Alert
me of new notes
Company
Profile
|
PEGA
- NASDAQ
Pegasystems Inc
COMPUTER SOFTWARE & SERVICES - Business Software & Services
|
$34.93
|
+0.52
|
120,328
31% DAV
385,200
|
9/9/2009
(Date
Featured) |
$31.14
(Price
Featured) |
PP = $33.35 |
Y |
| MB = $35.02 |
Most Recent Note - 10/9/2009 5:48:24 PM
Y - Posted a 5th consecutive gain on light volume today and matched its best close ever. This high-ranked Computer Software - Financial firm gapped down on 10/02/09 and traded under its 50 DMA line, then found prompt support, however the pullback raised concerns as it violated an upward trendline connecting its July-September chart lows, an initial support level.
>>> The latest Featured Stock Update with an annotated graph appeared on 10/8/2009. click here.
|
|
C
A
S
I |
News |
Chart |
SEC
View all notes Alert
me of new notes
Company
Profile
|
SWI
- NYSE
Solarwinds Inc
COMPUTER SOFTWARE & SERVICES - Application Software
|
$22.44
|
+0.73
|
196,537
41% DAV
477,000
|
9/30/2029
(Date
Featured) |
$22.03
(Price
Featured) |
PP = $21.72 |
Y |
| MB = $22.81 |
Most Recent Note - 10/9/2009 5:52:48 PM
Y - A gain for the week on light volume helped it rally up from important support at its 50 DMA line after briefly and quietly consolidating under its last pivot point. It was featured in the October 2009 issue of CANSLIM.net News (read here).
>>> The latest Featured Stock Update with an annotated graph appeared on 9/30/2009. click here.
|
|
C
A
S
I |
News |
Chart |
SEC
View all notes Alert
me of new notes
Company
Profile
|
WNS
- NYSE
W N S Holdings Ltd Ads
DIVERSIFIED SERVICES - Business/Management Services
|
$14.98
|
-0.44
|
112,392
209% DAV
53,800
|
9/28/2009
(Date
Featured) |
$15.28
(Price
Featured) |
PP = $16.10 |
Y |
| MB = $16.91 |
Most Recent Note - 10/9/2009 5:55:44 PM
Y - Down on more than 2 times average volume today, closing near its 50 DMA line. It has encountered stubborn resistance and distributional pressure since its considerable 9/29/09 gain for a new 52-week high and new high close with volume 11 times its daily average volume. It formed an orderly flat base for at least 5-weeks, and it was featured in yellow in the 9/28/09 mid-day report (read here). Quarterly earnings have been above the +25% guideline and its annual earnings history has been great, satisfying the C & A criteria. However, sales revenues growth has decelerated.
>>> The latest Featured Stock Update with an annotated graph appeared on 9/28/2009. click here.
|
|
C
A
S
I |
News |
Chart |
SEC
View all notes Alert
me of new notes
Company
Profile
|
|
 |
| Subscriber Questions: |
October 8, 2009 |
Ken,
I have a question as a new subscriber. In the status column and notes, what does the G green and Y yellow designate?
Tom |
| Ken's Response: |
October 9, 2009 |
Tom,
First, I would like to thank you, congratulate you, and welcome you to CANSLIM.net! I wish you much success!
Interestingly enough, the day before you activated your new membership, I discussed the color codes again in the Featured Stock Update section coverage on Baidu.com (BIDU) in the After Market Update published on October 7, 2009 (read here). Its latest pullback raised some concerns which were noted, while its color code was changed to yellow on 10/01/09 and remained so in its 10/02/09 and 10/05/09 report appearances. The color code is not a recommendation, and it does not work like a traffic light! It is an indication that a Featured Stock is considered by CANSLIM.net's investment system experts to be among the "better buy candidates" if yellow, or "no longer buyable under the guidelines" if green. When you use the "view all notes" links to review prior analysis on any given stock, the Y or G designations at the front of the notes allow members (even those who may be colorblind or using odd color settings on their web browser or computer monitor) to quickly determine what shape that Featured Stock was in at the time the note was entered. Once a stock is noted and dropped from the Featured Stocks list it is no longer color coded, unless it meets the criteria and is featured again later. In its previous FSU appearance we described extensive prior coverage BIDU has received (read here).

Kenneth J. Gruneisen
Founder & Contributing Writer for CANSLIM.net
www.canslim.net |
|
|
|
THESE ARE NOT BUY RECOMMENDATIONS!
Comments contained in the body of this report are technical
opinions only. The material herein has been obtained
from sources believed to be reliable and accurate, however,
its accuracy and completeness cannot be guaranteed.
This site is not an investment advisor, hence it does
not endorse or recommend any securities or other investments.
Any recommendation contained in this report may not
be suitable for all investors and it is not to be deemed
an offer or solicitation on our part with respect to
the purchase or sale of any securities. All trademarks,
service marks and trade names appearing in this report
are the property of their respective owners, and are
likewise used for identification purposes only.
This report is a service available
only to active Paid Premium Members.
You may opt-out of receiving report notifications
at any time. Questions or comments may be submitted
by writing to Premium Membership Services 665 S.E. 10 Street, Suite 201 Deerfield Beach, FL 33441-5634 or by calling 1-800-965-8307
or 954-785-1121.
|
|
|


