***Last / Change / Volume data in this table is the closing quote data***
Symbol/Exchange
Company Name
Industry Group |
PRICE |
CHANGE
(%Change) |
Day High |
Volume
(% DAV)
(% 50 day avg vol) |
52 Wk Hi
% From Hi |
Featured
Date |
Price
Featured |
Pivot Featured |
|
Max Buy |
ALXN
-
NASDAQ
Alexion Pharmaceuticals
DRUGS - Drug Manufacturers - Other
|
$115.24
|
-2.91
-2.46% |
$118.08
|
941,339
90.52% of 50 DAV
50 DAV is 1,039,900
|
$119.54
-3.60%
|
8/23/2012
|
$103.70
|
PP = $110.06
|
|
MB = $115.56
|
 Most Recent Note - 10/8/2012 3:56:23 PM
G - Pulled back near its "max buy" level with today's loss on light volume. The prior highs in the $110 area define chart support along with its 50 DMA line.
>>> The latest Featured Stock Update with an annotated graph appeared on 9/26/2012. Click here.
View all notes |
Alert me of new notes |
CANSLIM.net Company Profile |
SEC |
Zacks Reports |
StockTalk |
News |
Chart |
Request a new note
C
A N
S L
I M


|
ASPS
-
NASDAQ
Altisource Ptf Sltns Sa
REAL ESTATE - Property Management/Developmen
|
$111.79
|
+0.35
0.31% |
$113.43
|
188,847
111.35% of 50 DAV
50 DAV is 169,600
|
$115.73
-3.40%
|
9/24/2012
|
$87.24
|
PP = $92.39
|
|
MB = $97.01
|
Most Recent Note - 10/5/2012 12:02:01 PM
G - Pulling back today after getting very extended from its prior base. Prior highs in the $92 area define initial support to watch on pullbacks.
>>> The latest Featured Stock Update with an annotated graph appeared on 9/11/2012. Click here.
View all notes |
Alert me of new notes |
CANSLIM.net Company Profile |
SEC |
Zacks Reports |
StockTalk |
News |
Chart |
Request a new note
C
A N
S L
I M
|
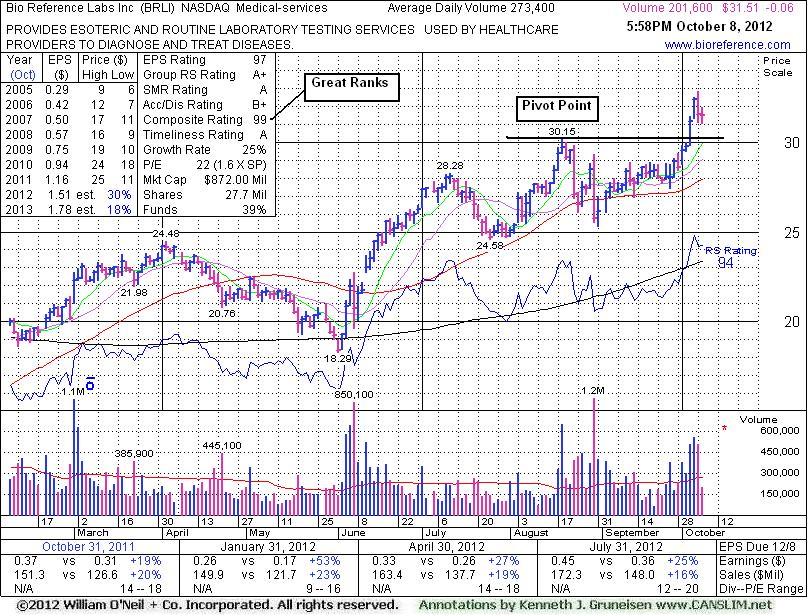
BRLI
-
NASDAQ
Bio Reference Labs Inc
HEALTH SERVICES - Medical Laboratories and Researc
|
$31.51
|
-0.06
-0.19% |
$31.94
|
201,643
73.75% of 50 DAV
50 DAV is 273,400
|
$32.86
-4.11%
|
10/3/2012
|
$30.90
|
PP = $30.25
|
|
MB = $31.76
|
Most Recent Note - 10/8/2012 6:13:38 PM
G - Consolidating above its "max buy" level today after triggering a technical buy signal on 10/03/12 with a considerable volume-driven gain above its pivot point. See the latest FSU analysis for more details and a new annotated graph.
>>> The latest Featured Stock Update with an annotated graph appeared on 10/8/2012. Click here.
View all notes |
Alert me of new notes |
CANSLIM.net Company Profile |
SEC |
Zacks Reports |
StockTalk |
News |
Chart |
Request a new note
C
A N
S L
I M
|
CFNL
-
NASDAQ
Cardinal Financial Corp
BANKING - Regional - Southeast Banks
|
$14.28
|
-0.02
-0.14% |
$14.34
|
45,562
59.79% of 50 DAV
50 DAV is 76,200
|
$14.79
-3.45%
|
8/17/2012
|
$12.84
|
PP = $13.31
|
|
MB = $13.98
|
Most Recent Note - 10/3/2012 1:12:17 PM
G - Retreating from its 52-week high today with a damaging volume-driven loss. Distributional pressure is raising concerns while pulling back. Prior highs and 50 DMA line define important support to watch on pullbacks near the $13 level where violations would trigger technical sell signals.
>>> The latest Featured Stock Update with an annotated graph appeared on 9/25/2012. Click here.
View all notes |
Alert me of new notes |
CANSLIM.net Company Profile |
SEC |
Zacks Reports |
StockTalk |
News |
Chart |
Request a new note
C
A N
S L
I M
|
CMCSA
-
NASDAQ
Comcast Corp Cl A
MEDIA - CATV Systems
|
$36.21
|
-0.33
-0.90% |
$36.47
|
10,218,912
81.49% of 50 DAV
50 DAV is 12,539,500
|
$36.98
-2.08%
|
6/11/2012
|
$29.94
|
PP = $30.98
|
|
MB = $32.53
|
Most Recent Note - 10/2/2012 5:03:06 PM
G - Consolidating above prior highs in the $35 area defining support to watch above its 50 DMA line where violations would trigger technical sell signals. Fundamental concerns have been repeatedly noted - "due to sub par sales and earnings growth in the Jun '12 quarter."
>>> The latest Featured Stock Update with an annotated graph appeared on 9/21/2012. Click here.
View all notes |
Alert me of new notes |
CANSLIM.net Company Profile |
SEC |
Zacks Reports |
StockTalk |
News |
Chart |
Request a new note
C
A N
S L
I M
|
Symbol/Exchange
Company Name
Industry Group |
PRICE |
CHANGE
(%Change) |
Day High |
Volume
(% DAV)
(% 50 day avg vol) |
52 Wk Hi
% From Hi |
Featured
Date |
Price
Featured |
Pivot Featured |
|
Max Buy |
DVA
-
NYSE
Davita Inc
HEALTH SERVICES - Specialized Health Services
|
$108.41
|
+0.02
0.02% |
$108.51
|
557,429
74.10% of 50 DAV
50 DAV is 752,300
|
$109.31
-0.82%
|
9/5/2012
|
$102.92
|
PP = $100.62
|
|
MB = $105.65
|
Most Recent Note - 10/3/2012 1:31:59 PM
G - Gain today without great volume conviction helped it hit a new 52-week high above its "max buy" level and its color code is changed to green. Prior highs near $100 and its 50 DMA line define near term support to watch on pullbacks where violations may trigger technical sell signals.
>>> The latest Featured Stock Update with an annotated graph appeared on 9/5/2012. Click here.
View all notes |
Alert me of new notes |
CANSLIM.net Company Profile |
SEC |
Zacks Reports |
StockTalk |
News |
Chart |
Request a new note
C
A N
S L
I M
|
ECPG
-
NASDAQ
Encore Capital Group Inc
FINANCIAL SERVICES - Credit Services
|
$27.92
|
-0.33
-1.17% |
$28.12
|
34,629
24.79% of 50 DAV
50 DAV is 139,700
|
$30.91
-9.67%
|
8/3/2012
|
$29.91
|
PP = $30.45
|
|
MB = $31.97
|
Most Recent Note - 10/8/2012 4:00:55 PM
Following the worrisome "negative reversal" noted on 10/02/12 it has encountered resistance at its 50 DMA line. Its Relative Strength Rating has slumped to a 66, well below the 80+ guideline for buy candidates. Based on weak action it will be dropped from the Featured Stocks list tonight.
>>> The latest Featured Stock Update with an annotated graph appeared on 9/12/2012. Click here.
View all notes |
Alert me of new notes |
CANSLIM.net Company Profile |
SEC |
Zacks Reports |
StockTalk |
News |
Chart |
Request a new note
C
A N
S L
I M
|
EXPE
-
NASDAQ
Expedia Inc
INTERNET - Internet Information Providers
|
$56.80
|
-0.80
-1.39% |
$58.06
|
1,880,598
61.16% of 50 DAV
50 DAV is 3,074,800
|
$60.29
-5.79%
|
4/27/2012
|
$41.80
|
PP = $35.57
|
|
MB = $37.35
|
Most Recent Note - 10/8/2012 4:02:50 PM
G - Volume totals have been below average after forming a late-stage cup-with-handle type base and it is currently perched -5.7% off its 52-week high while quietly consolidating above its 50 DMA line. It has been noted a few times in recent weeks - "No overhead supply remains to hinder its progress, however weak industry group action and iffy fundamentals were noted as causes for concern." See more details and an annotated graph in the latest FSU analysis under the headline "Online Travel Firm Resilient Despite Unfavorable Signs - Wednesday, September 19, 2012"
>>> The latest Featured Stock Update with an annotated graph appeared on 9/19/2012. Click here.
View all notes |
Alert me of new notes |
CANSLIM.net Company Profile |
SEC |
Zacks Reports |
StockTalk |
News |
Chart |
Request a new note
C
A N
S L
I M
|
GPX
-
NYSE
G P Strategies Corp
DIVERSIFIED SERVICES - Education and Training Services
|
$19.98
|
+0.13
0.65% |
$20.07
|
56,094
73.71% of 50 DAV
50 DAV is 76,100
|
$20.67
-3.34%
|
10/8/2012
|
$20.00
|
PP = $20.77
|
|
MB = $21.81
|
Most Recent Note - 10/8/2012 4:07:52 PM
Y - Perched only -3.1% off its 52-week high today, it recently found support at its 50 DMA line. Color code is changed to yellow with new pivot point cited based on its 8/29/12 high plus 10 cents. Volume driven gains above the pivot point may trigger a new (or add-on) technical buy signal. Losses exceeding last week's low $18.82 would raise concerns and trigger technical sell signals.
>>> The latest Featured Stock Update with an annotated graph appeared on 9/13/2012. Click here.
View all notes |
Alert me of new notes |
CANSLIM.net Company Profile |
SEC |
Zacks Reports |
StockTalk |
News |
Chart |
Request a new note
C
A N
S L
I M
|
LKQ
-
NASDAQ
L K Q Corp
WHOLESALE - Auto Parts
|
$19.41
|
+0.05
0.26% |
$19.48
|
1,045,701
74.94% of 50 DAV
50 DAV is 1,395,400
|
$20.02
-3.02%
|
8/9/2012
|
$18.97
|
PP = $18.72
|
|
MB = $19.66
|
Most Recent Note - 10/3/2012 6:22:53 PM
Y - Rebounded above its 50 DMA line helping its technical stance with today's gain backed by above average volume, and its color code is changed to yellow again. Do not be confused by a 2:1 share split effective 9/19/12 (Featured Price, Pivot Point and Max Buy were adjusted).
>>> The latest Featured Stock Update with an annotated graph appeared on 9/17/2012. Click here.
View all notes |
Alert me of new notes |
CANSLIM.net Company Profile |
SEC |
Zacks Reports |
StockTalk |
News |
Chart |
Request a new note
C
A N
S L
I M
|
Symbol/Exchange
Company Name
Industry Group |
PRICE |
CHANGE
(%Change) |
Day High |
Volume
(% DAV)
(% 50 day avg vol) |
52 Wk Hi
% From Hi |
Featured
Date |
Price
Featured |
Pivot Featured |
|
Max Buy |
LNKD
-
NYSE
Linkedin Corp Class A
INTERNET - Internet Information Providers
|
$117.97
|
-0.86
-0.72% |
$119.42
|
1,367,422
55.37% of 50 DAV
50 DAV is 2,469,400
|
$125.50
-6.00%
|
9/5/2012
|
$113.25
|
PP = $113.10
|
|
MB = $118.76
|
Most Recent Note - 10/3/2012 1:33:49 PM
G - Trading up on light volume today, within close striking distance of its best-ever close. Volume totals have been cooling in recent weeks. Prior highs near $113 and its 50 DMA line define support to watch on pullbacks.
>>> The latest Featured Stock Update with an annotated graph appeared on 9/6/2012. Click here.
View all notes |
Alert me of new notes |
CANSLIM.net Company Profile |
SEC |
Zacks Reports |
StockTalk |
News |
Chart |
Request a new note
C
A N
S L
I M
|
LULU
-
NASDAQ
Lululemon Athletica
MANUFACTURING - Textile Manufacturing
|
$75.40
|
+0.00
0.00% |
$77.00
|
1,125,149
43.57% of 50 DAV
50 DAV is 2,582,100
|
$81.09
-7.02%
|
10/2/2012
|
$74.89
|
PP = $78.97
|
|
MB = $82.92
|
Most Recent Note - 10/8/2012 4:11:58 PM
Y - Following its cup-with-handle base pattern there have not yet been the volume-driven gains above its pivot point needed to confirm a technical buy signal. Fundamentals remain strong (good C and A criteria) and very little resistance from overhead supply is there to hinder its progress.
>>> The latest Featured Stock Update with an annotated graph appeared on 10/2/2012. Click here.
View all notes |
Alert me of new notes |
CANSLIM.net Company Profile |
SEC |
Zacks Reports |
StockTalk |
News |
Chart |
Request a new note
C
A N
S L
I M
|
MIDD
-
NASDAQ
Middleby Corp
MANUFACTURING - Diversified Machinery
|
$118.23
|
-0.59
-0.50% |
$118.95
|
25,701
24.93% of 50 DAV
50 DAV is 103,100
|
$122.57
-3.54%
|
10/8/2012
|
$118.46
|
PP = $122.67
|
|
MB = $128.80
|
Most Recent Note - 10/8/2012 3:54:32 PM
Y - Perched -3.4% off its 52-week high today with volume totals cooling in recent weeks while holding its ground. Color code is changed to yellow with new pivot point cited based on its 9/06/12 high plus 10 cents. Subsequent volume-driven gains above the pivot point may trigger a new (or add-on) technical buy signal. Its 50 DMA line and recent lows define near-term chart support to watch.
>>> The latest Featured Stock Update with an annotated graph appeared on 9/18/2012. Click here.
View all notes |
Alert me of new notes |
CANSLIM.net Company Profile |
SEC |
Zacks Reports |
StockTalk |
News |
Chart |
Request a new note
C
A N
S L
I M
|
N
-
NYSE
Netsuite Inc
DIVERSIFIED SERVICES - Business/Management Services
|
$62.21
|
-0.57
-0.91% |
$63.14
|
315,380
48.93% of 50 DAV
50 DAV is 644,500
|
$64.70
-3.85%
|
8/20/2012
|
$55.88
|
PP = $59.32
|
|
MB = $62.29
|
Most Recent Note - 10/2/2012 5:20:55 PM
G - Consolidating above its "max buy" level. Prior highs near $59 define initial support above its 50 DMA line where violations would trigger technical sell signals.
>>> The latest Featured Stock Update with an annotated graph appeared on 9/24/2012. Click here.
View all notes |
Alert me of new notes |
CANSLIM.net Company Profile |
SEC |
Zacks Reports |
StockTalk |
News |
Chart |
Request a new note
C
A N
S L
I M
|
NSM
-
NYSE
Nationstar Mtg Hldgs Inc
FINANCIAL SERVICES - Credit Services
|
$34.05
|
-0.03
-0.09% |
$34.54
|
840,200
72.16% of 50 DAV
50 DAV is 1,164,400
|
$37.20
-8.47%
|
8/29/2012
|
$27.96
|
PP = $28.85
|
|
MB = $30.29
|
Most Recent Note - 10/5/2012 5:47:11 PM
G - A steep upward trendline defines a near-term support level above its 50 DMA line. Finished today at the session low with a loss on above average volume. A worrisome "negative reversal" on 10/03/12 after hitting a new 52-week high raised some concerns after repeatedly noted as - "Extended from its prior base."
>>> The latest Featured Stock Update with an annotated graph appeared on 9/7/2012. Click here.
View all notes |
Alert me of new notes |
CANSLIM.net Company Profile |
SEC |
Zacks Reports |
StockTalk |
News |
Chart |
Request a new note
C
A N
S L
I M
|
Symbol/Exchange
Company Name
Industry Group |
PRICE |
CHANGE
(%Change) |
Day High |
Volume
(% DAV)
(% 50 day avg vol) |
52 Wk Hi
% From Hi |
Featured
Date |
Price
Featured |
Pivot Featured |
|
Max Buy |
OSIS
-
NASDAQ
O S I Systems Inc
ELECTRONICS - Semiconductor Equipment and Mate
|
$75.76
|
-0.21
-0.28% |
$75.99
|
48,708
36.62% of 50 DAV
50 DAV is 133,000
|
$78.93
-4.02%
|
9/5/2012
|
$74.39
|
PP = $75.10
|
|
MB = $78.86
|
Most Recent Note - 10/8/2012 4:13:40 PM
Y - Consolidating just -4% off its 52-week high today. It remains below its "max buy" level after bullish action recently confirmed a technical buy signal. Near term support is at its 50 DMA line.
>>> The latest Featured Stock Update with an annotated graph appeared on 9/14/2012. Click here.
View all notes |
Alert me of new notes |
CANSLIM.net Company Profile |
SEC |
Zacks Reports |
StockTalk |
News |
Chart |
Request a new note
C
A N
S L
I M
|
RNF
-
NYSE
Rentech Nitrogen Ptnr Lp
CHEMICALS - Agricultural Chemicals
|
$36.20
|
+0.11
0.30% |
$36.72
|
157,297
33.19% of 50 DAV
50 DAV is 473,900
|
$40.05
-9.61%
|
7/27/2012
|
$29.58
|
PP = $30.60
|
|
MB = $32.13
|
Most Recent Note - 10/4/2012 7:18:08 PM
G - Down today for a 3rd consecutive loss with above average volume, sinking toward its 50 DMA line. Its volume-driven loss on the prior session violated a previously noted upward trendline defining near-term chart support in the $37 area which may be considered an early sell signal. See the latest FSU analysis for more details and a new annotated graph.
>>> The latest Featured Stock Update with an annotated graph appeared on 10/4/2012. Click here.
View all notes |
Alert me of new notes |
CANSLIM.net Company Profile |
SEC |
Zacks Reports |
StockTalk |
News |
Chart |
Request a new note
C
A N
S L
I M
|
SWI
-
NYSE
Solarwinds Inc
COMPUTER SOFTWARE and SERVICES - Application Software
|
$56.25
|
-0.71
-1.25% |
$57.43
|
426,570
41.60% of 50 DAV
50 DAV is 1,025,500
|
$60.95
-7.71%
|
7/25/2012
|
$47.82
|
PP = $47.89
|
|
MB = $50.28
|
Most Recent Note - 10/3/2012 6:24:50 PM
Y - Color code is changed to yellow based on the secondary buy point explained in the latest FSU analysis along with a new annotated graph. A subsequent violation of the 9/26/12 low ($53.78) would raise more serious concerns and trigger technical sell signals.
>>> The latest Featured Stock Update with an annotated graph appeared on 10/3/2012. Click here.
View all notes |
Alert me of new notes |
CANSLIM.net Company Profile |
SEC |
Zacks Reports |
StockTalk |
News |
Chart |
Request a new note
C
A N
S L
I M
|
TDG
-
NYSE
Transdigm Group Inc
AEROSPACE/DEFENSE - Aerospace/Defense Products and; Services
|
$146.84
|
-3.24
-2.16% |
$150.29
|
483,956
117.29% of 50 DAV
50 DAV is 412,600
|
$152.62
-3.79%
|
8/16/2012
|
$132.23
|
PP = $136.44
|
|
MB = $143.26
|
Most Recent Note - 10/4/2012 7:24:04 PM
G - Rallied further above its "max buy" level to another new 52-week high with above average volume behind today's 3rd consecutive gain. Its 50 DMA line and prior highs define near-term support to watch in the $135-136 area on pullbacks.
>>> The latest Featured Stock Update with an annotated graph appeared on 9/20/2012. Click here.
View all notes |
Alert me of new notes |
CANSLIM.net Company Profile |
SEC |
Zacks Reports |
StockTalk |
News |
Chart |
Request a new note
C
A N
S L
I M
|
ULTA
-
NASDAQ
Ulta Salon Cosm & Frag
SPECIALTY RETAIL - Specialty Retail, Other
|
$98.17
|
-1.60
-1.60% |
$100.35
|
331,413
43.61% of 50 DAV
50 DAV is 760,000
|
$103.52
-5.17%
|
9/4/2012
|
$93.17
|
PP = $98.52
|
|
MB = $103.45
|
Most Recent Note - 10/5/2012 7:58:05 PM
Y - Volume totals have been cooling in recent weeks following its 9/07/12 breakaway gap on earnings news. See the latest FSU analysis for more details and a new annotated graph.
>>> The latest Featured Stock Update with an annotated graph appeared on 10/5/2012. Click here.
View all notes |
Alert me of new notes |
CANSLIM.net Company Profile |
SEC |
Zacks Reports |
StockTalk |
News |
Chart |
Request a new note
C
A N
S L
I M
|
Symbol/Exchange
Company Name
Industry Group |
PRICE |
CHANGE
(%Change) |
Day High |
Volume
(% DAV)
(% 50 day avg vol) |
52 Wk Hi
% From Hi |
Featured
Date |
Price
Featured |
Pivot Featured |
|
Max Buy |
ULTI
-
NASDAQ
Ultimate Software Group
INTERNET - Internet Software and Services
|
$100.90
|
-0.92
-0.90% |
$102.00
|
58,917
35.36% of 50 DAV
50 DAV is 166,600
|
$106.40
-5.17%
|
8/27/2012
|
$98.36
|
PP = $99.19
|
|
MB = $104.15
|
Most Recent Note - 10/5/2012 8:02:08 PM
Y - Erased its prior gain today, closing back below its "max buy" level and its color code is changed to yellow. Recent lows define initial support to watch along with its 50 DMA line in the $96 area where violations would raise concerns and trigger technical sell signals.
>>> The latest Featured Stock Update with an annotated graph appeared on 9/27/2012. Click here.
View all notes |
Alert me of new notes |
CANSLIM.net Company Profile |
SEC |
Zacks Reports |
StockTalk |
News |
Chart |
Request a new note
C
A N
S L
I M
|
VSI
-
NYSE
Vitamin Shoppe Inc
SPECIALTY RETAIL - Specialty Retail, Other
|
$58.18
|
+0.59
1.02% |
$58.46
|
278,612
77.14% of 50 DAV
50 DAV is 361,200
|
$61.83
-5.90%
|
6/29/2012
|
$54.93
|
PP = $55.03
|
|
MB = $57.78
|
Most Recent Note - 10/3/2012 1:28:13 PM
G - Volume totals have been cooling in recent weeks while consolidating. Prior lows near $52 define important chart support below its 50 DMA line.
>>> The latest Featured Stock Update with an annotated graph appeared on 9/10/2012. Click here.
View all notes |
Alert me of new notes |
CANSLIM.net Company Profile |
SEC |
Zacks Reports |
StockTalk |
News |
Chart |
Request a new note
C
A N
S L
I M
|
WPI
-
NYSE
Watson Pharmaceuticals
DRUGS - Drugs - Generic
|
$87.83
|
-0.03
-0.03% |
$87.88
|
462,420
46.24% of 50 DAV
50 DAV is 1,000,000
|
$88.06
-0.26%
|
8/24/2012
|
$82.90
|
PP = $81.10
|
|
MB = $85.16
|
Most Recent Note - 10/3/2012 1:29:39 PM
G - Hit a new 52-week high with today's small gain on light volume, getting more extended from its prior base. Prior lows and its 50 DMA line in the $82 area define important support to watch on pullbacks.
>>> The latest Featured Stock Update with an annotated graph appeared on 9/28/2012. Click here.
View all notes |
Alert me of new notes |
CANSLIM.net Company Profile |
SEC |
Zacks Reports |
StockTalk |
News |
Chart |
Request a new note
C
A N
S L
I M
|