***Last / Change / Volume data in this table is the closing quote data***
Symbol/Exchange
Company Name
Industry Group |
PRICE |
CHANGE
(%Change) |
Day High |
Volume
(% DAV)
(% 50 day avg vol) |
52 Wk Hi
% From Hi |
Featured
Date |
Price
Featured |
Pivot Featured |
|
Max Buy |
ABV
-
NYSE
Comp De Bebidas Adr
FOOD and BEVERAGE - Beverages - Brewers
|
$132.66
|
+2.72
2.09% |
$132.96
|
578,118
95.40% of 50 DAV
50 DAV is 606,000
|
$130.60
1.58%
|
6/29/2010
|
$104.74
|
PP = $109.33
|
|
MB = $114.80
|
 Most Recent Note - 10/8/2010 4:02:51 PM
G - This Brazil-based beverage firm hit yet another new all-time high today with 6th consecutive gain. It is very extended from a sound base, and its 50 DMA line ($113.24 now) defines support.
>>> The latest Featured Stock Update with an annotated graph appeared on 8/18/2010. Click here.
View all notes |
Alert me of new notes |
CANSLIM.net Company Profile |
SEC |
Zacks Reports |
StockTalk |
News |
Chart |
Request a new note
C
A N
S L
I M


|
ARUN
-
NASDAQ
Aruba Networks Inc
COMPUTER HARDWARE - Networking andamp; Communication Dev
|
$20.08
|
+0.49
2.50% |
$20.23
|
2,433,873
116.11% of 50 DAV
50 DAV is 2,096,100
|
$22.80
-11.93%
|
8/30/2010
|
$18.12
|
PP = $18.51
|
|
MB = $19.44
|
Most Recent Note - 10/8/2010 3:53:20 PM
G - Gain today with lighter volume follows damaging distributional losses on heavy volume this week. Repeatedly noted - "Prior highs near $18 and its 50 DMA line define important near-term chart support levels to watch."
>>> The latest Featured Stock Update with an annotated graph appeared on 9/2/2010. Click here.
View all notes |
Alert me of new notes |
CANSLIM.net Company Profile |
SEC |
Zacks Reports |
StockTalk |
News |
Chart |
Request a new note
C
A N
S L
I M
|
BIDU
-
NASDAQ
Baidu Inc Ads
INTERNET - Internet Information Providers
|
$98.62
|
+0.13
0.13% |
$99.53
|
11,280,691
116.77% of 50 DAV
50 DAV is 9,660,300
|
$107.19
-8.00%
|
9/17/2010
|
$85.73
|
PP = $88.42
|
|
MB = $92.84
|
Most Recent Note - 10/6/2010 12:08:48 PM
G - Perched within close striking distance of its best-ever close ($103.82), it has been repeatedly noted as "extended from any sound base" yet could go on to produce more climactic gains. A subsequent violation of its 10/04/10 low $95.12 would raise concerns, while the nearest chart support is at old highs and its 50 DMA line.
>>> The latest Featured Stock Update with an annotated graph appeared on 10/7/2010. Click here.
View all notes |
Alert me of new notes |
CANSLIM.net Company Profile |
SEC |
Zacks Reports |
StockTalk |
News |
Chart |
Request a new note
C
A N
S L
I M
|
CACC
-
NASDAQ
Credit Acceptance Corp
FINANCIAL SERVICES - Credit Services
|
$58.42
|
-0.05
-0.09% |
$58.65
|
15,094
35.02% of 50 DAV
50 DAV is 43,100
|
$63.45
-7.93%
|
7/29/2010
|
$52.04
|
PP = $54.07
|
|
MB = $56.77
|
Most Recent Note - 10/7/2010 5:09:48 PM
G - Posted a gain today and signs of support near that short-term average have been encouraging. Its 50 DMA line may act as resistance, while a convincing rebound above it would help its outlook improve. The old high ($53.97 on 2/01/10) is the next chart support level to watch.
>>> The latest Featured Stock Update with an annotated graph appeared on 9/30/2010. Click here.
View all notes |
Alert me of new notes |
CANSLIM.net Company Profile |
SEC |
Zacks Reports |
StockTalk |
News |
Chart |
Request a new note
C
A N
S L
I M
|
CMG
-
NYSE
Chipotle Mexican Grill
LEISURE - Restaurants
|
$176.56
|
+1.74
1.00% |
$177.52
|
523,856
85.84% of 50 DAV
50 DAV is 610,300
|
$179.50
-1.64%
|
9/1/2010
|
$158.31
|
PP = $155.52
|
|
MB = $163.30
|
Most Recent Note - 10/5/2010 5:38:27 PM
G - Gapped up and rallied to a new all-time high today with above average volume. Extended from prior highs in the $155 area that define chart support.
>>> The latest Featured Stock Update with an annotated graph appeared on 9/1/2010. Click here.
View all notes |
Alert me of new notes |
CANSLIM.net Company Profile |
SEC |
Zacks Reports |
StockTalk |
News |
Chart |
Request a new note
C
A N
S L
I M
|
Symbol/Exchange
Company Name
Industry Group |
PRICE |
CHANGE
(%Change) |
Day High |
Volume
(% DAV)
(% 50 day avg vol) |
52 Wk Hi
% From Hi |
Featured
Date |
Price
Featured |
Pivot Featured |
|
Max Buy |
CTRP
-
NASDAQ
Ctrip.Com Intl Ltd Adr
LEISURE - Resorts and Casinos
|
$46.02
|
-0.50
-1.07% |
$47.18
|
1,633,961
92.48% of 50 DAV
50 DAV is 1,766,900
|
$49.23
-6.53%
|
9/24/2010
|
$46.75
|
PP = $47.11
|
|
MB = $49.47
|
Most Recent Note - 10/6/2010 6:34:52 PM
Y - Down today with average volume, slumping below its pivot point again. More damaging losses would raise greater concerns, as healthy stocks do not typically slump more than -7% below their pivot point after breaking out.
>>> The latest Featured Stock Update with an annotated graph appeared on 9/28/2010. Click here.
View all notes |
Alert me of new notes |
CANSLIM.net Company Profile |
SEC |
Zacks Reports |
StockTalk |
News |
Chart |
Request a new note
C
A N
S L
I M
|
EBIX
-
NASDAQ
Ebix Inc
COMPUTER SOFTWARE and SERVICES - Business Software and Services
|
$22.81
|
-0.58
-2.48% |
$23.58
|
427,487
79.30% of 50 DAV
50 DAV is 539,100
|
$25.61
-10.93%
|
9/23/2010
|
$21.78
|
PP = $22.74
|
|
MB = $23.88
|
Most Recent Note - 10/8/2010 3:34:04 PM
G - Holding its ground following a negative reversal on 10/06/10, ending with a loss on heavy volume after touching a new all-time high. As previously noted -"It could go on to produce more climactic gains, but it is extended from an ideal base. Recent highs near $20 define chart support to watch."
>>> The latest Featured Stock Update with an annotated graph appeared on 9/24/2010. Click here.
View all notes |
Alert me of new notes |
CANSLIM.net Company Profile |
SEC |
Zacks Reports |
StockTalk |
News |
Chart |
Request a new note
C
A N
S L
I M
|
EGO
-
NYSE
Eldorado Gold Corp
METALS and MINING - Gold
|
$18.54
|
+0.18
0.98% |
$18.71
|
2,938,196
63.35% of 50 DAV
50 DAV is 4,638,400
|
$20.23
-8.35%
|
8/19/2010
|
$18.25
|
PP = $19.17
|
|
MB = $20.13
|
Most Recent Note - 10/7/2010 4:57:41 PM
Y - Reversed for a loss with +22% above average volume after a gap up today, closing just pennies under its 50 DMA line and still above recent low closes. Previously noted - "A damaging violation of that important short-term average or breach of its recent chart low ($17.65 on 9/28/10) would raise concerns and trigger technical sell signals."
>>> The latest Featured Stock Update with an annotated graph appeared on 8/19/2010. Click here.
View all notes |
Alert me of new notes |
CANSLIM.net Company Profile |
SEC |
Zacks Reports |
StockTalk |
News |
Chart |
Request a new note
C
A N
S L
I M
|
FFIV
-
NASDAQ
F 5 Networks Inc
INTERNET - Internet Software and Services
|
$94.69
|
-4.29
-4.33% |
$95.24
|
7,941,302
487.62% of 50 DAV
50 DAV is 1,628,600
|
$112.05
-15.49%
|
6/16/2010
|
$74.50
|
PP = $74.10
|
|
MB = $77.81
|
Most Recent Note - 10/8/2010 3:29:29 PM
G - It has rebounded near its 50 DMA line to its intra-day high now after undercutting that important short-term average as it gapped down for another damaging loss today. This week it violated the previously noted upward trendline connecting its July-August lows, triggering a technical sell signal with the largest point losses on the highest volume totals it has seen after making a considerable advance.
>>> The latest Featured Stock Update with an annotated graph appeared on 9/13/2010. Click here.
View all notes |
Alert me of new notes |
CANSLIM.net Company Profile |
SEC |
Zacks Reports |
StockTalk |
News |
Chart |
Request a new note
C
A N
S L
I M
|
FOSL
-
NASDAQ
Fossil Inc
CONSUMER DURABLES - Recreational Goods, Other
|
$54.54
|
-0.14
-0.26% |
$55.08
|
471,677
58.65% of 50 DAV
50 DAV is 804,200
|
$54.97
-0.78%
|
8/10/2010
|
$45.54
|
PP = $42.69
|
|
MB = $44.82
|
Most Recent Note - 10/7/2010 5:12:02 PM
G - Gain today with above average volume for its best-ever close. An upward trendline defines initial support to watch after it has been repeatedly noted as "extended from any sound base."
>>> The latest Featured Stock Update with an annotated graph appeared on 10/5/2010. Click here.
View all notes |
Alert me of new notes |
CANSLIM.net Company Profile |
SEC |
Zacks Reports |
StockTalk |
News |
Chart |
Request a new note
C
A N
S L
I M
|
Symbol/Exchange
Company Name
Industry Group |
PRICE |
CHANGE
(%Change) |
Day High |
Volume
(% DAV)
(% 50 day avg vol) |
52 Wk Hi
% From Hi |
Featured
Date |
Price
Featured |
Pivot Featured |
|
Max Buy |
HMSY
-
NASDAQ
H M S Holdings Corp
COMPUTER SOFTWARE and SERVICES - Healthcare Information Service
|
$61.11
|
+0.74
1.23% |
$61.55
|
204,289
106.23% of 50 DAV
50 DAV is 192,300
|
$61.17
-0.10%
|
9/27/2010
|
$57.97
|
PP = $58.36
|
|
MB = $61.28
|
Most Recent Note - 10/8/2010 4:05:30 PM
G - Color code is changed to green after getting extended from an ideal base. Up on near average volume today for a new high, inching above its "max buy" level higher without great volume conviction behind gains since 9/27/10 when featured in yellow.
>>> The latest Featured Stock Update with an annotated graph appeared on 9/27/2010. Click here.
View all notes |
Alert me of new notes |
CANSLIM.net Company Profile |
SEC |
Zacks Reports |
StockTalk |
News |
Chart |
Request a new note
C
A N
S L
I M
|
HS
-
NYSE
Healthspring Inc
HEALTH SERVICES - Health Care Plans
|
$26.22
|
+0.55
2.14% |
$26.34
|
586,759
77.17% of 50 DAV
50 DAV is 760,300
|
$27.00
-2.89%
|
8/27/2010
|
$19.91
|
PP = $19.75
|
|
MB = $20.74
|
Most Recent Note - 10/8/2010 4:19:55 PM
G - Gain today with light volume for its second best close ever. Support to watch is prior chart highs in the $19-20 area.
>>> The latest Featured Stock Update with an annotated graph appeared on 8/27/2010. Click here.
View all notes |
Alert me of new notes |
CANSLIM.net Company Profile |
SEC |
Zacks Reports |
StockTalk |
News |
Chart |
Request a new note
C
A N
S L
I M
|
IGTE
-
NASDAQ
Igate Corp
COMPUTER SOFTWARE and SERVICES - Information Technology Service
|
$18.23
|
+1.04
6.05% |
$18.32
|
967,303
252.76% of 50 DAV
50 DAV is 382,700
|
$19.45
-6.27%
|
9/8/2010
|
$17.29
|
PP = $18.26
|
|
MB = $19.17
|
Most Recent Note - 10/8/2010 3:41:19 PM
Y - Gain today on heavy volume, rallying from important chart support at its 50 DMA line back to near its pivot point. More damaging losses would raise concerns and trigger technical sell signals.
>>> The latest Featured Stock Update with an annotated graph appeared on 9/10/2010. Click here.
View all notes |
Alert me of new notes |
CANSLIM.net Company Profile |
SEC |
Zacks Reports |
StockTalk |
News |
Chart |
Request a new note
C
A N
S L
I M
|
JOBS
-
NASDAQ
Fifty One Job Inc Ads
DIVERSIFIED SERVICES - Staffing and; Outsourcing Service
|
$38.06
|
+1.80
4.96% |
$38.37
|
135,776
89.80% of 50 DAV
50 DAV is 151,200
|
$40.50
-6.02%
|
9/16/2010
|
$31.59
|
PP = $30.40
|
|
MB = $31.92
|
Most Recent Note - 10/8/2010 3:43:27 PM
G - Solid gain today with light volume has halted a streak of 3 consecutive losses. Noted recently - "Very extended from a sound base. Prior highs in the $30 area define chart support."
>>> The latest Featured Stock Update with an annotated graph appeared on 9/16/2010. Click here.
View all notes |
Alert me of new notes |
CANSLIM.net Company Profile |
SEC |
Zacks Reports |
StockTalk |
News |
Chart |
Request a new note
C
A N
S L
I M
|
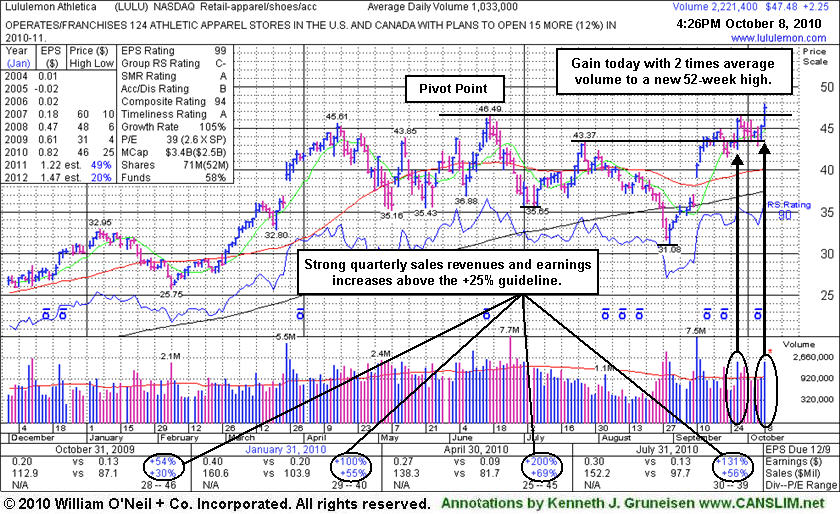
LULU
-
NASDAQ
Lululemon Athletica
MANUFACTURING - Textile Manufacturing
|
$47.48
|
+2.26
4.99% |
$47.99
|
2,221,667
217.47% of 50 DAV
50 DAV is 1,021,600
|
$46.57
1.95%
|
10/8/2010
|
$47.66
|
PP = $46.67
|
|
MB = $49.00
|
Most Recent Note - 10/8/2010 6:06:46 PM
Y - Color code was changed to yellow with its pivot point based on its 52-week high plus ten cents as it was featured in the mid-day report earlier. Today's gain for a new 52-week high with +117% above average volume helped this high-ranked Retail - Apparel/Shoes/Accessories firm rally clear of any resistance due to overhead supply and trigger a new buy signal. Technically, its 9/28/10 gain with above average volume helped it clear a big "double bottom" type base and trigger an earlier buy signal, followed by a quiet consolidation. The 4 latest quarterly comparisons showed strong sales revenues and impressive earnings increases (C criteria), and it maintained a good annual earnings history (A criteria) despite a patch of negative comparisons in early '09.
>>> The latest Featured Stock Update with an annotated graph appeared on 10/8/2010. Click here.
View all notes |
Alert me of new notes |
CANSLIM.net Company Profile |
SEC |
Zacks Reports |
StockTalk |
News |
Chart |
Request a new note
C
A N
S L
I M
|
Symbol/Exchange
Company Name
Industry Group |
PRICE |
CHANGE
(%Change) |
Day High |
Volume
(% DAV)
(% 50 day avg vol) |
52 Wk Hi
% From Hi |
Featured
Date |
Price
Featured |
Pivot Featured |
|
Max Buy |
MELI
-
NASDAQ
Mercadolibre Inc
INTERNET - Internet Software and; Services
|
$65.40
|
+0.95
1.47% |
$66.62
|
808,933
93.79% of 50 DAV
50 DAV is 862,500
|
$76.81
-14.85%
|
5/13/2010
|
$54.21
|
PP = $55.85
|
|
MB = $58.64
|
Most Recent Note - 10/6/2010 6:20:27 PM
G - Slumped further below its 50 DMA line today with above average volume behind another damaging loss. Weakness triggered technical sell signals after recently noted - "It may find support near that important short-term average and continue its ascent, but steep declines in the past (best viewed on a weekly chart) are a reminder to always use proper trading discipline."
>>> The latest Featured Stock Update with an annotated graph appeared on 8/26/2010. Click here.
View all notes |
Alert me of new notes |
CANSLIM.net Company Profile |
SEC |
Zacks Reports |
StockTalk |
News |
Chart |
Request a new note
C
A N
S L
I M
|
MRX
-
NYSE
Medicis Pharmaceut Cl A
DRUGS - Biotechnology
|
$30.14
|
+0.31
1.04% |
$30.37
|
1,088,618
97.35% of 50 DAV
50 DAV is 1,118,300
|
$30.64
-1.63%
|
8/12/2010
|
$26.88
|
PP = $26.71
|
|
MB = $28.05
|
Most Recent Note - 10/5/2010 3:58:03 PM
G - Gapped up today rallying for a considerable gain, and hitting a new 52-week high. An upward trendline shown in the latest FSU section analysis defines an initial chart support level to watch.
>>> The latest Featured Stock Update with an annotated graph appeared on 10/4/2010. Click here.
View all notes |
Alert me of new notes |
CANSLIM.net Company Profile |
SEC |
Zacks Reports |
StockTalk |
News |
Chart |
Request a new note
C
A N
S L
I M
|
MWIV
-
NASDAQ
M W I Veterinary Supply
HEALTH SERVICES - Medical Instruments and; Supplies
|
$59.24
|
+0.66
1.13% |
$59.48
|
29,279
41.47% of 50 DAV
50 DAV is 70,600
|
$59.50
-0.44%
|
7/29/2010
|
$52.05
|
PP = $52.09
|
|
MB = $54.69
|
Most Recent Note - 10/5/2010 3:42:13 PM
G - Considerable gain today without great volume conviction thus far has it poised for its best-ever close (above the $57.97 close from 9/29/10). No overhead supply remains to act as resistance. Its nearby 50 DMA line defines chart support.
>>> The latest Featured Stock Update with an annotated graph appeared on 9/7/2010. Click here.
View all notes |
Alert me of new notes |
CANSLIM.net Company Profile |
SEC |
Zacks Reports |
StockTalk |
News |
Chart |
Request a new note
C
A N
S L
I M
|
NEM
-
NYSE
Newmont Mining Corp
METALS and MINING - Gold
|
$62.89
|
-0.14
-0.22% |
$63.31
|
6,188,000
99.72% of 50 DAV
50 DAV is 6,205,300
|
$65.50
-3.98%
|
8/31/2010
|
$61.32
|
PP = $63.48
|
|
MB = $66.65
|
Most Recent Note - 10/7/2010 1:01:57 PM
Y - Loss today with higher volume raises concerns, sinking under its pivot point again after stalling just shy of its best-ever close. While leadership in the Mining - Gold/Silver/Gems group (L criteria) is a nice reassurance, its Relative Strength rank (81) and RS line have been waning for several weeks. It churned a lot of volume but made little price progress since first featured in a Stock Bulletin on 6/22/10 (read here).
>>> The latest Featured Stock Update with an annotated graph appeared on 9/14/2010. Click here.
View all notes |
Alert me of new notes |
CANSLIM.net Company Profile |
SEC |
Zacks Reports |
StockTalk |
News |
Chart |
Request a new note
C
A N
S L
I M
|
NEOG
-
NASDAQ
Neogen Corp
DRUGS - Diagnostic Substances
|
$34.00
|
+0.37
1.10% |
$34.24
|
42,653
40.86% of 50 DAV
50 DAV is 104,400
|
$34.76
-2.19%
|
9/1/2010
|
$30.79
|
PP = $30.49
|
|
MB = $32.01
|
Most Recent Note - 10/5/2010 5:52:47 PM
G - Consolidating and recently enduring mild distributional pressure after getting extended from a sound base. Prior highs in the $30 area define initial support to watch.
>>> The latest Featured Stock Update with an annotated graph appeared on 8/20/2010. Click here.
View all notes |
Alert me of new notes |
CANSLIM.net Company Profile |
SEC |
Zacks Reports |
StockTalk |
News |
Chart |
Request a new note
C
A N
S L
I M
|
Symbol/Exchange
Company Name
Industry Group |
PRICE |
CHANGE
(%Change) |
Day High |
Volume
(% DAV)
(% 50 day avg vol) |
52 Wk Hi
% From Hi |
Featured
Date |
Price
Featured |
Pivot Featured |
|
Max Buy |
NFLX
-
NASDAQ
Netflix Inc
SPECIALTY RETAIL - Music and Video Stores
|
$149.64
|
-1.79
-1.18% |
$153.00
|
3,482,262
61.31% of 50 DAV
50 DAV is 5,679,900
|
$174.40
-14.20%
|
8/10/2010
|
$124.05
|
PP = $124.00
|
|
MB = $130.20
|
Most Recent Note - 10/6/2010 6:32:56 PM
G - Down today with above average volume, enduring distributional pressure after an impressive sprint to new highs in recent months. Following its recently noted "negative reversal", today it violated the upward trendline shown in the latest FSU analysis, raising greater concerns. Its 50 DMA line is the next chart support level to watch.
>>> The latest Featured Stock Update with an annotated graph appeared on 10/1/2010. Click here.
View all notes |
Alert me of new notes |
CANSLIM.net Company Profile |
SEC |
Zacks Reports |
StockTalk |
News |
Chart |
Request a new note
C
A N
S L
I M
|
NTAP
-
NASDAQ
Netapp Inc
COMPUTER HARDWARE - Data Storage Devices
|
$48.76
|
+0.48
0.99% |
$48.86
|
6,402,103
77.56% of 50 DAV
50 DAV is 8,254,200
|
$51.40
-5.14%
|
9/8/2010
|
$46.98
|
PP = $44.99
|
|
MB = $47.24
|
Most Recent Note - 10/6/2010 6:15:32 PM
G - Damaging loss today on heavy volume was another clear sign of distributional pressure after repeatedly noted as "extended from a sound base." Support to watch is at prior chart highs near its latest pivot point.
>>> The latest Featured Stock Update with an annotated graph appeared on 9/8/2010. Click here.
View all notes |
Alert me of new notes |
CANSLIM.net Company Profile |
SEC |
Zacks Reports |
StockTalk |
News |
Chart |
Request a new note
C
A N
S L
I M
|
ORCL
-
NASDAQ
Oracle Corp
COMPUTER SOFTWARE and SERVICES - Application Software
|
$28.00
|
+0.31
1.12% |
$28.08
|
33,144,882
90.35% of 50 DAV
50 DAV is 36,683,000
|
$27.89
0.39%
|
9/20/2010
|
$27.32
|
PP = $26.73
|
|
MB = $28.07
|
Most Recent Note - 10/5/2010 5:59:36 PM
Y - Holding its ground in a very tight trading range still since its "breakaway gap" on 9/17/10 backed by 5 times average volume.
>>> The latest Featured Stock Update with an annotated graph appeared on 9/20/2010. Click here.
View all notes |
Alert me of new notes |
CANSLIM.net Company Profile |
SEC |
Zacks Reports |
StockTalk |
News |
Chart |
Request a new note
C
A N
S L
I M
|
PAY
-
NYSE
Verifone Systems Inc
COMPUTER HARDWARE - Transaction Automation Systems
|
$27.85
|
+0.00
0.00% |
$28.08
|
739,509
50.80% of 50 DAV
50 DAV is 1,455,800
|
$31.40
-11.31%
|
8/25/2010
|
$24.30
|
PP = $23.74
|
|
MB = $24.93
|
Most Recent Note - 10/6/2010 6:25:47 PM
G - Pullback today on light volume leaves it still as previously noted - "Extended from a sound base." Its 50 DMA line defines the nearest chart support.
>>> The latest Featured Stock Update with an annotated graph appeared on 8/30/2010. Click here.
View all notes |
Alert me of new notes |
CANSLIM.net Company Profile |
SEC |
Zacks Reports |
StockTalk |
News |
Chart |
Request a new note
C
A N
S L
I M
|
PRGO
-
NASDAQ
Perrigo Co
DRUGS - Drug Related Products
|
$66.43
|
+0.62
0.94% |
$66.89
|
560,406
57.06% of 50 DAV
50 DAV is 982,100
|
$67.49
-1.57%
|
9/15/2010
|
$63.73
|
PP = $64.76
|
|
MB = $68.00
|
Most Recent Note - 10/5/2010 5:53:54 PM
Y - Gapped up today for a gain on lighter volume. Its 9/24/10 gap up gain with +50% above average volume for a new 52-week high triggered a technical buy signal with volume near the minimum guideline. It was first featured in the 9/15/10 mid-day report.
>>> The latest Featured Stock Update with an annotated graph appeared on 9/15/2010. Click here.
View all notes |
Alert me of new notes |
CANSLIM.net Company Profile |
SEC |
Zacks Reports |
StockTalk |
News |
Chart |
Request a new note
C
A N
S L
I M
|
Symbol/Exchange
Company Name
Industry Group |
PRICE |
CHANGE
(%Change) |
Day High |
Volume
(% DAV)
(% 50 day avg vol) |
52 Wk Hi
% From Hi |
Featured
Date |
Price
Featured |
Pivot Featured |
|
Max Buy |
RAX
-
NYSE
Rackspace Hosting Inc
INTERNET - Internet Software and; Services
|
$24.48
|
+0.49
2.04% |
$24.81
|
1,336,231
58.88% of 50 DAV
50 DAV is 2,269,500
|
$26.50
-7.62%
|
9/21/2010
|
$22.84
|
PP = $23.61
|
|
MB = $24.79
|
Most Recent Note - 10/8/2010 3:50:12 PM
G - Posted a meaningful gain on the prior session and trading up again today, recovering following a damaging gap down on 10/06/10 indicative of heavy distributional pressure.
>>> The latest Featured Stock Update with an annotated graph appeared on 9/21/2010. Click here.
View all notes |
Alert me of new notes |
CANSLIM.net Company Profile |
SEC |
Zacks Reports |
StockTalk |
News |
Chart |
Request a new note
C
A N
S L
I M
|
ROVI
-
NASDAQ
Rovi Corp
COMPUTER SOFTWARE andamp; SERVICES - Security Software andamp; Services
|
$49.99
|
+0.98
2.00% |
$50.23
|
1,190,974
77.04% of 50 DAV
50 DAV is 1,546,000
|
$53.00
-5.68%
|
8/31/2010
|
$43.31
|
PP = $45.06
|
|
MB = $47.31
|
Most Recent Note - 10/8/2010 4:00:37 PM
G - Small gain on light volume today, still consolidating after a streak of big gains on above average volume. It is extended from its latest base, and prior highs in the $45 area define chart support to watch now.
>>> The latest Featured Stock Update with an annotated graph appeared on 8/24/2010. Click here.
View all notes |
Alert me of new notes |
CANSLIM.net Company Profile |
SEC |
Zacks Reports |
StockTalk |
News |
Chart |
Request a new note
C
A N
S L
I M
|
SHOO
-
NASDAQ
Steven Madden Limited
CONSUMER NON-DURABLES - Textile - Apparel Footwear
|
$44.42
|
+0.81
1.86% |
$44.72
|
365,117
81.86% of 50 DAV
50 DAV is 446,000
|
$44.42
0.00%
|
9/15/2010
|
$38.94
|
PP = $40.27
|
|
MB = $42.28
|
Most Recent Note - 10/8/2010 3:58:00 PM
G - Hit yet another new 52-week high with today's gain on light volume. Prior highs in the $40 area define chart support to watch now. Color code was changed to green after getting extended more than +5% above its prior highs.
>>> The latest Featured Stock Update with an annotated graph appeared on 9/29/2010. Click here.
View all notes |
Alert me of new notes |
CANSLIM.net Company Profile |
SEC |
Zacks Reports |
StockTalk |
News |
Chart |
Request a new note
C
A N
S L
I M
|
SLW
-
NYSE
Silver Wheaton Corp
METALS and; MINING - Silver
|
$26.63
|
+0.59
2.27% |
$26.75
|
6,097,547
108.09% of 50 DAV
50 DAV is 5,641,300
|
$27.31
-2.49%
|
8/25/2010
|
$21.40
|
PP = $21.99
|
|
MB = $23.09
|
Most Recent Note - 10/8/2010 4:10:17 PM
G - Net weekly loss of just pennies at Friday's close barely broke the streak of 11 consecutive weekly gains to all-time highs. Prior highs and its 50 DMA line in the $22 area define chart support to watch on pullbacks.
>>> The latest Featured Stock Update with an annotated graph appeared on 8/25/2010. Click here.
View all notes |
Alert me of new notes |
CANSLIM.net Company Profile |
SEC |
Zacks Reports |
StockTalk |
News |
Chart |
Request a new note
C
A N
S L
I M
|
SVR
-
NYSE
Syniverse Holdings Inc
TELECOMMUNICATIONS - Diversified Communication Serv
|
$22.60
|
-0.20
-0.88% |
$22.90
|
706,500
96.15% of 50 DAV
50 DAV is 734,800
|
$24.24
-6.77%
|
9/22/2010
|
$23.60
|
PP = $23.87
|
|
MB = $25.06
|
Most Recent Note - 10/6/2010 1:08:06 PM
G - Halted its recent worrisome slide, finding prompt support near its 50 DMA line after 4 consecutive losses. The recent chart low ($21.47) defines important support to watch. Concerns have been raised as its Relative Strength rank has slumped under the 80+ guideline after promptly negating its latest breakout and encountering distributional pressure.
>>> The latest Featured Stock Update with an annotated graph appeared on 9/22/2010. Click here.
View all notes |
Alert me of new notes |
CANSLIM.net Company Profile |
SEC |
Zacks Reports |
StockTalk |
News |
Chart |
Request a new note
C
A N
S L
I M
|
Symbol/Exchange
Company Name
Industry Group |
PRICE |
CHANGE
(%Change) |
Day High |
Volume
(% DAV)
(% 50 day avg vol) |
52 Wk Hi
% From Hi |
Featured
Date |
Price
Featured |
Pivot Featured |
|
Max Buy |
UA
-
NYSE
Under Armour Inc Cl A
CONSUMER NON-DURABLES - Textile - Apparel Clothing
|
$46.22
|
+1.63
3.66% |
$46.82
|
876,776
117.91% of 50 DAV
50 DAV is 743,600
|
$47.00
-1.66%
|
9/9/2010
|
$39.99
|
PP = $40.10
|
|
MB = $42.11
|
Most Recent Note - 10/8/2010 3:38:48 PM
G - Big gain today with volume slightly above average volume has it poised for a new 2010 high close. It is extended from its latest sound base pattern after a considerable streak of gains.
>>> The latest Featured Stock Update with an annotated graph appeared on 9/9/2010. Click here.
View all notes |
Alert me of new notes |
CANSLIM.net Company Profile |
SEC |
Zacks Reports |
StockTalk |
News |
Chart |
Request a new note
C
A N
S L
I M
|
UFPT
-
NASDAQ
U F P Tech Inc
CONSUMER NON-DURABLES - Packaging and Containers
|
$12.23
|
+0.28
2.34% |
$12.32
|
44,679
80.94% of 50 DAV
50 DAV is 55,200
|
$13.20
-7.35%
|
9/16/2010
|
$11.20
|
PP = $11.69
|
|
MB = $12.27
|
Most Recent Note - 10/8/2010 3:47:28 PM
G - Consolidating above prior chart highs after dipping under its "max buy" level this week following a streak of 6 consecutive gains with above average volume.
>>> The latest Featured Stock Update with an annotated graph appeared on 9/17/2010. Click here.
View all notes |
Alert me of new notes |
CANSLIM.net Company Profile |
SEC |
Zacks Reports |
StockTalk |
News |
Chart |
Request a new note
C
A N
S L
I M
|
ULTA
-
NASDAQ
Ulta Salon Cosm & Frag
SPECIALTY RETAIL - Specialty Retail, Other
|
$28.96
|
+0.43
1.51% |
$29.09
|
373,221
59.67% of 50 DAV
50 DAV is 625,500
|
$30.19
-4.07%
|
9/3/2010
|
$26.36
|
PP = $25.89
|
|
MB = $27.18
|
Most Recent Note - 10/4/2010 2:15:09 PM
G - Down today with below average volume. Quietly consolidating well above prior highs in the $26 area that define support to watch now.
>>> The latest Featured Stock Update with an annotated graph appeared on 9/3/2010. Click here.
View all notes |
Alert me of new notes |
CANSLIM.net Company Profile |
SEC |
Zacks Reports |
StockTalk |
News |
Chart |
Request a new note
C
A N
S L
I M
|
VIT
-
NYSE
Vanceinfo Tech Inc Ads
COMPUTER SOFTWARE and SERVICES - Business Software and Services
|
$31.70
|
+0.09
0.28% |
$31.85
|
455,698
71.68% of 50 DAV
50 DAV is 635,700
|
$33.30
-4.80%
|
7/8/2010
|
$25.20
|
PP = $26.58
|
|
MB = $27.91
|
Most Recent Note - 10/5/2010 6:12:24 PM
G - Still holding its ground stubbornly at its all-time high. It is extended after rallying from a prior resistance level in the $26 area. Its 50 DMA line defines chart support to watch.
>>> The latest Featured Stock Update with an annotated graph appeared on 8/31/2010. Click here.
View all notes |
Alert me of new notes |
CANSLIM.net Company Profile |
SEC |
Zacks Reports |
StockTalk |
News |
Chart |
Request a new note
C
A N
S L
I M
|
WCRX
-
NASDAQ
Warner Chilcott Plc
DRUGS - Drug Manufacturers - Other
|
$22.28
|
+0.39
1.78% |
$22.41
|
2,207,723
80.58% of 50 DAV
50 DAV is 2,739,900
|
$23.53
-5.31%
|
8/23/2010
|
$21.04
|
PP = $20.84
|
|
MB = $21.88
|
Most Recent Note - 10/8/2010 3:56:32 PM
G - Up today with below average volume for a 4th consecutive small gain. Signs of more worrisome distributional pressure contributed to its slump near prior highs and its 50 DMA line defining chart support in the $20-21 area.
>>> The latest Featured Stock Update with an annotated graph appeared on 8/23/2010. Click here.
View all notes |
Alert me of new notes |
CANSLIM.net Company Profile |
SEC |
Zacks Reports |
StockTalk |
News |
Chart |
Request a new note
C
A N
S L
I M
|
Symbol/Exchange
Company Name
Industry Group |
PRICE |
CHANGE
(%Change) |
Day High |
Volume
(% DAV)
(% 50 day avg vol) |
52 Wk Hi
% From Hi |
Featured
Date |
Price
Featured |
Pivot Featured |
|
Max Buy |