You are not logged in.
This means you
CAN ONLY VIEW reports that were published prior to Monday, April 14, 2025.
You
MUST UPGRADE YOUR MEMBERSHIP if you want to see any current reports.
AFTER MARKET UPDATE - THURSDAY, OCTOBER 8TH, 2009
Previous After Market Report Next After Market Report >>>
|
|
|
|
DOW |
+61.29 |
9,786.87 |
+0.63% |
|
Volume |
1,277,967,860 |
+17% |
|
Volume |
2,446,623,780 |
+9% |
|
NASDAQ |
+13.60 |
2,123.93 |
+0.64% |
|
Advancers |
2,199 |
71% |
|
Advancers |
1,552 |
55% |
|
S&P 500 |
+7.90 |
1,065.48 |
+0.75% |
|
Decliners |
819 |
26% |
|
Decliners |
1,153 |
41% |
|
Russell 2000 |
+5.67 |
607.75 |
+0.94% |
|
52 Wk Highs |
396 |
|
|
52 Wk Highs |
164 |
|
|
S&P 600 |
+3.43 |
319.50 |
+1.09% |
|
52 Wk Lows |
2 |
|
|
52 Wk Lows |
7 |
|
|
 |
Gains On Better Volume Bring Expansion In New Highs List
Adam Sarhan, Contributing Writer,
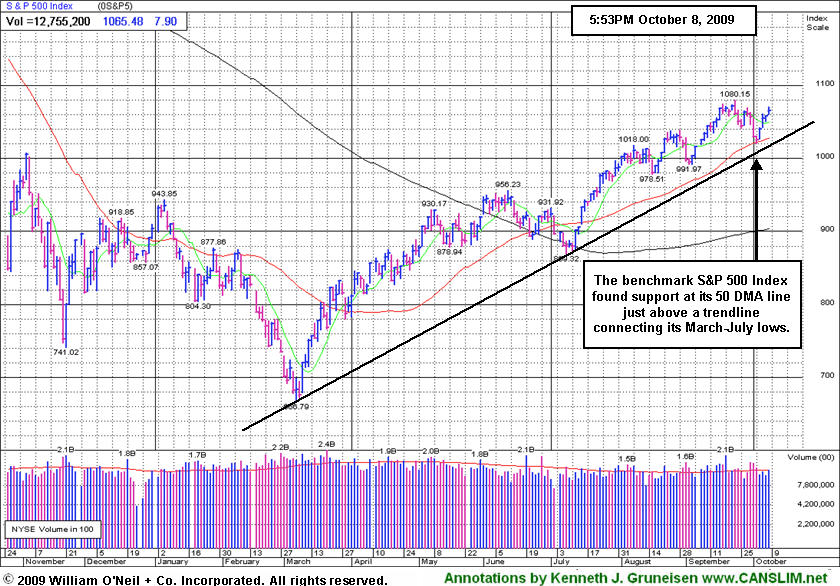
The major averages rallied on Thursday thanks to another decline in the dollar, Alcoa's stronger than expected Q3 results, and a surprise jump in retail sales. Volume was reported higher than Wednesday's levels, which is considered a somewhat encouraging sign of institutional sponsorship. Advancers led decliners by more than a 2-to-1 ratio on the NYSE and by about a 4-to-3 ratio on the Nasdaq exchange. There were 57 high-ranked companies from the CANSLIM.net Leaders List that made a new 52-week high and appeared on the CANSLIM.net BreakOuts Page, higher than the 36 issues that appeared on the prior session. New 52-week highs were in the triple digits and substantially outnumbered new 52-week lows which were in the single digits on both major exchanges. The recent expansion in the new highs list is another encouraging sign of healthier market action, as any sustainable market rally requires a healthy crop of strong leaders.
Alcoa (AA +1.06%), the country's largest aluminum producer, rallied after setting the stage for another stronger-than-expected earnings season. On average, nearly 75% of companies topped analysts estimates when they reported their second quarter results. The actual numbers were not as impressive as the fact that the vast majority topped the Street's forecast. Only time will tell how stocks will react to the third quarter's results.
Elsewhere, housing stocks caught a bid after Treasury Secretary Timothy Geithner said the housing market is improving and House Speaker Nancy Pelosi said Congress will consider extending a tax-credit for home buyers. The government reported that first-time jobless claims fell to 521,000 last week, which was the lowest level since January and lower than the Street's estimate of 540,000 claims. Stocks advanced after retail sales rose for the first time in 13 months as discounts continued to attract shoppers. Retail Metrics released a report that showed sales at US chains open at least a year rose +1.1% last month and nearly seventy percent of retailers reported sales results that exceeded the average of estimates it has compiled. The US dollar fell again, which sparked a rally in commodities and helped send gold to another new all-time high.
PICTURED: The S&P 500 Index found support at its 50-day moving average (DMA) line just above a trendline connecting its March-July lows.
|
|
|
 |
Energy Group Led Gainers As OSX Blasted To New 2009 High
Kenneth J. Gruneisen - Passed the CAN SLIM® Master's Exam
Energy related shares were standout gainers as the Oil Services Index ($OSX +3.31%) and Integrated Oil Index ($XOI +1.94%) powered higher. The Gold & Silver Index ($XAU +1.38%) also rose while the gold hit a new record high of $1,062.70 per ounce. Meanwhile, another defensive area, the Healthcare Index ($HMO -3.47%) was a standout laggard on Thursday, sinking further below its 50-day moving average (DMA) line. The Biotechnology Index ($BTK -0.68%) and Semiconductor Index ($SOX -0.50%) ended with modest losses while there were small gains for the tech sector's Internet Index ($IIX +0.16%) and Networking Index ($NWX +0.62%). The Retail Index ($RLX +1.84%) and Broker/Dealer Index ($XBD +1.19%) had a positive influence on the major indices, but the Bank Index ($BKX -0.25%) paused.
Charts courtesy www.stockcharts.com
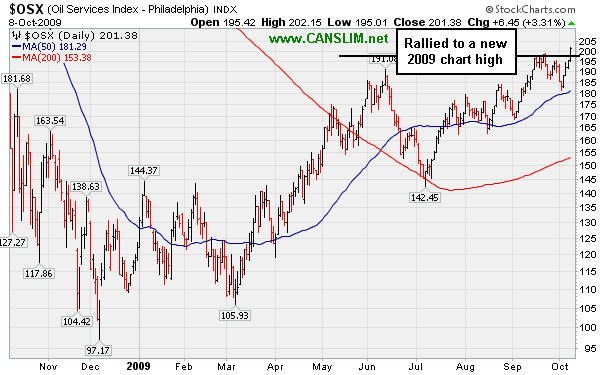
PICTURED: The Oil Services Index ($OSX +3.31%) rallied to a new 2009 chart high on Thursday.
| Oil Services |
$OSX |
201.38 |
+6.45 |
+3.31% |
+65.90% |
| Healthcare |
$HMO |
1,123.17 |
-40.32 |
-3.47% |
+16.97% |
| Integrated Oil |
$XOI |
1,053.71 |
+20.04 |
+1.94% |
+7.56% |
| Semiconductor |
$SOX |
316.06 |
-1.58 |
-0.50% |
+48.97% |
| Networking |
$NWX |
234.77 |
+1.44 |
+0.62% |
+63.16% |
| Internet |
$IIX |
219.69 |
+0.35 |
+0.16% |
+64.23% |
| Broker/Dealer |
$XBD |
123.01 |
+1.45 |
+1.19% |
+58.78% |
| Retail |
$RLX |
386.86 |
+6.98 |
+1.84% |
+38.53% |
| Gold & Silver |
$XAU |
177.22 |
+2.42 |
+1.38% |
+43.09% |
| Bank |
$BKX |
46.96 |
-0.12 |
-0.25% |
+5.96% |
| Biotech |
$BTK |
901.19 |
-6.13 |
-0.68% |
+39.25% |
|
|
|
 |
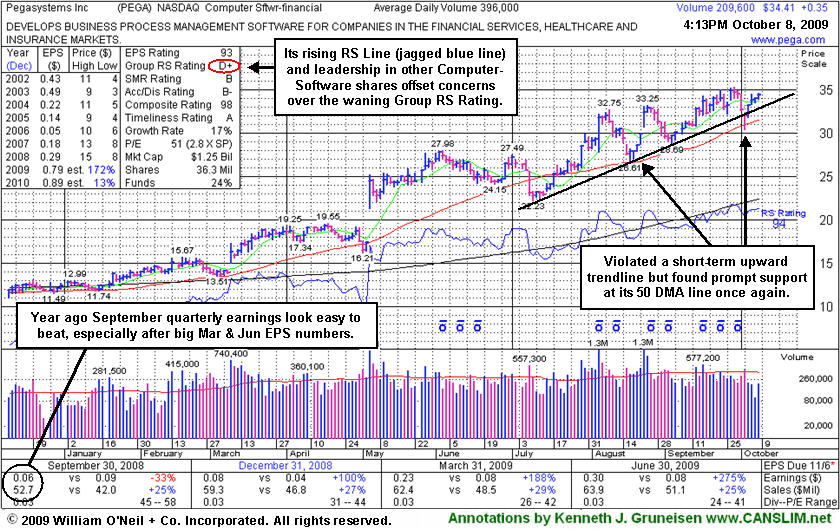
Software Firm Hovering In Close Striking Distance of All-Time Highs
Kenneth J. Gruneisen - Passed the CAN SLIM® Master's Exam
Pegasystems Inc (PEGA +$0.35 or +1.02% to $34.41) posted a 4th consecutive gain on light volume today, rallying toward all-time highs after its latest test of support at its 50-day moving average (DMA) line. Since its last FSU section appearance the high-ranked Computer Software - Financial firm briefly violated an upward trendline connecting its July-September chart lows, an initial chart support level. The group's RS Rating (see red circle) was also previously noted for having slumped to D+ from a B when PEGA first triggered a technical buy signal as its broke out from a "double bottom" base when featured in the 7/29/09 mid-day report (read here). However, the stock has a 94 Relative Strength rank now, and it is a reassuring sign to see its Relative Strength line (the jagged blue line) recently rising above its August highs.
PEGA has shown solid sales revenues increases and +25% earnings increases in the 3 last quarterly comparisons versus the year ago period. It also appears to have an easy comparison in the upcoming report for the quarter ended September 30, 2009 versus the year ago period's earnings of only 6 cents per share. The previously noted downturn in annual earnings (the A criteria) from 2003 to 2006 has been followed by a solid turn around and big earnings increases in '07 and '08, and Street expectations for '09 are calling for well above +25% growth.
|
|
|
Color Codes Explained :
Y - Better candidates highlighted by our
staff of experts.
G - Previously featured
in past reports as yellow but may no longer be buyable under the
guidelines.
***Last / Change / Volume quote data in this table corresponds with the timestamp on the note***
Symbol/Exchange
Company Name
Industry Group |
Last |
Chg. |
Vol
% DAV |
Date Featured |
Price Featured |
Latest Pivot Point
Featured |
Status |
| Latest Max Buy Price |
ARO
- NYSE
Aeropostale Inc
RETAIL - Apparel Stores
|
$42.77
|
-0.20
|
3,792,400
143% DAV
2,654,400
|
8/21/2009
(Date
Featured) |
$39.21
(Price
Featured) |
PP = $38.84 |
G |
| MB = $40.78 |
Most Recent Note - 10/8/2009 4:50:06 PM
G - Gapped up today but then encountered distributional pressure and negatively reversed for a loss with above average volume. Still trading less than -5% from its all-time highs, this high-ranked leader in the Retail - Clothing/shoe group is consolidating above support at its 50 DMA line, with additional support at prior highs in the $38 area. It was featured in yellow in the 8/21/09 Mid-Day BreakOuts Report (read here).
>>> The latest Featured Stock Update with an annotated graph appeared on 10/6/2009. click here.
|
|
C
A
S
I |
News |
Chart |
SEC
View all notes Alert
me of new notes
Company
Profile
|
ARST
-
|
$22.71
|
-0.27
|
513,194
79% DAV
653,400
|
9/1/2009
(Date
Featured) |
$19.91
(Price
Featured) |
PP = $20.90 |
G |
| MB = $21.95 |
Most Recent Note - 10/8/2009 5:02:32 PM
G - Quietly consolidating, hovering less than -8% off the all-time high it hit last week. On 10/02/09 it traded down near 4-week lows and then positively reversed and closed near the session high amid widespread market weakness. As previously noted, "Recent lows may be considered an initial support level. Prior chart highs and its 50 DMA line, coinciding in the $20 area, define an important technical support level to watch on pullbacks."
>>> The latest Featured Stock Update with an annotated graph appeared on 10/2/2009. click here.
|
|
C
A
S
I |
News |
Chart |
SEC
View all notes Alert
me of new notes
Company
Profile
|
BIDU
- NASDAQ
Baidu Inc Ads
INTERNET - Internet Information Providers
|
$412.67
|
-1.13
|
2,285,823
137% DAV
1,671,500
|
9/8/2009
(Date
Featured) |
$351.80
(Price
Featured) |
PP = $368.59 |
G |
| MB = $387.02 |
Most Recent Note - 10/8/2009 5:04:50 PM
G - Hit another new 2009 high today then negatively reversed following 2 consecutive gains on above average volume. Recently found prompt support after consolidating near its prior chart highs and pivot point, meanwhile staying well above its 50 DMA line. BIDU was featured in yellow in the 9/08/09 Mid-Day BreakOuts Report (read here).
>>> The latest Featured Stock Update with an annotated graph appeared on 10/7/2009. click here.
|
|
C
A
S
I |
News |
Chart |
SEC
View all notes Alert
me of new notes
Company
Profile
|
CACC
- NASDAQ
Credit Acceptance Corp
FINANCIAL SERVICES - Credit Services
|
$35.22
|
+0.13
|
33,529
76% DAV
44,100
|
9/29/2009
(Date
Featured) |
$33.48
(Price
Featured) |
PP = $32.60 |
G |
| MB = $34.23 |
Most Recent Note - 10/8/2009 5:20:48 PM
G - Ended at its session low today with a small gain on light volume. It hit another new all-time high above its "max buy" level. Color code was changed to green as it got extended from its prior base. The Finance - Consumer/Commercial Loans firm has maintained a great track record of annual and quarterly sales revenues and earnings increases. It was featured on 9/29/09 in yellow in the mid-day report (read here).
>>> The latest Featured Stock Update with an annotated graph appeared on 9/29/2009. click here.
|
|
C
A
S
I |
News |
Chart |
SEC
View all notes Alert
me of new notes
Company
Profile
|
CRM
- NYSE
Salesforce.com Inc
INTERNET - Internet Software & Services
|
$60.36
|
+1.92
|
2,360,818
113% DAV
2,091,900
|
8/16/2009
(Date
Featured) |
$47.12
(Price
Featured) |
PP = $45.59 |
G |
| MB = $47.87 |
Most Recent Note - 10/8/2009 5:30:03 PM
G - Posted another considerable gain with slightly above average volume for a new 2009 high close. Prior highs in the $55 area acted as an initial support level. More substantial technical support to watch is at its upward trendline and 50 DMA line now coinciding in the $51 area.
>>> The latest Featured Stock Update with an annotated graph appeared on 10/5/2009. click here.
|
|
C
A
S
I |
News |
Chart |
SEC
View all notes Alert
me of new notes
Company
Profile
|
EBIX
- NASDAQ
Ebix Inc
COMPUTER SOFTWARE & SERVICES - Business Software & Services
|
$56.71
|
+1.56
|
255,163
143% DAV
178,200
|
8/28/2009
(Date
Featured) |
$45.86
(Price
Featured) |
PP = $45.35 |
G |
| MB = $47.62 |
Most Recent Note - 10/8/2009 5:32:41 PM
G - Hit a new all-time high today with a gain on higher volume marking its 8th gain in 9 sessions. It has not formed a new sound base since heavy distributional pressure led to a pullback near support at early-August chart highs and its 50 DMA line in the $45 area.
>>> The latest Featured Stock Update with an annotated graph appeared on 9/24/2009. click here.
|
|
C
A
S
I |
News |
Chart |
SEC
View all notes Alert
me of new notes
Company
Profile
|
GMCR
- NASDAQ
Green Mtn Coffee Roastrs
FOOD & BEVERAGE - Processed & Packaged Goods
|
$72.60
|
+0.72
|
939,382
63% DAV
1,490,800
|
10/5/2009
(Date
Featured) |
$71.11
(Price
Featured) |
PP = $75.89 |
Y |
| MB = $79.68 |
Most Recent Note - 10/8/2009 5:35:35 PM
Y - Posted a 4th consecutive gain on light volume today, quietly hovering near all-time highs after bouncing near its July-September highs. It has formed a cup-with-high-handle pattern, and its color code was changed to yellow with new pivot point and max buy levels noted. Disciplined investors will watch for volume-driven gains to trigger a new technical buy signal before making any initial buys or add-on purchases.
>>> The latest Featured Stock Update with an annotated graph appeared on 9/23/2009. click here.
|
|
C
A
S
I |
News |
Chart |
SEC
View all notes Alert
me of new notes
Company
Profile
|
NTES
- NASDAQ
Netease Inc Adr
INTERNET - Internet Information Providers
|
$41.69
|
-2.74
|
3,177,208
166% DAV
1,912,100
|
9/23/2009
(Date
Featured) |
$47.11
(Price
Featured) |
PP = $47.04 |
G |
| MB = $49.39 |
Most Recent Note - 10/8/2009 5:42:29 PM
G- Triggered a technical sell signal with its loss today on above average volume that more decisively violated its 50 DMA line and the upward trendline connecting its July-September chart lows. Subsequent deterioration under its August lows could complete a worrisome "double top" pattern which would have bearish implications. Color code was changed to green based on promptly negating its latest breakout and then trading more than -7% below its pivot point.
>>> The latest Featured Stock Update with an annotated graph appeared on 9/25/2009. click here.
|
|
C
A
S
I |
News |
Chart |
SEC
View all notes Alert
me of new notes
Company
Profile
|
NVEC
- NASDAQ
N V E Corp
ELECTRONICS - Semiconductor - Specialized
|
$51.00
|
+0.29
|
76,162
92% DAV
83,000
|
8/26/2009
(Date
Featured) |
$55.32
(Price
Featured) |
PP = $57.60 |
G |
| MB = $60.48 |
Most Recent Note - 10/8/2009 5:44:39 PM
G - Erased much of its early gain and closed near the session low today for a small gain. Still hovering near prior chart lows in the $49 area, where any further deterioration (especially if on heavy volume) may negate its 7/23/09 breakaway gap and raise serious concerns, triggering a more worrisome technical sell signal. Concerns increase the longer it struggles below its 50 DMA line.
>>> The latest Featured Stock Update with an annotated graph appeared on 9/30/2009. click here.
|
|
C
A
S
I |
News |
Chart |
SEC
View all notes Alert
me of new notes
Company
Profile
|
PEGA
- NASDAQ
Pegasystems Inc
COMPUTER SOFTWARE & SERVICES - Business Software & Services
|
$34.41
|
+0.35
|
210,637
53% DAV
396,000
|
9/9/2009
(Date
Featured) |
$31.14
(Price
Featured) |
PP = $33.35 |
Y |
| MB = $35.02 |
Most Recent Note - 10/8/2009 5:46:10 PM
Y - Posted a 4th consecutive gain on light volume today. This high-ranked Computer Software - Financial firm gapped down on 10/02/09 and traded under its 50 DMA line, then found prompt support. The pullback raised some concerns as it violated an upward trendline connecting its July-September chart lows, an initial support level.
>>> The latest Featured Stock Update with an annotated graph appeared on 10/8/2009. click here.
|
|
C
A
S
I |
News |
Chart |
SEC
View all notes Alert
me of new notes
Company
Profile
|
SWI
- NYSE
Solarwinds Inc
COMPUTER SOFTWARE & SERVICES - Application Software
|
$21.71
|
-0.12
|
247,618
52% DAV
477,600
|
9/30/2029
(Date
Featured) |
$22.03
(Price
Featured) |
PP = $21.72 |
Y |
| MB = $22.81 |
Most Recent Note - 10/8/2009 5:50:35 PM
Y - Initially gapped up for a small gain today but negatively reversed for a loss on light volume. Now consolidating near its 8/04/09 high, the basis for its last pivot point, it tested support at its 50 DMA line recently and then rallied back with light volume gains. It was featured in the October 2009 issue of CANSLIM.net News (read here).
>>> The latest Featured Stock Update with an annotated graph appeared on 9/30/2009. click here.
|
|
C
A
S
I |
News |
Chart |
SEC
View all notes Alert
me of new notes
Company
Profile
|
WNS
- NYSE
W N S Holdings Ltd Ads
DIVERSIFIED SERVICES - Business/Management Services
|
$15.42
|
-0.14
|
32,245
60% DAV
53,400
|
9/28/2009
(Date
Featured) |
$15.28
(Price
Featured) |
PP = $16.10 |
Y |
| MB = $16.91 |
Most Recent Note - 10/8/2009 5:52:27 PM
Y - Quietly consolidating in a tight range this week after recently noted distributional pressure. Perched just above its 50 DMA line and stubbornly holding its ground. Rallied as high as $16.50 on two sessions last week but encountered stubborn resistance after a considerable 9/29/09 gain for a new 52-week high and new high close with volume 11 times its daily average volume. It formed an orderly flat base for at least 5-weeks, and it was featured in yellow in the 9/28/09 mid-day report (read here). Quarterly earnings have been above the +25% guideline and its annual earnings history has been great, satisfying the C & A criteria. However, sales revenues growth has decelerated.
>>> The latest Featured Stock Update with an annotated graph appeared on 9/28/2009. click here.
|
|
C
A
S
I |
News |
Chart |
SEC
View all notes Alert
me of new notes
Company
Profile
|
|
|
|
THESE ARE NOT BUY RECOMMENDATIONS!
Comments contained in the body of this report are technical
opinions only. The material herein has been obtained
from sources believed to be reliable and accurate, however,
its accuracy and completeness cannot be guaranteed.
This site is not an investment advisor, hence it does
not endorse or recommend any securities or other investments.
Any recommendation contained in this report may not
be suitable for all investors and it is not to be deemed
an offer or solicitation on our part with respect to
the purchase or sale of any securities. All trademarks,
service marks and trade names appearing in this report
are the property of their respective owners, and are
likewise used for identification purposes only.
This report is a service available
only to active Paid Premium Members.
You may opt-out of receiving report notifications
at any time. Questions or comments may be submitted
by writing to Premium Membership Services 665 S.E. 10 Street, Suite 201 Deerfield Beach, FL 33441-5634 or by calling 1-800-965-8307
or 954-785-1121.
|
|
|


