***Last / Change / Volume data in this table is the closing quote data***
Symbol/Exchange
Company Name
Industry Group |
PRICE |
CHANGE
(%Change) |
Day High |
Volume
(% DAV)
(% 50 day avg vol) |
52 Wk Hi
% From Hi |
Featured
Date |
Price
Featured |
Pivot Featured |
|
Max Buy |
ABV
-
NYSE
Comp De Bebidas Adr
FOOD and BEVERAGE - Beverages - Brewers
|
$129.94
|
+0.04
0.03% |
$130.60
|
761,149
125.60% of 50 DAV
50 DAV is 606,000
|
$130.55
-0.47%
|
6/29/2010
|
$104.74
|
PP = $109.33
|
|
MB = $114.80
|
Most Recent Note - 10/5/2010 5:47:15 PM
G - This Brazil-based beverage firm hit another new all-time high today with a gap up gain on above average volume. Extended from a sound base, its prior highs in the $111-112 area define support above its 50 DMA line.
>>> The latest Featured Stock Update with an annotated graph appeared on 8/18/2010. Click here.
View all notes |
Alert me of new notes |
CANSLIM.net Company Profile |
SEC |
Zacks Reports |
StockTalk |
News |
Chart |
Request a new note
C
A N
S L
I M


|
ARUN
-
NASDAQ
Aruba Networks Inc
COMPUTER HARDWARE - Networking andamp; Communication Dev
|
$19.59
|
-0.72
-3.55% |
$20.63
|
8,089,558
385.93% of 50 DAV
50 DAV is 2,096,100
|
$22.80
-14.08%
|
8/30/2010
|
$18.12
|
PP = $18.51
|
|
MB = $19.44
|
 Most Recent Note - 10/7/2010 5:22:47 PM
G - Closed near the middle of its intra-day range today after another damaging distributional loss on heavy volume. Repeatedly noted - "Prior highs near $18 and its 50 DMA line define important near-term chart support levels to watch."
>>> The latest Featured Stock Update with an annotated graph appeared on 9/2/2010. Click here.
View all notes |
Alert me of new notes |
CANSLIM.net Company Profile |
SEC |
Zacks Reports |
StockTalk |
News |
Chart |
Request a new note
C
A N
S L
I M
|
ASPS
-
NASDAQ
Altisource Ptf Sltns Sa
REAL ESTATE - Property Management/Developmen
|
$25.40
|
-0.45
-1.74% |
$26.15
|
532,087
412.47% of 50 DAV
50 DAV is 129,000
|
$31.35
-18.98%
|
9/23/2010
|
$28.36
|
PP = $28.90
|
|
MB = $30.35
|
Most Recent Note - 10/7/2010 5:04:47 PM
G - Volume was well above average while slumping further under its 50 DMA and under prior lows in the $26 area to its 200 DMA line. While it may make a stand near that long-term average, based on damaging technical action it will be dropped from the Featured Stocks list tonight. Considerable loss on 10/05/10 was noted - "Heavy volume is indicative of heavy distributional pressure, not the kind of 'light volume pullback' which is healthy and ordinary. It completely negated its recent breakout and slumped back into its prior base, raising concerns and closing near its 50 DMA line. This Luxembourg-based Financial Services firm's small supply (S criteria) of only 18.9 million shares in the public float can contribute to greater volatility in the event of institutional buying or selling."
>>> The latest Featured Stock Update with an annotated graph appeared on 9/23/2010. Click here.
View all notes |
Alert me of new notes |
CANSLIM.net Company Profile |
SEC |
Zacks Reports |
StockTalk |
News |
Chart |
Request a new note
C
A N
S L
I M
|
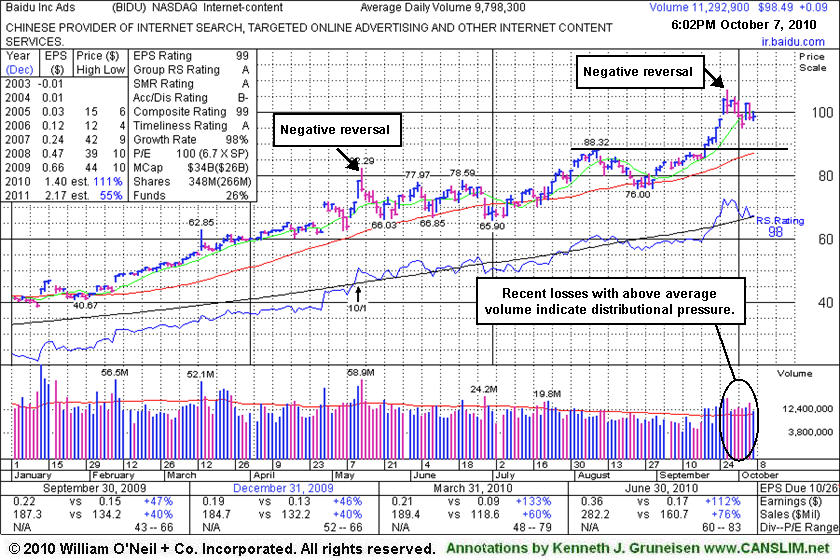
BIDU
-
NASDAQ
Baidu Inc Ads
INTERNET - Internet Information Providers
|
$98.49
|
+0.09
0.09% |
$100.45
|
11,324,253
117.22% of 50 DAV
50 DAV is 9,660,300
|
$107.19
-8.12%
|
9/17/2010
|
$85.73
|
PP = $88.42
|
|
MB = $92.84
|
Most Recent Note - 10/6/2010 12:08:48 PM
G - Perched within close striking distance of its best-ever close ($103.82), it has been repeatedly noted as "extended from any sound base" yet could go on to produce more climactic gains. A subsequent violation of its 10/04/10 low $95.12 would raise concerns, while the nearest chart support is at old highs and its 50 DMA line.
>>> The latest Featured Stock Update with an annotated graph appeared on 10/7/2010. Click here.
View all notes |
Alert me of new notes |
CANSLIM.net Company Profile |
SEC |
Zacks Reports |
StockTalk |
News |
Chart |
Request a new note
C
A N
S L
I M
|
CACC
-
NASDAQ
Credit Acceptance Corp
FINANCIAL SERVICES - Credit Services
|
$58.47
|
+1.38
2.42% |
$59.61
|
34,225
79.41% of 50 DAV
50 DAV is 43,100
|
$63.45
-7.85%
|
7/29/2010
|
$52.04
|
PP = $54.07
|
|
MB = $56.77
|
Most Recent Note - 10/7/2010 5:09:48 PM
G - Posted a gain today and signs of support near that short-term average have been encouraging. Its 50 DMA line may act as resistance, while a convincing rebound above it would help its outlook improve. The old high ($53.97 on 2/01/10) is the next chart support level to watch.
>>> The latest Featured Stock Update with an annotated graph appeared on 9/30/2010. Click here.
View all notes |
Alert me of new notes |
CANSLIM.net Company Profile |
SEC |
Zacks Reports |
StockTalk |
News |
Chart |
Request a new note
C
A N
S L
I M
|
Symbol/Exchange
Company Name
Industry Group |
PRICE |
CHANGE
(%Change) |
Day High |
Volume
(% DAV)
(% 50 day avg vol) |
52 Wk Hi
% From Hi |
Featured
Date |
Price
Featured |
Pivot Featured |
|
Max Buy |
CMG
-
NYSE
Chipotle Mexican Grill
LEISURE - Restaurants
|
$177.01
|
+2.19
1.25% |
$177.50
|
641,736
105.15% of 50 DAV
50 DAV is 610,300
|
$179.50
-1.39%
|
9/1/2010
|
$158.31
|
PP = $155.52
|
|
MB = $163.30
|
Most Recent Note - 10/5/2010 5:38:27 PM
G - Gapped up and rallied to a new all-time high today with above average volume. Extended from prior highs in the $155 area that define chart support.
>>> The latest Featured Stock Update with an annotated graph appeared on 9/1/2010. Click here.
View all notes |
Alert me of new notes |
CANSLIM.net Company Profile |
SEC |
Zacks Reports |
StockTalk |
News |
Chart |
Request a new note
C
A N
S L
I M
|
CTRP
-
NASDAQ
Ctrip.Com Intl Ltd Adr
LEISURE - Resorts and Casinos
|
$46.52
|
+0.45
0.98% |
$46.55
|
1,147,426
64.94% of 50 DAV
50 DAV is 1,766,900
|
$49.23
-5.51%
|
9/24/2010
|
$46.75
|
PP = $47.11
|
|
MB = $49.47
|
Most Recent Note - 10/6/2010 6:34:52 PM
Y - Down today with average volume, slumping below its pivot point again. More damaging losses would raise greater concerns, as healthy stocks do not typically slump more than -7% below their pivot point after breaking out.
>>> The latest Featured Stock Update with an annotated graph appeared on 9/28/2010. Click here.
View all notes |
Alert me of new notes |
CANSLIM.net Company Profile |
SEC |
Zacks Reports |
StockTalk |
News |
Chart |
Request a new note
C
A N
S L
I M
|
EBIX
-
NASDAQ
Ebix Inc
COMPUTER SOFTWARE and SERVICES - Business Software and Services
|
$23.39
|
+0.11
0.47% |
$23.58
|
899,243
166.80% of 50 DAV
50 DAV is 539,100
|
$25.61
-8.67%
|
9/23/2010
|
$21.78
|
PP = $22.74
|
|
MB = $23.88
|
Most Recent Note - 10/6/2010 12:15:18 PM
G - Hit another new high today. Held its ground stubbornly following a recent streak of consecutive gains with heavy volume. As previously noted -"It could go on to produce more climactic gains, but it is extended from an ideal base. Recent highs near $20 define chart support to watch."
>>> The latest Featured Stock Update with an annotated graph appeared on 9/24/2010. Click here.
View all notes |
Alert me of new notes |
CANSLIM.net Company Profile |
SEC |
Zacks Reports |
StockTalk |
News |
Chart |
Request a new note
C
A N
S L
I M
|
EGO
-
NYSE
Eldorado Gold Corp
METALS and MINING - Gold
|
$18.36
|
-0.72
-3.77% |
$19.16
|
5,694,621
122.77% of 50 DAV
50 DAV is 4,638,400
|
$20.23
-9.24%
|
8/19/2010
|
$18.25
|
PP = $19.17
|
|
MB = $20.13
|
Most Recent Note - 10/7/2010 4:57:41 PM
Y - Reversed for a loss with +22% above average volume after a gap up today, closing just pennies under its 50 DMA line and still above recent low closes. Previously noted - "A damaging violation of that important short-term average or breach of its recent chart low ($17.65 on 9/28/10) would raise concerns and trigger technical sell signals."
>>> The latest Featured Stock Update with an annotated graph appeared on 8/19/2010. Click here.
View all notes |
Alert me of new notes |
CANSLIM.net Company Profile |
SEC |
Zacks Reports |
StockTalk |
News |
Chart |
Request a new note
C
A N
S L
I M
|
FFIV
-
NASDAQ
F 5 Networks Inc
INTERNET - Internet Software and Services
|
$98.98
|
+1.44
1.48% |
$100.88
|
5,800,807
356.18% of 50 DAV
50 DAV is 1,628,600
|
$112.05
-11.66%
|
6/16/2010
|
$74.50
|
PP = $74.10
|
|
MB = $77.81
|
Most Recent Note - 10/7/2010 5:37:18 PM
G - Overcame early weakness today and closed with a gain on above average volume after violating an upward trendline connecting July-August lows and trading near its 50 DMA line intra-day. Further deterioration would raise greater concerns and trigger technical sell signals.
>>> The latest Featured Stock Update with an annotated graph appeared on 9/13/2010. Click here.
View all notes |
Alert me of new notes |
CANSLIM.net Company Profile |
SEC |
Zacks Reports |
StockTalk |
News |
Chart |
Request a new note
C
A N
S L
I M
|
Symbol/Exchange
Company Name
Industry Group |
PRICE |
CHANGE
(%Change) |
Day High |
Volume
(% DAV)
(% 50 day avg vol) |
52 Wk Hi
% From Hi |
Featured
Date |
Price
Featured |
Pivot Featured |
|
Max Buy |
FOSL
-
NASDAQ
Fossil Inc
CONSUMER DURABLES - Recreational Goods, Other
|
$54.68
|
+1.71
3.23% |
$54.97
|
937,594
116.59% of 50 DAV
50 DAV is 804,200
|
$54.76
-0.15%
|
8/10/2010
|
$45.54
|
PP = $42.69
|
|
MB = $44.82
|
Most Recent Note - 10/7/2010 5:12:02 PM
G - Gain today with above average volume for its best-ever close. An upward trendline defines initial support to watch after it has been repeatedly noted as "extended from any sound base."
>>> The latest Featured Stock Update with an annotated graph appeared on 10/5/2010. Click here.
View all notes |
Alert me of new notes |
CANSLIM.net Company Profile |
SEC |
Zacks Reports |
StockTalk |
News |
Chart |
Request a new note
C
A N
S L
I M
|
HMSY
-
NASDAQ
H M S Holdings Corp
COMPUTER SOFTWARE and SERVICES - Healthcare Information Service
|
$60.37
|
-0.02
-0.03% |
$61.11
|
120,589
62.71% of 50 DAV
50 DAV is 192,300
|
$60.74
-0.61%
|
9/27/2010
|
$57.97
|
PP = $58.36
|
|
MB = $61.28
|
Most Recent Note - 10/5/2010 6:03:43 PM
Y - Gain on light volume today for a new high, inching higher without great volume conviction behind gains since 9/27/10 when featured in yellow.
>>> The latest Featured Stock Update with an annotated graph appeared on 9/27/2010. Click here.
View all notes |
Alert me of new notes |
CANSLIM.net Company Profile |
SEC |
Zacks Reports |
StockTalk |
News |
Chart |
Request a new note
C
A N
S L
I M
|
HS
-
NYSE
Healthspring Inc
HEALTH SERVICES - Health Care Plans
|
$25.67
|
+0.08
0.31% |
$26.22
|
617,768
81.25% of 50 DAV
50 DAV is 760,300
|
$27.00
-4.93%
|
8/27/2010
|
$19.91
|
PP = $19.75
|
|
MB = $20.74
|
Most Recent Note - 10/5/2010 5:39:40 PM
G - Consolidating after a recent streak of 9 consecutive gains. Support to watch is prior chart highs in the $19-20 area. Disciplined investors do not chase stocks that are extended from a sound base.
>>> The latest Featured Stock Update with an annotated graph appeared on 8/27/2010. Click here.
View all notes |
Alert me of new notes |
CANSLIM.net Company Profile |
SEC |
Zacks Reports |
StockTalk |
News |
Chart |
Request a new note
C
A N
S L
I M
|
IGTE
-
NASDAQ
Igate Corp
COMPUTER SOFTWARE and SERVICES - Information Technology Service
|
$17.19
|
-0.29
-1.64% |
$17.59
|
538,487
140.71% of 50 DAV
50 DAV is 382,700
|
$19.45
-11.62%
|
9/8/2010
|
$17.29
|
PP = $18.26
|
|
MB = $19.17
|
Most Recent Note - 10/5/2010 5:56:13 PM
Y - Gain today on lighter volume after 4 consecutive losses, and it still below its pivot point. Trading just above important chart support at its 50 DMA line. More damaging losses would raise concerns and trigger technical sell signals.
>>> The latest Featured Stock Update with an annotated graph appeared on 9/10/2010. Click here.
View all notes |
Alert me of new notes |
CANSLIM.net Company Profile |
SEC |
Zacks Reports |
StockTalk |
News |
Chart |
Request a new note
C
A N
S L
I M
|
JOBS
-
NASDAQ
Fifty One Job Inc Ads
DIVERSIFIED SERVICES - Staffing and; Outsourcing Service
|
$36.26
|
-1.34
-3.56% |
$37.60
|
269,850
178.47% of 50 DAV
50 DAV is 151,200
|
$40.50
-10.47%
|
9/16/2010
|
$31.59
|
PP = $30.40
|
|
MB = $31.92
|
Most Recent Note - 10/7/2010 10:20:33 AM
G - Down today for a 3rd consecutive loss following a recent streak of volume-driven gains. Noted recently as - "Very extended from a sound base. Prior highs in the $30 area define chart support."
>>> The latest Featured Stock Update with an annotated graph appeared on 9/16/2010. Click here.
View all notes |
Alert me of new notes |
CANSLIM.net Company Profile |
SEC |
Zacks Reports |
StockTalk |
News |
Chart |
Request a new note
C
A N
S L
I M
|
Symbol/Exchange
Company Name
Industry Group |
PRICE |
CHANGE
(%Change) |
Day High |
Volume
(% DAV)
(% 50 day avg vol) |
52 Wk Hi
% From Hi |
Featured
Date |
Price
Featured |
Pivot Featured |
|
Max Buy |
MELI
-
NASDAQ
Mercadolibre Inc
INTERNET - Internet Software and; Services
|
$64.45
|
+0.13
0.20% |
$65.39
|
914,449
106.02% of 50 DAV
50 DAV is 862,500
|
$76.81
-16.09%
|
5/13/2010
|
$54.21
|
PP = $55.85
|
|
MB = $58.64
|
Most Recent Note - 10/6/2010 6:20:27 PM
G - Slumped further below its 50 DMA line today with above average volume behind another damaging loss. Weakness triggered technical sell signals after recently noted - "It may find support near that important short-term average and continue its ascent, but steep declines in the past (best viewed on a weekly chart) are a reminder to always use proper trading discipline."
>>> The latest Featured Stock Update with an annotated graph appeared on 8/26/2010. Click here.
View all notes |
Alert me of new notes |
CANSLIM.net Company Profile |
SEC |
Zacks Reports |
StockTalk |
News |
Chart |
Request a new note
C
A N
S L
I M
|
MRX
-
NYSE
Medicis Pharmaceut Cl A
DRUGS - Biotechnology
|
$29.83
|
-0.10
-0.33% |
$30.19
|
1,021,000
91.30% of 50 DAV
50 DAV is 1,118,300
|
$30.64
-2.64%
|
8/12/2010
|
$26.88
|
PP = $26.71
|
|
MB = $28.05
|
Most Recent Note - 10/5/2010 3:58:03 PM
G - Gapped up today rallying for a considerable gain, and hitting a new 52-week high. An upward trendline shown in the latest FSU section analysis defines an initial chart support level to watch.
>>> The latest Featured Stock Update with an annotated graph appeared on 10/4/2010. Click here.
View all notes |
Alert me of new notes |
CANSLIM.net Company Profile |
SEC |
Zacks Reports |
StockTalk |
News |
Chart |
Request a new note
C
A N
S L
I M
|
MWIV
-
NASDAQ
M W I Veterinary Supply
HEALTH SERVICES - Medical Instruments and; Supplies
|
$58.58
|
+0.37
0.64% |
$59.47
|
28,867
40.89% of 50 DAV
50 DAV is 70,600
|
$58.94
-0.61%
|
7/29/2010
|
$52.05
|
PP = $52.09
|
|
MB = $54.69
|
Most Recent Note - 10/5/2010 3:42:13 PM
G - Considerable gain today without great volume conviction thus far has it poised for its best-ever close (above the $57.97 close from 9/29/10). No overhead supply remains to act as resistance. Its nearby 50 DMA line defines chart support.
>>> The latest Featured Stock Update with an annotated graph appeared on 9/7/2010. Click here.
View all notes |
Alert me of new notes |
CANSLIM.net Company Profile |
SEC |
Zacks Reports |
StockTalk |
News |
Chart |
Request a new note
C
A N
S L
I M
|
NEM
-
NYSE
Newmont Mining Corp
METALS and MINING - Gold
|
$63.03
|
-1.69
-2.61% |
$65.17
|
10,332,650
166.51% of 50 DAV
50 DAV is 6,205,300
|
$65.50
-3.77%
|
8/31/2010
|
$61.32
|
PP = $63.48
|
|
MB = $66.65
|
Most Recent Note - 10/7/2010 1:01:57 PM
Y - Loss today with higher volume raises concerns, sinking under its pivot point again after stalling just shy of its best-ever close. While leadership in the Mining - Gold/Silver/Gems group (L criteria) is a nice reassurance, its Relative Strength rank (81) and RS line have been waning for several weeks. It churned a lot of volume but made little price progress since first featured in a Stock Bulletin on 6/22/10 (read here).
>>> The latest Featured Stock Update with an annotated graph appeared on 9/14/2010. Click here.
View all notes |
Alert me of new notes |
CANSLIM.net Company Profile |
SEC |
Zacks Reports |
StockTalk |
News |
Chart |
Request a new note
C
A N
S L
I M
|
NEOG
-
NASDAQ
Neogen Corp
DRUGS - Diagnostic Substances
|
$33.63
|
-0.09
-0.27% |
$34.15
|
56,705
54.32% of 50 DAV
50 DAV is 104,400
|
$34.76
-3.25%
|
9/1/2010
|
$30.79
|
PP = $30.49
|
|
MB = $32.01
|
Most Recent Note - 10/5/2010 5:52:47 PM
G - Consolidating and recently enduring mild distributional pressure after getting extended from a sound base. Prior highs in the $30 area define initial support to watch.
>>> The latest Featured Stock Update with an annotated graph appeared on 8/20/2010. Click here.
View all notes |
Alert me of new notes |
CANSLIM.net Company Profile |
SEC |
Zacks Reports |
StockTalk |
News |
Chart |
Request a new note
C
A N
S L
I M
|
Symbol/Exchange
Company Name
Industry Group |
PRICE |
CHANGE
(%Change) |
Day High |
Volume
(% DAV)
(% 50 day avg vol) |
52 Wk Hi
% From Hi |
Featured
Date |
Price
Featured |
Pivot Featured |
|
Max Buy |
NFLX
-
NASDAQ
Netflix Inc
SPECIALTY RETAIL - Music and Video Stores
|
$151.43
|
+1.16
0.77% |
$154.06
|
4,109,616
72.35% of 50 DAV
50 DAV is 5,679,900
|
$174.40
-13.17%
|
8/10/2010
|
$124.05
|
PP = $124.00
|
|
MB = $130.20
|
Most Recent Note - 10/6/2010 6:32:56 PM
G - Down today with above average volume, enduring distributional pressure after an impressive sprint to new highs in recent months. Following its recently noted "negative reversal", today it violated the upward trendline shown in the latest FSU analysis, raising greater concerns. Its 50 DMA line is the next chart support level to watch.
>>> The latest Featured Stock Update with an annotated graph appeared on 10/1/2010. Click here.
View all notes |
Alert me of new notes |
CANSLIM.net Company Profile |
SEC |
Zacks Reports |
StockTalk |
News |
Chart |
Request a new note
C
A N
S L
I M
|
NTAP
-
NASDAQ
Netapp Inc
COMPUTER HARDWARE - Data Storage Devices
|
$48.28
|
+0.58
1.22% |
$48.64
|
9,399,626
113.88% of 50 DAV
50 DAV is 8,254,200
|
$51.40
-6.07%
|
9/8/2010
|
$46.98
|
PP = $44.99
|
|
MB = $47.24
|
Most Recent Note - 10/6/2010 6:15:32 PM
G - Damaging loss today on heavy volume was another clear sign of distributional pressure after repeatedly noted as "extended from a sound base." Support to watch is at prior chart highs near its latest pivot point.
>>> The latest Featured Stock Update with an annotated graph appeared on 9/8/2010. Click here.
View all notes |
Alert me of new notes |
CANSLIM.net Company Profile |
SEC |
Zacks Reports |
StockTalk |
News |
Chart |
Request a new note
C
A N
S L
I M
|
ORCL
-
NASDAQ
Oracle Corp
COMPUTER SOFTWARE and SERVICES - Application Software
|
$27.69
|
+0.11
0.40% |
$27.89
|
40,598,287
110.67% of 50 DAV
50 DAV is 36,683,000
|
$27.86
-0.61%
|
9/20/2010
|
$27.32
|
PP = $26.73
|
|
MB = $28.07
|
Most Recent Note - 10/5/2010 5:59:36 PM
Y - Holding its ground in a very tight trading range still since its "breakaway gap" on 9/17/10 backed by 5 times average volume.
>>> The latest Featured Stock Update with an annotated graph appeared on 9/20/2010. Click here.
View all notes |
Alert me of new notes |
CANSLIM.net Company Profile |
SEC |
Zacks Reports |
StockTalk |
News |
Chart |
Request a new note
C
A N
S L
I M
|
PAY
-
NYSE
Verifone Systems Inc
COMPUTER HARDWARE - Transaction Automation Systems
|
$27.85
|
+0.45
1.64% |
$28.13
|
885,400
60.82% of 50 DAV
50 DAV is 1,455,800
|
$31.40
-11.31%
|
8/25/2010
|
$24.30
|
PP = $23.74
|
|
MB = $24.93
|
Most Recent Note - 10/6/2010 6:25:47 PM
G - Pullback today on light volume leaves it still as previously noted - "Extended from a sound base." Its 50 DMA line defines the nearest chart support.
>>> The latest Featured Stock Update with an annotated graph appeared on 8/30/2010. Click here.
View all notes |
Alert me of new notes |
CANSLIM.net Company Profile |
SEC |
Zacks Reports |
StockTalk |
News |
Chart |
Request a new note
C
A N
S L
I M
|
PRGO
-
NASDAQ
Perrigo Co
DRUGS - Drug Related Products
|
$65.81
|
+0.06
0.09% |
$66.14
|
437,501
44.55% of 50 DAV
50 DAV is 982,100
|
$67.49
-2.49%
|
9/15/2010
|
$63.73
|
PP = $64.76
|
|
MB = $68.00
|
Most Recent Note - 10/5/2010 5:53:54 PM
Y - Gapped up today for a gain on lighter volume. Its 9/24/10 gap up gain with +50% above average volume for a new 52-week high triggered a technical buy signal with volume near the minimum guideline. It was first featured in the 9/15/10 mid-day report.
>>> The latest Featured Stock Update with an annotated graph appeared on 9/15/2010. Click here.
View all notes |
Alert me of new notes |
CANSLIM.net Company Profile |
SEC |
Zacks Reports |
StockTalk |
News |
Chart |
Request a new note
C
A N
S L
I M
|
Symbol/Exchange
Company Name
Industry Group |
PRICE |
CHANGE
(%Change) |
Day High |
Volume
(% DAV)
(% 50 day avg vol) |
52 Wk Hi
% From Hi |
Featured
Date |
Price
Featured |
Pivot Featured |
|
Max Buy |
RAX
-
NYSE
Rackspace Hosting Inc
INTERNET - Internet Software and; Services
|
$23.99
|
+0.70
3.01% |
$24.24
|
2,860,837
126.06% of 50 DAV
50 DAV is 2,269,500
|
$26.50
-9.47%
|
9/21/2010
|
$22.84
|
PP = $23.61
|
|
MB = $24.79
|
Most Recent Note - 10/7/2010 5:17:56 PM
G - Posted a meaningful gain today as it rebounded back above its pivot point and closed near the session high. Its damaging gap down on 10/06/10 raised concerns and weakness likely triggered stop losses for disciplined investors.
>>> The latest Featured Stock Update with an annotated graph appeared on 9/21/2010. Click here.
View all notes |
Alert me of new notes |
CANSLIM.net Company Profile |
SEC |
Zacks Reports |
StockTalk |
News |
Chart |
Request a new note
C
A N
S L
I M
|
ROVI
-
NASDAQ
Rovi Corp
COMPUTER SOFTWARE andamp; SERVICES - Security Software andamp; Services
|
$49.01
|
-0.08
-0.16% |
$49.33
|
1,859,912
120.30% of 50 DAV
50 DAV is 1,546,000
|
$53.00
-7.53%
|
8/31/2010
|
$43.31
|
PP = $45.06
|
|
MB = $47.31
|
Most Recent Note - 10/5/2010 6:10:57 PM
G - Consolidating after a streak of big gains on above average volume. It is extended from its latest base, and prior highs in the $45 area define chart support to watch now.
>>> The latest Featured Stock Update with an annotated graph appeared on 8/24/2010. Click here.
View all notes |
Alert me of new notes |
CANSLIM.net Company Profile |
SEC |
Zacks Reports |
StockTalk |
News |
Chart |
Request a new note
C
A N
S L
I M
|
SHOO
-
NASDAQ
Steven Madden Limited
CONSUMER NON-DURABLES - Textile - Apparel Footwear
|
$43.61
|
+0.56
1.30% |
$44.42
|
871,230
195.34% of 50 DAV
50 DAV is 446,000
|
$44.10
-1.11%
|
9/15/2010
|
$38.94
|
PP = $40.27
|
|
MB = $42.28
|
Most Recent Note - 10/7/2010 1:18:50 PM
G - Touched another new 52-week high today. Prior highs in the $40 area define chart support to watch now. Color code was changed to green after getting extended more than +5% above its prior highs.
>>> The latest Featured Stock Update with an annotated graph appeared on 9/29/2010. Click here.
View all notes |
Alert me of new notes |
CANSLIM.net Company Profile |
SEC |
Zacks Reports |
StockTalk |
News |
Chart |
Request a new note
C
A N
S L
I M
|
SLW
-
NYSE
Silver Wheaton Corp
METALS and; MINING - Silver
|
$26.04
|
-0.92
-3.41% |
$27.27
|
10,156,826
180.04% of 50 DAV
50 DAV is 5,641,300
|
$27.31
-4.65%
|
8/25/2010
|
$21.40
|
PP = $21.99
|
|
MB = $23.09
|
Most Recent Note - 10/7/2010 5:00:48 PM
G - Today's loss with almost 2 times average volume puts its streak of 11 consecutive weekly gains to all-time highs in jeopardy. Prior highs and its 50 DMA line in the $22 area define chart support to watch on pullbacks.
>>> The latest Featured Stock Update with an annotated graph appeared on 8/25/2010. Click here.
View all notes |
Alert me of new notes |
CANSLIM.net Company Profile |
SEC |
Zacks Reports |
StockTalk |
News |
Chart |
Request a new note
C
A N
S L
I M
|
SVR
-
NYSE
Syniverse Holdings Inc
TELECOMMUNICATIONS - Diversified Communication Serv
|
$22.80
|
+0.13
0.57% |
$22.96
|
872,967
118.80% of 50 DAV
50 DAV is 734,800
|
$24.24
-5.94%
|
9/22/2010
|
$23.60
|
PP = $23.87
|
|
MB = $25.06
|
Most Recent Note - 10/6/2010 1:08:06 PM
G - Halted its recent worrisome slide, finding prompt support near its 50 DMA line after 4 consecutive losses. The recent chart low ($21.47) defines important support to watch. Concerns have been raised as its Relative Strength rank has slumped under the 80+ guideline after promptly negating its latest breakout and encountering distributional pressure.
>>> The latest Featured Stock Update with an annotated graph appeared on 9/22/2010. Click here.
View all notes |
Alert me of new notes |
CANSLIM.net Company Profile |
SEC |
Zacks Reports |
StockTalk |
News |
Chart |
Request a new note
C
A N
S L
I M
|
Symbol/Exchange
Company Name
Industry Group |
PRICE |
CHANGE
(%Change) |
Day High |
Volume
(% DAV)
(% 50 day avg vol) |
52 Wk Hi
% From Hi |
Featured
Date |
Price
Featured |
Pivot Featured |
|
Max Buy |
UA
-
NYSE
Under Armour Inc Cl A
CONSUMER NON-DURABLES - Textile - Apparel Clothing
|
$44.59
|
+0.14
0.31% |
$45.25
|
527,836
70.98% of 50 DAV
50 DAV is 743,600
|
$47.00
-5.13%
|
9/9/2010
|
$39.99
|
PP = $40.10
|
|
MB = $42.11
|
Most Recent Note - 10/5/2010 6:07:22 PM
G - Spiked to a new 2010 high on today's heavy volume session, then reversed most of its gain and ended near the session low. It is extended from its latest sound base pattern after a considerable streak of gains.
>>> The latest Featured Stock Update with an annotated graph appeared on 9/9/2010. Click here.
View all notes |
Alert me of new notes |
CANSLIM.net Company Profile |
SEC |
Zacks Reports |
StockTalk |
News |
Chart |
Request a new note
C
A N
S L
I M
|
UFPT
-
NASDAQ
U F P Tech Inc
CONSUMER NON-DURABLES - Packaging and Containers
|
$11.95
|
-0.17
-1.40% |
$12.29
|
49,066
88.89% of 50 DAV
50 DAV is 55,200
|
$13.20
-9.47%
|
9/16/2010
|
$11.20
|
PP = $11.69
|
|
MB = $12.27
|
Most Recent Note - 10/6/2010 10:42:28 AM
G - Down today and trading just under its "max buy" level now, pulling back after a weak finish on the prior session capped a streak of 6 consecutive gains with above average and ever-increasing volume. Disciplined investors do not chase stocks extended more than +5% above prior highs. Few institutional investors (I criteria) own its shares, but the number of top-rated funds has increased from 6 in Sep '09 to 10 in Jun '10.
>>> The latest Featured Stock Update with an annotated graph appeared on 9/17/2010. Click here.
View all notes |
Alert me of new notes |
CANSLIM.net Company Profile |
SEC |
Zacks Reports |
StockTalk |
News |
Chart |
Request a new note
C
A N
S L
I M
|
ULTA
-
NASDAQ
Ulta Salon Cosm & Frag
SPECIALTY RETAIL - Specialty Retail, Other
|
$28.53
|
+0.23
0.81% |
$28.84
|
811,965
129.81% of 50 DAV
50 DAV is 625,500
|
$30.19
-5.50%
|
9/3/2010
|
$26.36
|
PP = $25.89
|
|
MB = $27.18
|
Most Recent Note - 10/4/2010 2:15:09 PM
G - Down today with below average volume. Quietly consolidating well above prior highs in the $26 area that define support to watch now.
>>> The latest Featured Stock Update with an annotated graph appeared on 9/3/2010. Click here.
View all notes |
Alert me of new notes |
CANSLIM.net Company Profile |
SEC |
Zacks Reports |
StockTalk |
News |
Chart |
Request a new note
C
A N
S L
I M
|
VIT
-
NYSE
Vanceinfo Tech Inc Ads
COMPUTER SOFTWARE and SERVICES - Business Software and Services
|
$31.31
|
-0.30
-0.95% |
$31.90
|
554,783
87.27% of 50 DAV
50 DAV is 635,700
|
$33.30
-5.98%
|
7/8/2010
|
$25.20
|
PP = $26.58
|
|
MB = $27.91
|
Most Recent Note - 10/5/2010 6:12:24 PM
G - Still holding its ground stubbornly at its all-time high. It is extended after rallying from a prior resistance level in the $26 area. Its 50 DMA line defines chart support to watch.
>>> The latest Featured Stock Update with an annotated graph appeared on 8/31/2010. Click here.
View all notes |
Alert me of new notes |
CANSLIM.net Company Profile |
SEC |
Zacks Reports |
StockTalk |
News |
Chart |
Request a new note
C
A N
S L
I M
|
WCRX
-
NASDAQ
Warner Chilcott Plc
DRUGS - Drug Manufacturers - Other
|
$21.89
|
+0.10
0.46% |
$22.15
|
3,216,349
117.39% of 50 DAV
50 DAV is 2,739,900
|
$23.53
-6.97%
|
8/23/2010
|
$21.04
|
PP = $20.84
|
|
MB = $21.88
|
Most Recent Note - 10/5/2010 6:19:58 PM
G - Gapped up today for a small gain with below average volume. Signs of more worrisome distributional pressure contributed to its slump near prior highs and its 50 DMA line defining chart support in the $20-21 area.
>>> The latest Featured Stock Update with an annotated graph appeared on 8/23/2010. Click here.
View all notes |
Alert me of new notes |
CANSLIM.net Company Profile |
SEC |
Zacks Reports |
StockTalk |
News |
Chart |
Request a new note
C
A N
S L
I M
|
Symbol/Exchange
Company Name
Industry Group |
PRICE |
CHANGE
(%Change) |
Day High |
Volume
(% DAV)
(% 50 day avg vol) |
52 Wk Hi
% From Hi |
Featured
Date |
Price
Featured |
Pivot Featured |
|
Max Buy |