***Last / Change / Volume data in this table is the closing quote data***
Symbol/Exchange
Company Name
Industry Group |
PRICE |
CHANGE
(%Change) |
Day High |
Volume
(% DAV)
(% 50 day avg vol) |
52 Wk Hi
% From Hi |
Featured
Date |
Price
Featured |
Pivot Featured |
|
Max Buy |
ABV
-
NYSE
Comp De Bebidas Adr
FOOD and BEVERAGE - Beverages - Brewers
|
$129.90
|
+0.85
0.66% |
$130.55
|
794,034
132.94% of 50 DAV
50 DAV is 597,300
|
$129.51
0.30%
|
6/29/2010
|
$104.74
|
PP = $109.33
|
|
MB = $114.80
|
Most Recent Note - 10/5/2010 5:47:15 PM
G - This Brazil-based beverage firm hit another new all-time high today with a gap up gain on above average volume. Extended from a sound base, its prior highs in the $111-112 area define support above its 50 DMA line.
>>> The latest Featured Stock Update with an annotated graph appeared on 8/18/2010. Click here.
View all notes |
Alert me of new notes |
CANSLIM.net Company Profile |
SEC |
Zacks Reports |
StockTalk |
News |
Chart |
Request a new note
C
A N
S L
I M


|
ARUN
-
NASDAQ
Aruba Networks Inc
COMPUTER HARDWARE - Networking andamp; Communication Dev
|
$20.31
|
-0.99
-4.65% |
$22.19
|
4,631,113
223.57% of 50 DAV
50 DAV is 2,071,400
|
$22.80
-10.92%
|
8/30/2010
|
$18.12
|
PP = $18.51
|
|
MB = $19.44
|
 Most Recent Note - 10/6/2010 12:07:21 PM
G - Off today's earlier high, it remains extended from a sound base pattern. Prior highs near $18 and its 50 DMA line define important near-term chart support levels to watch.
>>> The latest Featured Stock Update with an annotated graph appeared on 9/2/2010. Click here.
View all notes |
Alert me of new notes |
CANSLIM.net Company Profile |
SEC |
Zacks Reports |
StockTalk |
News |
Chart |
Request a new note
C
A N
S L
I M
|
ASPS
-
NASDAQ
Altisource Ptf Sltns Sa
REAL ESTATE - Property Management/Developmen
|
$25.85
|
-1.73
-6.27% |
$27.60
|
607,085
511.44% of 50 DAV
50 DAV is 118,700
|
$31.35
-17.54%
|
9/23/2010
|
$28.36
|
PP = $28.90
|
|
MB = $30.35
|
Most Recent Note - 10/6/2010 10:36:59 AM
G - Volume is running at an above average pace today while slumping under its 50 DMA near prior lows in the $26 area defining the near-term support above its 200 DMA line. Considerable loss on 10/05/10 was noted - "Heavy volume is indicative of heavy distributional pressure, not the kind of 'light volume pullback' which is healthy and ordinary. It completely negated its recent breakout and slumped back into its prior base, raising concerns and closing near its 50 DMA line. This Luxembourg-based Financial Services firm's small supply (S criteria) of only 18.9 million shares in the public float can contribute to greater volatility in the event of institutional buying or selling."
>>> The latest Featured Stock Update with an annotated graph appeared on 9/23/2010. Click here.
View all notes |
Alert me of new notes |
CANSLIM.net Company Profile |
SEC |
Zacks Reports |
StockTalk |
News |
Chart |
Request a new note
C
A N
S L
I M
|
BIDU
-
NASDAQ
Baidu Inc Ads
INTERNET - Internet Information Providers
|
$98.40
|
-4.30
-4.19% |
$103.04
|
17,631,325
182.44% of 50 DAV
50 DAV is 9,664,000
|
$107.19
-8.20%
|
9/17/2010
|
$85.73
|
PP = $88.42
|
|
MB = $92.84
|
Most Recent Note - 10/6/2010 12:08:48 PM
G - Perched within close striking distance of its best-ever close ($103.82), it has been repeatedly noted as "extended from any sound base" yet could go on to produce more climactic gains. A subsequent violation of its 10/04/10 low $95.12 would raise concerns, while the nearest chart support is at old highs and its 50 DMA line.
>>> The latest Featured Stock Update with an annotated graph appeared on 8/13/2010. Click here.
View all notes |
Alert me of new notes |
CANSLIM.net Company Profile |
SEC |
Zacks Reports |
StockTalk |
News |
Chart |
Request a new note
C
A N
S L
I M
|
CACC
-
NASDAQ
Credit Acceptance Corp
FINANCIAL SERVICES - Credit Services
|
$57.09
|
-0.53
-0.92% |
$57.85
|
9,240
21.49% of 50 DAV
50 DAV is 43,000
|
$63.45
-10.02%
|
7/29/2010
|
$52.04
|
PP = $54.07
|
|
MB = $56.77
|
Most Recent Note - 10/4/2010 11:30:59 AM
G - Violated its 50 DMA line on Friday, and now trading back above the previously noted chart low ($56.06) after undercutting it earlier today. A prompt sign of support would be encouraging. The color code is changed to green based upon damaging technical action since the latest FSU appearance. The old high ($53.97 on 2/01/10) is the next chart support level to watch.
>>> The latest Featured Stock Update with an annotated graph appeared on 9/30/2010. Click here.
View all notes |
Alert me of new notes |
CANSLIM.net Company Profile |
SEC |
Zacks Reports |
StockTalk |
News |
Chart |
Request a new note
C
A N
S L
I M
|
Symbol/Exchange
Company Name
Industry Group |
PRICE |
CHANGE
(%Change) |
Day High |
Volume
(% DAV)
(% 50 day avg vol) |
52 Wk Hi
% From Hi |
Featured
Date |
Price
Featured |
Pivot Featured |
|
Max Buy |
CMG
-
NYSE
Chipotle Mexican Grill
LEISURE - Restaurants
|
$174.82
|
-4.16
-2.32% |
$178.18
|
984,667
160.26% of 50 DAV
50 DAV is 614,400
|
$179.50
-2.61%
|
9/1/2010
|
$158.31
|
PP = $155.52
|
|
MB = $163.30
|
Most Recent Note - 10/5/2010 5:38:27 PM
G - Gapped up and rallied to a new all-time high today with above average volume. Extended from prior highs in the $155 area that define chart support.
>>> The latest Featured Stock Update with an annotated graph appeared on 9/1/2010. Click here.
View all notes |
Alert me of new notes |
CANSLIM.net Company Profile |
SEC |
Zacks Reports |
StockTalk |
News |
Chart |
Request a new note
C
A N
S L
I M
|
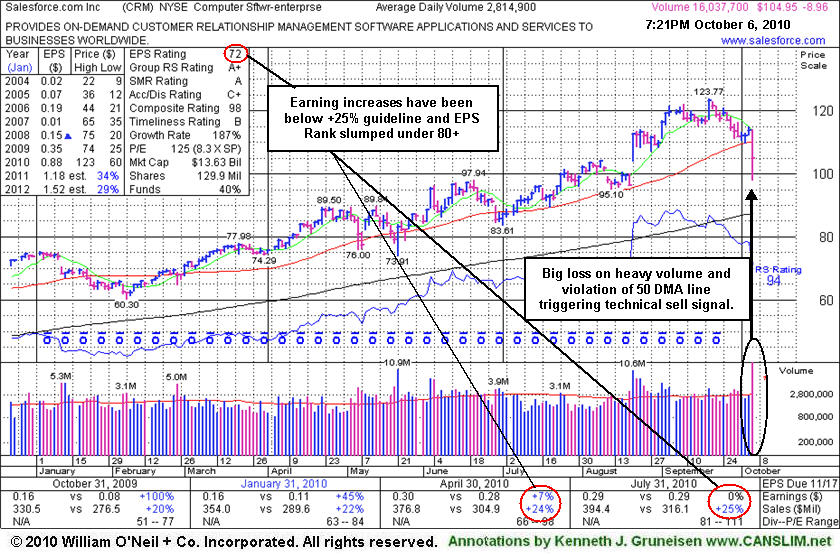
CRM
-
NYSE
Salesforce.Com Inc
INTERNET - Internet Software and Services
|
$104.95
|
-8.96
-7.87% |
$114.12
|
16,140,445
573.07% of 50 DAV
50 DAV is 2,816,500
|
$123.77
-15.21%
|
6/2/2010
|
$88.44
|
PP = $89.60
|
|
MB = $94.08
|
Most Recent Note - 10/6/2010 8:15:58 PM
G - Violated its 50 DMA line with today's considerable loss on higher volume, raising concerns. Based on distributional action, technical damage, and faltering fundamentals it will be dropped from the Featured Stocks list tonight.
>>> The latest Featured Stock Update with an annotated graph appeared on 10/6/2010. Click here.
View all notes |
Alert me of new notes |
CANSLIM.net Company Profile |
SEC |
Zacks Reports |
StockTalk |
News |
Chart |
Request a new note
C
A N
S L
I M
|
CTRP
-
NASDAQ
Ctrip.Com Intl Ltd Adr
LEISURE - Resorts and Casinos
|
$46.07
|
-1.48
-3.11% |
$47.50
|
1,967,882
110.67% of 50 DAV
50 DAV is 1,778,200
|
$49.23
-6.43%
|
9/24/2010
|
$46.75
|
PP = $47.11
|
|
MB = $49.47
|
Most Recent Note - 10/6/2010 6:34:52 PM
Y - Down today with average volume, slumping below its pivot point again. More damaging losses would raise greater concerns, as healthy stocks do not typically slump more than -7% below their pivot point after breaking out.
>>> The latest Featured Stock Update with an annotated graph appeared on 9/28/2010. Click here.
View all notes |
Alert me of new notes |
CANSLIM.net Company Profile |
SEC |
Zacks Reports |
StockTalk |
News |
Chart |
Request a new note
C
A N
S L
I M
|
EBIX
-
NASDAQ
Ebix Inc
COMPUTER SOFTWARE and SERVICES - Business Software and Services
|
$23.28
|
-1.50
-6.05% |
$25.58
|
1,692,931
317.80% of 50 DAV
50 DAV is 532,700
|
$24.98
-6.81%
|
9/23/2010
|
$21.78
|
PP = $22.74
|
|
MB = $23.88
|
Most Recent Note - 10/6/2010 12:15:18 PM
G - Hit another new high today. Held its ground stubbornly following a recent streak of consecutive gains with heavy volume. As previously noted -"It could go on to produce more climactic gains, but it is extended from an ideal base. Recent highs near $20 define chart support to watch."
>>> The latest Featured Stock Update with an annotated graph appeared on 9/24/2010. Click here.
View all notes |
Alert me of new notes |
CANSLIM.net Company Profile |
SEC |
Zacks Reports |
StockTalk |
News |
Chart |
Request a new note
C
A N
S L
I M
|
EGO
-
NYSE
Eldorado Gold Corp
METALS and MINING - Gold
|
$19.08
|
+0.41
2.20% |
$19.25
|
4,877,678
105.84% of 50 DAV
50 DAV is 4,608,400
|
$20.23
-5.68%
|
8/19/2010
|
$18.25
|
PP = $19.17
|
|
MB = $20.13
|
Most Recent Note - 10/6/2010 6:37:26 PM
Y - Gain today with average volume, recently consolidating above support at its 50 DMA line. A damaging violation of that important short-term average or breach of its recent chart low ($17.65 on 9/28/10) would raise concerns and trigger technical sell signals.
>>> The latest Featured Stock Update with an annotated graph appeared on 8/19/2010. Click here.
View all notes |
Alert me of new notes |
CANSLIM.net Company Profile |
SEC |
Zacks Reports |
StockTalk |
News |
Chart |
Request a new note
C
A N
S L
I M
|
Symbol/Exchange
Company Name
Industry Group |
PRICE |
CHANGE
(%Change) |
Day High |
Volume
(% DAV)
(% 50 day avg vol) |
52 Wk Hi
% From Hi |
Featured
Date |
Price
Featured |
Pivot Featured |
|
Max Buy |
FFIV
-
NASDAQ
F 5 Networks Inc
INTERNET - Internet Software and Services
|
$97.54
|
-13.96
-12.52% |
$109.70
|
7,616,044
472.90% of 50 DAV
50 DAV is 1,610,500
|
$112.05
-12.95%
|
6/16/2010
|
$74.50
|
PP = $74.10
|
|
MB = $77.81
|
Most Recent Note - 10/6/2010 10:39:38 AM
G - From the new all-time high and strong close on the prior session it abruptly gapped down today in the wake of an analyst downgrade. It is extended from a sound base but could go on to produce more climactic gains, especially with a favorable market (M criteria) environment. A steep upward trendline connecting July-August lows defines an initial chart support level above its 50 DMA line.
>>> The latest Featured Stock Update with an annotated graph appeared on 9/13/2010. Click here.
View all notes |
Alert me of new notes |
CANSLIM.net Company Profile |
SEC |
Zacks Reports |
StockTalk |
News |
Chart |
Request a new note
C
A N
S L
I M
|
FOSL
-
NASDAQ
Fossil Inc
CONSUMER DURABLES - Recreational Goods, Other
|
$52.97
|
-1.17
-2.16% |
$54.30
|
578,160
72.59% of 50 DAV
50 DAV is 796,500
|
$54.76
-3.27%
|
8/10/2010
|
$45.54
|
PP = $42.69
|
|
MB = $44.82
|
Most Recent Note - 10/5/2010 5:43:16 PM
G - Gain today with above average volume for its second best close after recent signs of distribution. An upward trendline defines initial support to watch after it has been repeatedly noted as "extended from any sound base."
>>> The latest Featured Stock Update with an annotated graph appeared on 10/5/2010. Click here.
View all notes |
Alert me of new notes |
CANSLIM.net Company Profile |
SEC |
Zacks Reports |
StockTalk |
News |
Chart |
Request a new note
C
A N
S L
I M
|
HMSY
-
NASDAQ
H M S Holdings Corp
COMPUTER SOFTWARE and SERVICES - Healthcare Information Service
|
$60.39
|
-0.02
-0.03% |
$60.68
|
153,737
79.41% of 50 DAV
50 DAV is 193,600
|
$60.53
-0.22%
|
9/27/2010
|
$57.97
|
PP = $58.36
|
|
MB = $61.28
|
Most Recent Note - 10/5/2010 6:03:43 PM
Y - Gain on light volume today for a new high, inching higher without great volume conviction behind gains since 9/27/10 when featured in yellow.
>>> The latest Featured Stock Update with an annotated graph appeared on 9/27/2010. Click here.
View all notes |
Alert me of new notes |
CANSLIM.net Company Profile |
SEC |
Zacks Reports |
StockTalk |
News |
Chart |
Request a new note
C
A N
S L
I M
|
HS
-
NYSE
Healthspring Inc
HEALTH SERVICES - Health Care Plans
|
$25.59
|
-0.60
-2.29% |
$26.46
|
567,080
74.73% of 50 DAV
50 DAV is 758,800
|
$27.00
-5.22%
|
8/27/2010
|
$19.91
|
PP = $19.75
|
|
MB = $20.74
|
Most Recent Note - 10/5/2010 5:39:40 PM
G - Consolidating after a recent streak of 9 consecutive gains. Support to watch is prior chart highs in the $19-20 area. Disciplined investors do not chase stocks that are extended from a sound base.
>>> The latest Featured Stock Update with an annotated graph appeared on 8/27/2010. Click here.
View all notes |
Alert me of new notes |
CANSLIM.net Company Profile |
SEC |
Zacks Reports |
StockTalk |
News |
Chart |
Request a new note
C
A N
S L
I M
|
IGTE
-
NASDAQ
Igate Corp
COMPUTER SOFTWARE and SERVICES - Information Technology Service
|
$17.48
|
-0.39
-2.20% |
$18.03
|
324,152
83.50% of 50 DAV
50 DAV is 388,200
|
$19.45
-10.15%
|
9/8/2010
|
$17.29
|
PP = $18.26
|
|
MB = $19.17
|
Most Recent Note - 10/5/2010 5:56:13 PM
Y - Gain today on lighter volume after 4 consecutive losses, and it still below its pivot point. Trading just above important chart support at its 50 DMA line. More damaging losses would raise concerns and trigger technical sell signals.
>>> The latest Featured Stock Update with an annotated graph appeared on 9/10/2010. Click here.
View all notes |
Alert me of new notes |
CANSLIM.net Company Profile |
SEC |
Zacks Reports |
StockTalk |
News |
Chart |
Request a new note
C
A N
S L
I M
|
Symbol/Exchange
Company Name
Industry Group |
PRICE |
CHANGE
(%Change) |
Day High |
Volume
(% DAV)
(% 50 day avg vol) |
52 Wk Hi
% From Hi |
Featured
Date |
Price
Featured |
Pivot Featured |
|
Max Buy |
JOBS
-
NASDAQ
Fifty One Job Inc Ads
DIVERSIFIED SERVICES - Staffing and; Outsourcing Service
|
$37.60
|
-1.75
-4.45% |
$39.62
|
106,048
70.37% of 50 DAV
50 DAV is 150,700
|
$40.50
-7.16%
|
9/16/2010
|
$31.59
|
PP = $30.40
|
|
MB = $31.92
|
Most Recent Note - 10/6/2010 6:22:52 PM
G - Second consecutive loss on below average volume today following a recent streak of volume-driven gains. Noted recently as - "Very extended from a sound base. Prior highs in the $30 area define chart support."
>>> The latest Featured Stock Update with an annotated graph appeared on 9/16/2010. Click here.
View all notes |
Alert me of new notes |
CANSLIM.net Company Profile |
SEC |
Zacks Reports |
StockTalk |
News |
Chart |
Request a new note
C
A N
S L
I M
|
MELI
-
NASDAQ
Mercadolibre Inc
INTERNET - Internet Software and; Services
|
$64.32
|
-3.78
-5.55% |
$68.89
|
1,489,479
172.09% of 50 DAV
50 DAV is 865,500
|
$76.81
-16.26%
|
5/13/2010
|
$54.21
|
PP = $55.85
|
|
MB = $58.64
|
Most Recent Note - 10/6/2010 6:20:27 PM
G - Slumped further below its 50 DMA line today with above average volume behind another damaging loss. Weakness triggered technical sell signals after recently noted - "It may find support near that important short-term average and continue its ascent, but steep declines in the past (best viewed on a weekly chart) are a reminder to always use proper trading discipline."
>>> The latest Featured Stock Update with an annotated graph appeared on 8/26/2010. Click here.
View all notes |
Alert me of new notes |
CANSLIM.net Company Profile |
SEC |
Zacks Reports |
StockTalk |
News |
Chart |
Request a new note
C
A N
S L
I M
|
MRX
-
NYSE
Medicis Pharmaceut Cl A
DRUGS - Biotechnology
|
$29.93
|
-0.58
-1.90% |
$30.61
|
1,130,526
101.85% of 50 DAV
50 DAV is 1,110,000
|
$30.61
-2.22%
|
8/12/2010
|
$26.88
|
PP = $26.71
|
|
MB = $28.05
|
Most Recent Note - 10/5/2010 3:58:03 PM
G - Gapped up today rallying for a considerable gain, and hitting a new 52-week high. An upward trendline shown in the latest FSU section analysis defines an initial chart support level to watch.
>>> The latest Featured Stock Update with an annotated graph appeared on 10/4/2010. Click here.
View all notes |
Alert me of new notes |
CANSLIM.net Company Profile |
SEC |
Zacks Reports |
StockTalk |
News |
Chart |
Request a new note
C
A N
S L
I M
|
MWIV
-
NASDAQ
M W I Veterinary Supply
HEALTH SERVICES - Medical Instruments and; Supplies
|
$58.21
|
-0.08
-0.14% |
$58.91
|
58,073
82.14% of 50 DAV
50 DAV is 70,700
|
$58.74
-0.90%
|
7/29/2010
|
$52.05
|
PP = $52.09
|
|
MB = $54.69
|
Most Recent Note - 10/5/2010 3:42:13 PM
G - Considerable gain today without great volume conviction thus far has it poised for its best-ever close (above the $57.97 close from 9/29/10). No overhead supply remains to act as resistance. Its nearby 50 DMA line defines chart support.
>>> The latest Featured Stock Update with an annotated graph appeared on 9/7/2010. Click here.
View all notes |
Alert me of new notes |
CANSLIM.net Company Profile |
SEC |
Zacks Reports |
StockTalk |
News |
Chart |
Request a new note
C
A N
S L
I M
|
NEM
-
NYSE
Newmont Mining Corp
METALS and MINING - Gold
|
$64.72
|
+1.05
1.65% |
$64.96
|
5,554,986
90.45% of 50 DAV
50 DAV is 6,141,700
|
$65.50
-1.19%
|
8/31/2010
|
$61.32
|
PP = $63.48
|
|
MB = $66.65
|
Most Recent Note - 10/6/2010 6:39:17 PM
Y - Gain today with near average volume, finishing 22 cents off its best-ever close. Rallying back above its previously cited pivot point with strength returning to the group. Leadership in the Mining - Gold/Silver/Gems group (L criteria) is a nice reassurance.
>>> The latest Featured Stock Update with an annotated graph appeared on 9/14/2010. Click here.
View all notes |
Alert me of new notes |
CANSLIM.net Company Profile |
SEC |
Zacks Reports |
StockTalk |
News |
Chart |
Request a new note
C
A N
S L
I M
|
Symbol/Exchange
Company Name
Industry Group |
PRICE |
CHANGE
(%Change) |
Day High |
Volume
(% DAV)
(% 50 day avg vol) |
52 Wk Hi
% From Hi |
Featured
Date |
Price
Featured |
Pivot Featured |
|
Max Buy |
NEOG
-
NASDAQ
Neogen Corp
DRUGS - Diagnostic Substances
|
$33.72
|
-0.26
-0.77% |
$34.09
|
71,073
67.95% of 50 DAV
50 DAV is 104,600
|
$34.76
-2.99%
|
9/1/2010
|
$30.79
|
PP = $30.49
|
|
MB = $32.01
|
Most Recent Note - 10/5/2010 5:52:47 PM
G - Consolidating and recently enduring mild distributional pressure after getting extended from a sound base. Prior highs in the $30 area define initial support to watch.
>>> The latest Featured Stock Update with an annotated graph appeared on 8/20/2010. Click here.
View all notes |
Alert me of new notes |
CANSLIM.net Company Profile |
SEC |
Zacks Reports |
StockTalk |
News |
Chart |
Request a new note
C
A N
S L
I M
|
NFLX
-
NASDAQ
Netflix Inc
SPECIALTY RETAIL - Music and Video Stores
|
$150.27
|
-5.89
-3.77% |
$158.75
|
6,783,419
119.92% of 50 DAV
50 DAV is 5,656,700
|
$174.40
-13.84%
|
8/10/2010
|
$124.05
|
PP = $124.00
|
|
MB = $130.20
|
Most Recent Note - 10/6/2010 6:32:56 PM
G - Down today with above average volume, enduring distributional pressure after an impressive sprint to new highs in recent months. Following its recently noted "negative reversal", today it violated the upward trendline shown in the latest FSU analysis, raising greater concerns. Its 50 DMA line is the next chart support level to watch.
>>> The latest Featured Stock Update with an annotated graph appeared on 10/1/2010. Click here.
View all notes |
Alert me of new notes |
CANSLIM.net Company Profile |
SEC |
Zacks Reports |
StockTalk |
News |
Chart |
Request a new note
C
A N
S L
I M
|
NTAP
-
NASDAQ
Netapp Inc
COMPUTER HARDWARE - Data Storage Devices
|
$47.70
|
-3.22
-6.32% |
$51.10
|
14,798,335
180.10% of 50 DAV
50 DAV is 8,216,700
|
$51.40
-7.20%
|
9/8/2010
|
$46.98
|
PP = $44.99
|
|
MB = $47.24
|
Most Recent Note - 10/6/2010 6:15:32 PM
G - Damaging loss today on heavy volume was another clear sign of distributional pressure after repeatedly noted as "extended from a sound base." Support to watch is at prior chart highs near its latest pivot point.
>>> The latest Featured Stock Update with an annotated graph appeared on 9/8/2010. Click here.
View all notes |
Alert me of new notes |
CANSLIM.net Company Profile |
SEC |
Zacks Reports |
StockTalk |
News |
Chart |
Request a new note
C
A N
S L
I M
|
ORCL
-
NASDAQ
Oracle Corp
COMPUTER SOFTWARE and SERVICES - Application Software
|
$27.58
|
+0.28
1.03% |
$27.86
|
50,623,919
139.17% of 50 DAV
50 DAV is 36,374,500
|
$27.61
-0.11%
|
9/20/2010
|
$27.32
|
PP = $26.73
|
|
MB = $28.07
|
Most Recent Note - 10/5/2010 5:59:36 PM
Y - Holding its ground in a very tight trading range still since its "breakaway gap" on 9/17/10 backed by 5 times average volume.
>>> The latest Featured Stock Update with an annotated graph appeared on 9/20/2010. Click here.
View all notes |
Alert me of new notes |
CANSLIM.net Company Profile |
SEC |
Zacks Reports |
StockTalk |
News |
Chart |
Request a new note
C
A N
S L
I M
|
PAY
-
NYSE
Verifone Systems Inc
COMPUTER HARDWARE - Transaction Automation Systems
|
$27.40
|
-1.15
-4.03% |
$28.71
|
950,825
64.48% of 50 DAV
50 DAV is 1,474,500
|
$31.40
-12.74%
|
8/25/2010
|
$24.30
|
PP = $23.74
|
|
MB = $24.93
|
Most Recent Note - 10/6/2010 6:25:47 PM
G - Pullback today on light volume leaves it still as previously noted - "Extended from a sound base." Its 50 DMA line defines the nearest chart support.
>>> The latest Featured Stock Update with an annotated graph appeared on 8/30/2010. Click here.
View all notes |
Alert me of new notes |
CANSLIM.net Company Profile |
SEC |
Zacks Reports |
StockTalk |
News |
Chart |
Request a new note
C
A N
S L
I M
|
Symbol/Exchange
Company Name
Industry Group |
PRICE |
CHANGE
(%Change) |
Day High |
Volume
(% DAV)
(% 50 day avg vol) |
52 Wk Hi
% From Hi |
Featured
Date |
Price
Featured |
Pivot Featured |
|
Max Buy |
PRGO
-
NASDAQ
Perrigo Co
DRUGS - Drug Related Products
|
$65.75
|
+0.03
0.05% |
$66.54
|
509,744
51.31% of 50 DAV
50 DAV is 993,400
|
$67.49
-2.58%
|
9/15/2010
|
$63.73
|
PP = $64.76
|
|
MB = $68.00
|
Most Recent Note - 10/5/2010 5:53:54 PM
Y - Gapped up today for a gain on lighter volume. Its 9/24/10 gap up gain with +50% above average volume for a new 52-week high triggered a technical buy signal with volume near the minimum guideline. It was first featured in the 9/15/10 mid-day report.
>>> The latest Featured Stock Update with an annotated graph appeared on 9/15/2010. Click here.
View all notes |
Alert me of new notes |
CANSLIM.net Company Profile |
SEC |
Zacks Reports |
StockTalk |
News |
Chart |
Request a new note
C
A N
S L
I M
|
RAX
-
NYSE
Rackspace Hosting Inc
INTERNET - Internet Software and; Services
|
$23.29
|
-2.92
-11.14% |
$24.77
|
7,882,340
349.78% of 50 DAV
50 DAV is 2,253,500
|
$26.50
-12.11%
|
9/21/2010
|
$22.84
|
PP = $23.61
|
|
MB = $24.79
|
Most Recent Note - 10/6/2010 10:32:16 AM
G - Gapped down today, enduring distributional pressure and raising concerns, yet it is up from its lows after trading below its pivot point earlier. A close near its session highs would indicate support stepping up, while a weak finish today would not bode well.
>>> The latest Featured Stock Update with an annotated graph appeared on 9/21/2010. Click here.
View all notes |
Alert me of new notes |
CANSLIM.net Company Profile |
SEC |
Zacks Reports |
StockTalk |
News |
Chart |
Request a new note
C
A N
S L
I M
|
ROVI
-
NASDAQ
Rovi Corp
COMPUTER SOFTWARE andamp; SERVICES - Security Software andamp; Services
|
$49.09
|
-0.99
-1.98% |
$50.69
|
1,573,688
102.05% of 50 DAV
50 DAV is 1,542,100
|
$53.00
-7.38%
|
8/31/2010
|
$43.31
|
PP = $45.06
|
|
MB = $47.31
|
Most Recent Note - 10/5/2010 6:10:57 PM
G - Consolidating after a streak of big gains on above average volume. It is extended from its latest base, and prior highs in the $45 area define chart support to watch now.
>>> The latest Featured Stock Update with an annotated graph appeared on 8/24/2010. Click here.
View all notes |
Alert me of new notes |
CANSLIM.net Company Profile |
SEC |
Zacks Reports |
StockTalk |
News |
Chart |
Request a new note
C
A N
S L
I M
|
SHOO
-
NASDAQ
Steven Madden Limited
CONSUMER NON-DURABLES - Textile - Apparel Footwear
|
$43.05
|
-0.67
-1.53% |
$43.79
|
348,835
79.68% of 50 DAV
50 DAV is 437,800
|
$44.10
-2.38%
|
9/15/2010
|
$38.94
|
PP = $40.27
|
|
MB = $42.28
|
Most Recent Note - 10/5/2010 3:37:20 PM
G - Gapped up today for a considerable gain and new 52-week high. Color code is changed to green after getting extended more than +5% above its prior highs.
>>> The latest Featured Stock Update with an annotated graph appeared on 9/29/2010. Click here.
View all notes |
Alert me of new notes |
CANSLIM.net Company Profile |
SEC |
Zacks Reports |
StockTalk |
News |
Chart |
Request a new note
C
A N
S L
I M
|
SLW
-
NYSE
Silver Wheaton Corp
METALS and; MINING - Silver
|
$26.96
|
-0.08
-0.30% |
$27.31
|
6,497,036
116.64% of 50 DAV
50 DAV is 5,570,000
|
$27.29
-1.21%
|
8/25/2010
|
$21.40
|
PP = $21.99
|
|
MB = $23.09
|
Most Recent Note - 10/5/2010 1:23:09 PM
G - It is building on a streak of 11 consecutive weekly gains to all-time highs. It gapped up today as strength returned to the group, helping it touch a new 52-week high. Prior highs and its 50 DMA line in the $22 area define chart support to watch on pullbacks.
>>> The latest Featured Stock Update with an annotated graph appeared on 8/25/2010. Click here.
View all notes |
Alert me of new notes |
CANSLIM.net Company Profile |
SEC |
Zacks Reports |
StockTalk |
News |
Chart |
Request a new note
C
A N
S L
I M
|
Symbol/Exchange
Company Name
Industry Group |
PRICE |
CHANGE
(%Change) |
Day High |
Volume
(% DAV)
(% 50 day avg vol) |
52 Wk Hi
% From Hi |
Featured
Date |
Price
Featured |
Pivot Featured |
|
Max Buy |
SVR
-
NYSE
Syniverse Holdings Inc
TELECOMMUNICATIONS - Diversified Communication Serv
|
$22.67
|
+0.65
2.95% |
$22.80
|
1,485,707
211.19% of 50 DAV
50 DAV is 703,500
|
$24.24
-6.48%
|
9/22/2010
|
$23.60
|
PP = $23.87
|
|
MB = $25.06
|
Most Recent Note - 10/6/2010 1:08:06 PM
G - Halted its recent worrisome slide, finding prompt support near its 50 DMA line after 4 consecutive losses. The recent chart low ($21.47) defines important support to watch. Concerns have been raised as its Relative Strength rank has slumped under the 80+ guideline after promptly negating its latest breakout and encountering distributional pressure.
>>> The latest Featured Stock Update with an annotated graph appeared on 9/22/2010. Click here.
View all notes |
Alert me of new notes |
CANSLIM.net Company Profile |
SEC |
Zacks Reports |
StockTalk |
News |
Chart |
Request a new note
C
A N
S L
I M
|
UA
-
NYSE
Under Armour Inc Cl A
CONSUMER NON-DURABLES - Textile - Apparel Clothing
|
$44.45
|
-0.66
-1.46% |
$45.22
|
696,557
95.09% of 50 DAV
50 DAV is 732,500
|
$47.00
-5.43%
|
9/9/2010
|
$39.99
|
PP = $40.10
|
|
MB = $42.11
|
Most Recent Note - 10/5/2010 6:07:22 PM
G - Spiked to a new 2010 high on today's heavy volume session, then reversed most of its gain and ended near the session low. It is extended from its latest sound base pattern after a considerable streak of gains.
>>> The latest Featured Stock Update with an annotated graph appeared on 9/9/2010. Click here.
View all notes |
Alert me of new notes |
CANSLIM.net Company Profile |
SEC |
Zacks Reports |
StockTalk |
News |
Chart |
Request a new note
C
A N
S L
I M
|
UFPT
-
NASDAQ
U F P Tech Inc
CONSUMER NON-DURABLES - Packaging and Containers
|
$12.12
|
-0.51
-4.04% |
$12.72
|
114,762
217.76% of 50 DAV
50 DAV is 52,700
|
$13.20
-8.18%
|
9/16/2010
|
$11.20
|
PP = $11.69
|
|
MB = $12.27
|
Most Recent Note - 10/6/2010 10:42:28 AM
G - Down today and trading just under its "max buy" level now, pulling back after a weak finish on the prior session capped a streak of 6 consecutive gains with above average and ever-increasing volume. Disciplined investors do not chase stocks extended more than +5% above prior highs. Few institutional investors (I criteria) own its shares, but the number of top-rated funds has increased from 6 in Sep '09 to 10 in Jun '10.
>>> The latest Featured Stock Update with an annotated graph appeared on 9/17/2010. Click here.
View all notes |
Alert me of new notes |
CANSLIM.net Company Profile |
SEC |
Zacks Reports |
StockTalk |
News |
Chart |
Request a new note
C
A N
S L
I M
|
ULTA
-
NASDAQ
Ulta Salon Cosm & Frag
SPECIALTY RETAIL - Specialty Retail, Other
|
$28.30
|
-0.39
-1.36% |
$28.91
|
524,291
83.86% of 50 DAV
50 DAV is 625,200
|
$30.19
-6.26%
|
9/3/2010
|
$26.36
|
PP = $25.89
|
|
MB = $27.18
|
Most Recent Note - 10/4/2010 2:15:09 PM
G - Down today with below average volume. Quietly consolidating well above prior highs in the $26 area that define support to watch now.
>>> The latest Featured Stock Update with an annotated graph appeared on 9/3/2010. Click here.
View all notes |
Alert me of new notes |
CANSLIM.net Company Profile |
SEC |
Zacks Reports |
StockTalk |
News |
Chart |
Request a new note
C
A N
S L
I M
|
VIT
-
NYSE
Vanceinfo Tech Inc Ads
COMPUTER SOFTWARE and SERVICES - Business Software and Services
|
$31.61
|
-0.66
-2.05% |
$33.06
|
713,842
112.31% of 50 DAV
50 DAV is 635,600
|
$33.30
-5.08%
|
7/8/2010
|
$25.20
|
PP = $26.58
|
|
MB = $27.91
|
Most Recent Note - 10/5/2010 6:12:24 PM
G - Still holding its ground stubbornly at its all-time high. It is extended after rallying from a prior resistance level in the $26 area. Its 50 DMA line defines chart support to watch.
>>> The latest Featured Stock Update with an annotated graph appeared on 8/31/2010. Click here.
View all notes |
Alert me of new notes |
CANSLIM.net Company Profile |
SEC |
Zacks Reports |
StockTalk |
News |
Chart |
Request a new note
C
A N
S L
I M
|
Symbol/Exchange
Company Name
Industry Group |
PRICE |
CHANGE
(%Change) |
Day High |
Volume
(% DAV)
(% 50 day avg vol) |
52 Wk Hi
% From Hi |
Featured
Date |
Price
Featured |
Pivot Featured |
|
Max Buy |
WCRX
-
NASDAQ
Warner Chilcott Plc
DRUGS - Drug Manufacturers - Other
|
$21.79
|
+0.06
0.28% |
$21.88
|
1,937,623
71.35% of 50 DAV
50 DAV is 2,715,500
|
$23.53
-7.39%
|
8/23/2010
|
$21.04
|
PP = $20.84
|
|
MB = $21.88
|
Most Recent Note - 10/5/2010 6:19:58 PM
G - Gapped up today for a small gain with below average volume. Signs of more worrisome distributional pressure contributed to its slump near prior highs and its 50 DMA line defining chart support in the $20-21 area.
>>> The latest Featured Stock Update with an annotated graph appeared on 8/23/2010. Click here.
View all notes |
Alert me of new notes |
CANSLIM.net Company Profile |
SEC |
Zacks Reports |
StockTalk |
News |
Chart |
Request a new note
C
A N
S L
I M
|