You are not logged in.
This means you
CAN ONLY VIEW reports that were published prior to Monday, April 14, 2025.
You
MUST UPGRADE YOUR MEMBERSHIP if you want to see any current reports.
AFTER MARKET UPDATE - TUESDAY, OCTOBER 6TH, 2009
Previous After Market Report Next After Market Report >>>
|
|
|
|
DOW |
+131.50 |
9,731.25 |
+1.37% |
|
Volume |
1,228,548,410 |
+10% |
|
Volume |
2,466,807,280 |
+10% |
|
NASDAQ |
+35.42 |
2,103.57 |
+1.71% |
|
Advancers |
2,416 |
78% |
|
Advancers |
2,029 |
71% |
|
S&P 500 |
+14.26 |
1,054.72 |
+1.37% |
|
Decliners |
618 |
20% |
|
Decliners |
694 |
24% |
|
Russell 2000 |
+10.87 |
601.98 |
+1.84% |
|
52 Wk Highs |
310 |
|
|
52 Wk Highs |
113 |
|
|
S&P 600 |
+5.71 |
316.12 |
+1.84% |
|
52 Wk Lows |
4 |
|
|
52 Wk Lows |
4 |
|
|
 |
Major Averages Post Gains On Higher Volume As Leadership Expands
Adam Sarhan, Contributing Writer,
The major averages ended higher but volume was lighter as US stocks rose, extending a worldwide rally. What is helping seems to be speculation that third-quarter earnings will top estimates, and growing conviction that the global economy is improving. It was very good to see volume totals exceed Monday's levels as the major averages continued bouncing off support at their respective 50-day moving average (DMA) lines. Advancers trumped decliners by almost a 4-to-1 ratio on the NYSE and by approximately a 3-to-1 ratio on the Nasdaq exchange. There were 48 high-ranked companies from the CANSLIM.net Leaders List that made a new 52-week high and appeared on the CANSLIM.net BreakOuts Page, more than double the 22 issues that appeared on the prior session. New 52-week highs still outnumbered new 52-week lows on both exchanges.
Overnight the US dollar got smacked after the Australian Central Bank surprised the world and raised their overnight cash rate target to 3.25% from a 49-year low of 3%. The Australian Central Bank was the first major central bank to raise rates after the coordinated global stimulus package. The Australian Central bank said that they are raising rates to help offset the possibility of inflation as the economic recovery continues. Another negative data point for the greenback was that several world governments reportedly met to discuss the notion of replacing the dollar as the primary means to trade crude oil. The group mulled a notion to use a basket of currencies to replace the dollar. Both events put significant pressure on the dollar which in turn sent stocks and a slew of commodities higher.
On the political front, President Barack Obama considered a mix of spending programs and tax cuts that would serve as an additional economic stimulus package in response to last month's disappointing jobs report. Gold surged to a fresh all-time high on the news of a new stimulus package and the falling greenback. A slew of gold-related stocks surged on the news, but unfortunately many lack the strong fundamentals needed to meet the guidelines of this proven fact-based investment system. Looking forward, this rally remains intact as long as the major averages continue trading above support.
PICTURED: The S&P 500 Index continued bouncing off support.
|
|
|
 |
Gold & Silver Index Posts Standout Gain
Kenneth J. Gruneisen - Passed the CAN SLIM® Master's Exam
Tuesday marked a second consecutive unanimously positive session for the indices that are studied daily in this IGW section. Commodity-linked areas were among the day's leaders as the Gold & Silver Index ($XAU +6.12%) blasted higher, and the Integrated Oil Index ($XOI +2.29%) and Oil Services Index ($OSX +2.35%) also tallied greater then +2% gains. The Retail Index ($RLX +1.96%) and Broker/Dealer Index ($XBD +1.88%) were positive influences on the major averages as well, yet the Bank Index ($BKX +0.58%) and the Healthcare Index ($HMO +0.31%) ended with only modest gains. Tech sector strength helped the tech-heavy Nasdaq Composite post bigger gains than its peers as the Networking Index ($NWX +1.15%), Biotechnology Index ($BTK +1.50%), Internet Index ($IIX +1.88%), and Semiconductor Index ($SOX +2.07%) rallied.
Charts courtesy www.stockcharts.com
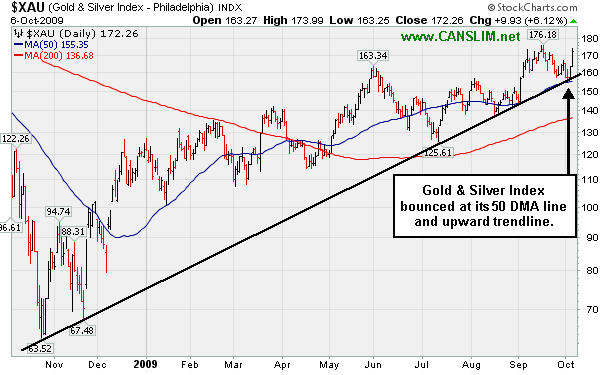
PICTURED: The Gold & Silver Index ($XAU +6.12%) bounced right at its 50-day moving average line and upward trendline.
| Oil Services |
$OSX |
191.98 |
+4.41 |
+2.35% |
+58.15% |
| Healthcare |
$HMO |
1,141.26 |
+3.49 |
+0.31% |
+18.86% |
| Integrated Oil |
$XOI |
1,032.32 |
+23.07 |
+2.29% |
+5.37% |
| Semiconductor |
$SOX |
319.58 |
+6.49 |
+2.07% |
+50.62% |
| Networking |
$NWX |
231.57 |
+2.64 |
+1.15% |
+60.94% |
| Internet |
$IIX |
217.62 |
+4.01 |
+1.88% |
+62.68% |
| Broker/Dealer |
$XBD |
121.38 |
+2.24 |
+1.88% |
+56.68% |
| Retail |
$RLX |
379.64 |
+7.30 |
+1.96% |
+35.94% |
| Gold & Silver |
$XAU |
172.26 |
+9.93 |
+6.12% |
+39.09% |
| Bank |
$BKX |
46.53 |
+0.27 |
+0.58% |
+4.99% |
| Biotech |
$BTK |
917.34 |
+13.54 |
+1.50% |
+41.75% |
|
|
|
 |
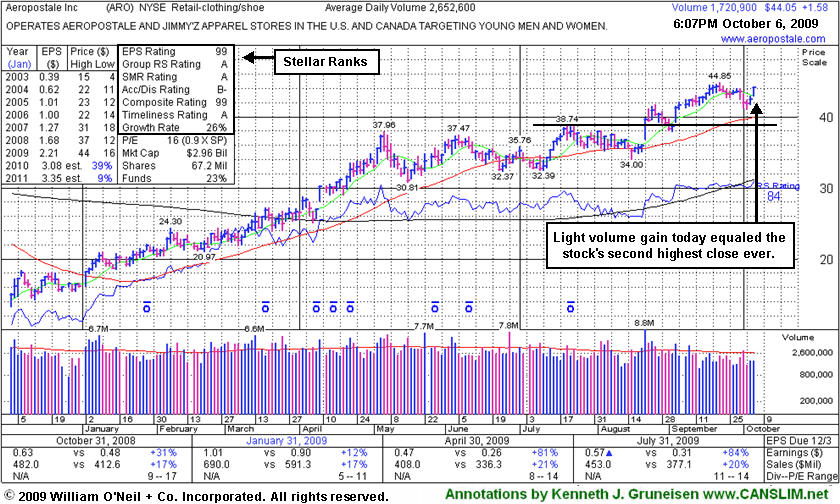
Near Best Close Ever For Clothing Retailer
Kenneth J. Gruneisen - Passed the CAN SLIM® Master's Exam
Aeropostale Inc. (ARO +$1.58 or +3.59% to $44.05) posted a light volume gain and equaled the second highest close ever for this high-ranked leader in the Retail - Clothing/shoe group. It has recently been consolidating above support at its 50-day moving average (DMA) line, with the next support to watch at prior highs in the $38 area. It has not encountered any very heavy distributional action since it rallied above its 2008 highs, however it also hasn't posted and gains backed by heavy volume since early-September. It is extended from a sound base and not buyable under the investment system guidelines now. Disciplined investors avoid chasing stocks more than 5% above their pivot point, as doing so increases the chances that a normal pullback will prompt them to sell the stock -as investors should always limit losses by selling any stock that falls 7% from their buy price.
ARO has advanced slowly, steadily, and quietly since it was featured in yellow with new pivot point and max buy levels noted in the 8/21/09 Mid-Day BreakOuts Report (read here). It has a great annual earnings history (the A criteria), and the 2 latest quarterly comparisons showed +81% and +84% earnings increases, well above the investment system's +25% guideline. The number of top-rated funds owning an interest in its shares rose from 209 in Dec '08 to 241 in Jun '09, which is good news concerning the I criteria.
|
|
|
Color Codes Explained :
Y - Better candidates highlighted by our
staff of experts.
G - Previously featured
in past reports as yellow but may no longer be buyable under the
guidelines.
***Last / Change / Volume quote data in this table corresponds with the timestamp on the note***
Symbol/Exchange
Company Name
Industry Group |
Last |
Chg. |
Vol
% DAV |
Date Featured |
Price Featured |
Latest Pivot Point
Featured |
Status |
| Latest Max Buy Price |
ARO
- NYSE
Aeropostale Inc
RETAIL - Apparel Stores
|
$44.05
|
+1.58
|
1,768,115
67% DAV
2,652,600
|
8/21/2009
(Date
Featured) |
$39.21
(Price
Featured) |
PP = $38.84 |
G |
| MB = $40.78 |
Most Recent Note - 10/6/2009 5:08:37 PM
G - Today's light volume gain equaled the second highest close ever for this high-ranked leader in the Retail - Clothing/shoe group. It is consolidating above support at its 50 DMA line, with the next support to watch at prior highs in the $38 area. It was featured in yellow in the 8/21/09 Mid-Day BreakOuts Report (read here).
>>> The latest Featured Stock Update with an annotated graph appeared on 10/6/2009. click here.
|
|
C
A
S
I |
News |
Chart |
SEC
View all notes Alert
me of new notes
Company
Profile
|
ARST
-
|
$23.30
|
+0.30
|
278,464
42% DAV
665,700
|
9/1/2009
(Date
Featured) |
$19.91
(Price
Featured) |
PP = $20.90 |
G |
| MB = $21.95 |
Most Recent Note - 10/6/2009 5:09:26 PM
G - Small gain today on very light volume. On 10/02/09 it traded down near 4-week lows and then positively reversed and closed near the session high amid widespread market weakness. As previously noted, "Recent lows may be considered an initial support level. Prior chart highs and its 50 DMA line, coinciding in the $20 area, define an important technical support level to watch on pullbacks."
>>> The latest Featured Stock Update with an annotated graph appeared on 10/2/2009. click here.
|
|
C
A
S
I |
News |
Chart |
SEC
View all notes Alert
me of new notes
Company
Profile
|
BIDU
- NASDAQ
Baidu Inc Ads
INTERNET - Internet Information Providers
|
$401.00
|
+19.11
|
3,218,923
196% DAV
1,645,000
|
9/8/2009
(Date
Featured) |
$351.80
(Price
Featured) |
PP = $368.59 |
G |
| MB = $387.02 |
Most Recent Note - 10/6/2009 5:15:17 PM
G - Considerable gain today on nearly 2 times average volume after consolidating near its prior chart highs and pivot point while staying well above its 50 DMA line. Color code is changed to green now, while the color code was yellow as the recent pullback offered more ideal opportunities to accumulate shares. BIDU was featured in yellow in the 9/08/09 Mid-Day BreakOuts Report (read here).
>>> The latest Featured Stock Update with an annotated graph appeared on 9/21/2009. click here.
|
|
C
A
S
I |
News |
Chart |
SEC
View all notes Alert
me of new notes
Company
Profile
|
CACC
- NASDAQ
Credit Acceptance Corp
FINANCIAL SERVICES - Credit Services
|
$34.25
|
+0.23
|
75,157
175% DAV
43,000
|
9/29/2009
(Date
Featured) |
$33.48
(Price
Featured) |
PP = $32.60 |
Y |
| MB = $34.23 |
Most Recent Note - 10/6/2009 5:18:00 PM
Y - Perched today at all-time highs near its max buy level after a 3rd consecutive gain with above average volume helped reconfirm its recent breakout. It finished last week rallying after a dose of distributional pressure followed its 9/29/09 breakout from a 6-week base. The Finance - Consumer/Commercial Loans firm has maintained a great track record of annual and quarterly sales revenues and earnings increases. It was featured on 9/29/09 in yellow in the mid-day report (read here).
>>> The latest Featured Stock Update with an annotated graph appeared on 9/29/2009. click here.
|
|
C
A
S
I |
News |
Chart |
SEC
View all notes Alert
me of new notes
Company
Profile
|
CRM
- NYSE
Salesforce.com Inc
INTERNET - Internet Software & Services
|
$58.57
|
+2.15
|
2,654,063
128% DAV
2,068,400
|
8/16/2009
(Date
Featured) |
$47.12
(Price
Featured) |
PP = $45.59 |
G |
| MB = $47.87 |
Most Recent Note - 10/6/2009 5:20:25 PM
G - Considerable gain today with above average volume for a new 2009 high close. Prior highs in the $55 area acted as an initial support level. More substantial technical support to watch is at its upward trendline and 50 DMA line now coinciding in the $51 area.
>>> The latest Featured Stock Update with an annotated graph appeared on 10/5/2009. click here.
|
|
C
A
S
I |
News |
Chart |
SEC
View all notes Alert
me of new notes
Company
Profile
|
EBIX
- NASDAQ
Ebix Inc
COMPUTER SOFTWARE & SERVICES - Business Software & Services
|
$54.60
|
+1.58
|
217,481
125% DAV
174,500
|
8/28/2009
(Date
Featured) |
$45.86
(Price
Featured) |
PP = $45.35 |
G |
| MB = $47.62 |
Most Recent Note - 10/6/2009 5:22:30 PM
G - Finished at its second best close ever today after a 6th gain in 7 sessions. It has not formed a new sound base since heavy distributional pressure led to a pullback near support at early-August chart highs and its 50 DMA line in the $45 area.
>>> The latest Featured Stock Update with an annotated graph appeared on 9/24/2009. click here.
|
|
C
A
S
I |
News |
Chart |
SEC
View all notes Alert
me of new notes
Company
Profile
|
GMCR
- NASDAQ
Green Mtn Coffee Roastrs
FOOD & BEVERAGE - Processed & Packaged Goods
|
$71.27
|
+0.16
|
1,064,352
71% DAV
1,500,200
|
10/5/2009
(Date
Featured) |
$71.11
(Price
Featured) |
PP = $75.89 |
Y |
| MB = $79.68 |
Most Recent Note - 10/6/2009 5:24:45 PM
Y - Gains this week with light volume helped it bounce back above its July-September high closes in the $70 area. It has formed a cup-with-high-handle pattern, and its color code was changed to yellow with new pivot point and max buy levels noted. Disciplined investors will watch for volume-driven gains to trigger a new technical buy signal before making any initial buys or add-on purchases.
>>> The latest Featured Stock Update with an annotated graph appeared on 9/23/2009. click here.
|
|
C
A
S
I |
News |
Chart |
SEC
View all notes Alert
me of new notes
Company
Profile
|
NTES
- NASDAQ
Netease Inc Adr
INTERNET - Internet Information Providers
|
$44.48
|
+1.48
|
1,441,878
74% DAV
1,958,900
|
9/23/2009
(Date
Featured) |
$47.11
(Price
Featured) |
PP = $47.04 |
G |
| MB = $49.39 |
Most Recent Note - 10/6/2009 5:27:08 PM
G- Gain today on lighter volume, closing back above its 50 DMA line. A loss 10/05/09 with above average volume indicated distributional pressure as it closed just under its 50 DMA line and violated an upward trendline. As previously noted, "Deterioration below those levels would raise more serious concerns and trigger technical sell signals." Color code was changed to green based on promptly negating its latest breakout and then trading more than -7% below its pivot point. This may also be considered a riskier late-stage base.
>>> The latest Featured Stock Update with an annotated graph appeared on 9/25/2009. click here.
|
|
C
A
S
I |
News |
Chart |
SEC
View all notes Alert
me of new notes
Company
Profile
|
NVEC
- NASDAQ
N V E Corp
ELECTRONICS - Semiconductor - Specialized
|
$51.08
|
+0.31
|
78,803
92% DAV
85,200
|
8/26/2009
(Date
Featured) |
$55.32
(Price
Featured) |
PP = $57.60 |
G |
| MB = $60.48 |
Most Recent Note - 10/6/2009 5:28:23 PM
G - Hovering near prior chart lows in the $49 area, where any further deterioration (especially if on heavy volume) may negate its 7/23/09 breakaway gap and raise serious concerns, triggering a more worrisome technical sell signal. Concerns increase the longer it struggles below its 50 DMA line.
>>> The latest Featured Stock Update with an annotated graph appeared on 9/30/2009. click here.
|
|
C
A
S
I |
News |
Chart |
SEC
View all notes Alert
me of new notes
Company
Profile
|
PEGA
- NASDAQ
Pegasystems Inc
COMPUTER SOFTWARE & SERVICES - Business Software & Services
|
$33.88
|
+0.69
|
193,436
48% DAV
399,400
|
9/9/2009
(Date
Featured) |
$31.14
(Price
Featured) |
PP = $33.35 |
Y |
| MB = $35.02 |
Most Recent Note - 10/6/2009 5:31:23 PM
Y - Today was its second consecutive gain on light volume since this high-ranked Computer Software - Financial firm gapped down on 10/02/09 and traded under its 50 DMA line, then found prompt support. The pullback raised some concerns as it violated an upward trendline connecting its July-September chart lows, an initial support level.
>>> The latest Featured Stock Update with an annotated graph appeared on 9/22/2009. click here.
|
|
C
A
S
I |
News |
Chart |
SEC
View all notes Alert
me of new notes
Company
Profile
|
SWI
- NYSE
Solarwinds Inc
COMPUTER SOFTWARE & SERVICES - Application Software
|
$21.72
|
+0.19
|
432,020
89% DAV
487,900
|
9/30/2029
(Date
Featured) |
$22.03
(Price
Featured) |
PP = $21.72 |
Y |
| MB = $22.81 |
Most Recent Note - 10/6/2009 5:33:40 PM
Y - Gains on light volume have it bouncing from support at its 50 DMA line and rallying back above its 8/04/09 high. It was featured in the October 2009 issue of CANSLIM.net News (read here).
>>> The latest Featured Stock Update with an annotated graph appeared on 9/30/2009. click here.
|
|
C
A
S
I |
News |
Chart |
SEC
View all notes Alert
me of new notes
Company
Profile
|
WNS
- NYSE
W N S Holdings Ltd Ads
DIVERSIFIED SERVICES - Business/Management Services
|
$15.39
|
-0.12
|
78,525
152% DAV
51,700
|
9/28/2009
(Date
Featured) |
$15.28
(Price
Featured) |
PP = $16.10 |
Y |
| MB = $16.91 |
Most Recent Note - 10/6/2009 5:35:41 PM
Y - Today was its 5th consecutive loss, while recently noted "churning" action and lack of meaningful price progress (chart-wise) is a sign of distributional pressure. Still perched above its 50 DMA line and stubbornly holding its ground, it traded up as high as $16.50 on two sessions last week but encountered stubborn resistance after a considerable 9/29/09 gain for a new 52-week high and new high close with volume 11 times its daily average volume. It formed an orderly flat base for at least 5-weeks, and it was featured in yellow in the 9/28/09 mid-day report (read here). Quarterly earnings have been above the +25% guideline and its annual earnings history has been great, satisfying the C & A criteria. However, sales revenues growth has decelerated.
>>> The latest Featured Stock Update with an annotated graph appeared on 9/28/2009. click here.
|
|
C
A
S
I |
News |
Chart |
SEC
View all notes Alert
me of new notes
Company
Profile
|
|
|
|
THESE ARE NOT BUY RECOMMENDATIONS!
Comments contained in the body of this report are technical
opinions only. The material herein has been obtained
from sources believed to be reliable and accurate, however,
its accuracy and completeness cannot be guaranteed.
This site is not an investment advisor, hence it does
not endorse or recommend any securities or other investments.
Any recommendation contained in this report may not
be suitable for all investors and it is not to be deemed
an offer or solicitation on our part with respect to
the purchase or sale of any securities. All trademarks,
service marks and trade names appearing in this report
are the property of their respective owners, and are
likewise used for identification purposes only.
This report is a service available
only to active Paid Premium Members.
You may opt-out of receiving report notifications
at any time. Questions or comments may be submitted
by writing to Premium Membership Services 665 S.E. 10 Street, Suite 201 Deerfield Beach, FL 33441-5634 or by calling 1-800-965-8307
or 954-785-1121.
|
|
|


