Symbol/Exchange
Company Name
Industry Group |
PRICE |
CHANGE
(%Change) |
Day High |
Volume
(% DAV)
(% 50 day avg vol) |
52 Wk Hi
% From Hi |
Featured
Date |
Price
Featured |
Pivot Featured |
|
Max Buy |
ALXN
-
NASDAQ
Alexion Pharmaceuticals
DRUGS - Drug Manufacturers - Other
|
$118.15
|
+0.43
0.37% |
$119.54
|
719,627
66.75% of 50 DAV
50 DAV is 1,078,100
|
$119.48
-1.11%
|
8/23/2012
|
$103.70
|
PP = $110.06
|
|
MB = $115.56
|
Most Recent Note - 10/2/2012 5:00:14 PM
G - Color code is changed to green after getting extended from its prior base and rallying above its "max buy" level. The prior highs in the $110 area define chart support along with its 50 DMA line (now $107.67)
>>> The latest Featured Stock Update with an annotated graph appeared on 9/26/2012. Click here.
View all notes |
Alert me of new notes |
CANSLIM.net Company Profile |
SEC |
Zacks Reports |
StockTalk |
News |
Chart |
Request a new note
C
A N
S L
I M


|
ASPS
-
NASDAQ
Altisource Ptf Sltns Sa
REAL ESTATE - Property Management/Developmen
|
$111.44
|
-2.66
-2.33% |
$115.73
|
317,398
190.06% of 50 DAV
50 DAV is 167,000
|
$115.22
-3.28%
|
9/24/2012
|
$87.24
|
PP = $92.39
|
|
MB = $97.01
|
 Most Recent Note - 10/5/2012 12:02:01 PM
G - Pulling back today after getting very extended from its prior base. Prior highs in the $92 area define initial support to watch on pullbacks.
>>> The latest Featured Stock Update with an annotated graph appeared on 9/11/2012. Click here.
View all notes |
Alert me of new notes |
CANSLIM.net Company Profile |
SEC |
Zacks Reports |
StockTalk |
News |
Chart |
Request a new note
C
A N
S L
I M
|
BRLI
-
NASDAQ
Bio Reference Labs Inc
HEALTH SERVICES - Medical Laboratories and Researc
|
$31.57
|
-0.85
-2.62% |
$32.86
|
512,437
193.45% of 50 DAV
50 DAV is 264,900
|
$32.54
-2.98%
|
10/3/2012
|
$30.90
|
PP = $30.25
|
|
MB = $31.76
|
Most Recent Note - 10/4/2012 11:52:32 AM
G - Color code is changed to green after trading above its "max buy" level today after triggering a technical buy signal on the prior session. Tallied a considerable volume-driven gain above its pivot point cited in the 10/03/12 mid-day report with the annotated graph included below (read here). It has maintained a good annual earnings history (A criteria) and quarterly earnings increases were above the +25% minimum guideline (C criteria) in the 3 latest comparisons through Jul '12 while prior comparisons were borderline or below the guideline.

>>> The latest Featured Stock Update with an annotated graph appeared on 6/15/2010. Click here.
View all notes |
Alert me of new notes |
CANSLIM.net Company Profile |
SEC |
Zacks Reports |
StockTalk |
News |
Chart |
Request a new note
C
A N
S L
I M
|
CFNL
-
NASDAQ
Cardinal Financial Corp
BANKING - Regional - Southeast Banks
|
$14.30
|
+0.15
1.06% |
$14.36
|
131,309
170.53% of 50 DAV
50 DAV is 77,000
|
$14.79
-3.31%
|
8/17/2012
|
$12.84
|
PP = $13.31
|
|
MB = $13.98
|
Most Recent Note - 10/3/2012 1:12:17 PM
G - Retreating from its 52-week high today with a damaging volume-driven loss. Distributional pressure is raising concerns while pulling back. Prior highs and 50 DMA line define important support to watch on pullbacks near the $13 level where violations would trigger technical sell signals.
>>> The latest Featured Stock Update with an annotated graph appeared on 9/25/2012. Click here.
View all notes |
Alert me of new notes |
CANSLIM.net Company Profile |
SEC |
Zacks Reports |
StockTalk |
News |
Chart |
Request a new note
C
A N
S L
I M
|
CMCSA
-
NASDAQ
Comcast Corp Cl A
MEDIA - CATV Systems
|
$36.54
|
+0.04
0.11% |
$36.98
|
8,425,812
66.24% of 50 DAV
50 DAV is 12,721,000
|
$36.90
-0.98%
|
6/11/2012
|
$29.94
|
PP = $30.98
|
|
MB = $32.53
|
Most Recent Note - 10/2/2012 5:03:06 PM
G - Consolidating above prior highs in the $35 area defining support to watch above its 50 DMA line where violations would trigger technical sell signals. Fundamental concerns have been repeatedly noted - "due to sub par sales and earnings growth in the Jun '12 quarter."
>>> The latest Featured Stock Update with an annotated graph appeared on 9/21/2012. Click here.
View all notes |
Alert me of new notes |
CANSLIM.net Company Profile |
SEC |
Zacks Reports |
StockTalk |
News |
Chart |
Request a new note
C
A N
S L
I M
|
Symbol/Exchange
Company Name
Industry Group |
PRICE |
CHANGE
(%Change) |
Day High |
Volume
(% DAV)
(% 50 day avg vol) |
52 Wk Hi
% From Hi |
Featured
Date |
Price
Featured |
Pivot Featured |
|
Max Buy |
DVA
-
NYSE
Davita Inc
HEALTH SERVICES - Specialized Health Services
|
$108.39
|
-0.01
-0.01% |
$109.02
|
719,689
95.91% of 50 DAV
50 DAV is 750,400
|
$109.31
-0.84%
|
9/5/2012
|
$102.92
|
PP = $100.62
|
|
MB = $105.65
|
Most Recent Note - 10/3/2012 1:31:59 PM
G - Gain today without great volume conviction helped it hit a new 52-week high above its "max buy" level and its color code is changed to green. Prior highs near $100 and its 50 DMA line define near term support to watch on pullbacks where violations may trigger technical sell signals.
>>> The latest Featured Stock Update with an annotated graph appeared on 9/5/2012. Click here.
View all notes |
Alert me of new notes |
CANSLIM.net Company Profile |
SEC |
Zacks Reports |
StockTalk |
News |
Chart |
Request a new note
C
A N
S L
I M
|
ECPG
-
NASDAQ
Encore Capital Group Inc
FINANCIAL SERVICES - Credit Services
|
$28.25
|
-0.30
-1.05% |
$28.88
|
74,652
53.28% of 50 DAV
50 DAV is 140,100
|
$30.91
-8.61%
|
8/3/2012
|
$29.91
|
PP = $30.45
|
|
MB = $31.97
|
Most Recent Note - 10/2/2012 5:08:33 PM
G - Color code is changed to green after today's gap up was followed by a worrisome "negative reversal" and close near the session low also slumping back below its 50 DMA line. Disciplined investors always limit losses if ever a stock falls more than -7% from their purchase price.
>>> The latest Featured Stock Update with an annotated graph appeared on 9/12/2012. Click here.
View all notes |
Alert me of new notes |
CANSLIM.net Company Profile |
SEC |
Zacks Reports |
StockTalk |
News |
Chart |
Request a new note
C
A N
S L
I M
|
EXPE
-
NASDAQ
Expedia Inc
INTERNET - Internet Information Providers
|
$57.60
|
-0.92
-1.57% |
$59.90
|
1,731,050
54.60% of 50 DAV
50 DAV is 3,170,400
|
$60.29
-4.46%
|
4/27/2012
|
$41.80
|
PP = $35.57
|
|
MB = $37.35
|
Most Recent Note - 10/2/2012 5:16:06 PM
G - Forming a late-stage cup-with-handle type base and it is currently perched -6% off its 52-week high while quietly consolidating above its 50 DMA line. It has been noted 2 times in recently weeks - "No overhead supply remains to hinder its progress, however weak industry group action and iffy fundamentals were noted as causes for concern." See more details and an annotated graph in the latest FSU analysis under the headline "Online Travel Firm Resilient Despite Unfavorable Signs - Wednesday, September 19, 2012"
>>> The latest Featured Stock Update with an annotated graph appeared on 9/19/2012. Click here.
View all notes |
Alert me of new notes |
CANSLIM.net Company Profile |
SEC |
Zacks Reports |
StockTalk |
News |
Chart |
Request a new note
C
A N
S L
I M
|
GPX
-
NYSE
G P Strategies Corp
DIVERSIFIED SERVICES - Education and Training Services
|
$19.85
|
+0.40
2.06% |
$19.94
|
93,355
124.14% of 50 DAV
50 DAV is 75,200
|
$20.67
-3.97%
|
6/29/2012
|
$18.01
|
PP = $18.15
|
|
MB = $19.06
|
Most Recent Note - 10/2/2012 5:17:29 PM
G - Consolidating -5.7% off its 52-week high today, after a streak of 6 consecutive losses it found support at its 50 DMA line. More damaging losses would raise concerns and trigger technical sell signals.
>>> The latest Featured Stock Update with an annotated graph appeared on 9/13/2012. Click here.
View all notes |
Alert me of new notes |
CANSLIM.net Company Profile |
SEC |
Zacks Reports |
StockTalk |
News |
Chart |
Request a new note
C
A N
S L
I M
|
LKQ
-
NASDAQ
L K Q Corp
WHOLESALE - Auto Parts
|
$19.36
|
+0.08
0.41% |
$19.46
|
937,863
65.34% of 50 DAV
50 DAV is 1,435,300
|
$20.02
-3.27%
|
8/9/2012
|
$18.97
|
PP = $18.72
|
|
MB = $19.66
|
Most Recent Note - 10/3/2012 6:22:53 PM
Y - Rebounded above its 50 DMA line helping its technical stance with today's gain backed by above average volume, and its color code is changed to yellow again. Do not be confused by a 2:1 share split effective 9/19/12 (Featured Price, Pivot Point and Max Buy were adjusted).
>>> The latest Featured Stock Update with an annotated graph appeared on 9/17/2012. Click here.
View all notes |
Alert me of new notes |
CANSLIM.net Company Profile |
SEC |
Zacks Reports |
StockTalk |
News |
Chart |
Request a new note
C
A N
S L
I M
|
Symbol/Exchange
Company Name
Industry Group |
PRICE |
CHANGE
(%Change) |
Day High |
Volume
(% DAV)
(% 50 day avg vol) |
52 Wk Hi
% From Hi |
Featured
Date |
Price
Featured |
Pivot Featured |
|
Max Buy |
LNKD
-
NYSE
Linkedin Corp Class A
INTERNET - Internet Information Providers
|
$118.83
|
-3.15
-2.58% |
$123.43
|
1,594,353
63.98% of 50 DAV
50 DAV is 2,491,900
|
$125.50
-5.31%
|
9/5/2012
|
$113.25
|
PP = $113.10
|
|
MB = $118.76
|
Most Recent Note - 10/3/2012 1:33:49 PM
G - Trading up on light volume today, within close striking distance of its best-ever close. Volume totals have been cooling in recent weeks. Prior highs near $113 and its 50 DMA line define support to watch on pullbacks.
>>> The latest Featured Stock Update with an annotated graph appeared on 9/6/2012. Click here.
View all notes |
Alert me of new notes |
CANSLIM.net Company Profile |
SEC |
Zacks Reports |
StockTalk |
News |
Chart |
Request a new note
C
A N
S L
I M
|
LULU
-
NASDAQ
Lululemon Athletica
MANUFACTURING - Textile Manufacturing
|
$75.40
|
-1.05
-1.37% |
$77.09
|
1,131,804
43.06% of 50 DAV
50 DAV is 2,628,500
|
$81.09
-7.02%
|
10/2/2012
|
$74.89
|
PP = $78.97
|
|
MB = $82.92
|
Most Recent Note - 10/2/2012 8:49:27 PM
Y - Tallied a gain with above average volume today after highlighted in yellow with a new pivot point cited based on its 9/14/12 high while building on a cup-with-handle base pattern. Volume-driven gains above its pivot point are necessary to confirm a technical buy signal before action may be justified by disciplined investors. Fundamentals remain strong (good C and A criteria). Rebounded impressively after a deep consolidation below its 200 DMA line since dropped from the Featured Stocks list on 5/17/12. See the latest FSU analysis for more details and a new annotated graph.
>>> The latest Featured Stock Update with an annotated graph appeared on 10/2/2012. Click here.
View all notes |
Alert me of new notes |
CANSLIM.net Company Profile |
SEC |
Zacks Reports |
StockTalk |
News |
Chart |
Request a new note
C
A N
S L
I M
|
MIDD
-
NASDAQ
Middleby Corp
MANUFACTURING - Diversified Machinery
|
$118.82
|
-0.05
-0.04% |
$121.96
|
37,358
36.06% of 50 DAV
50 DAV is 103,600
|
$122.57
-3.06%
|
8/9/2012
|
$118.60
|
PP = $104.92
|
|
MB = $110.17
|
Most Recent Note - 10/1/2012 5:59:10 PM
G - Perched -4.4% off its 52-week high after a gain today with higher (near average) volume. Extended from its prior base, and its 50 DMA line and recent lows define near-term chart support to watch.
>>> The latest Featured Stock Update with an annotated graph appeared on 9/18/2012. Click here.
View all notes |
Alert me of new notes |
CANSLIM.net Company Profile |
SEC |
Zacks Reports |
StockTalk |
News |
Chart |
Request a new note
C
A N
S L
I M
|
N
-
NYSE
Netsuite Inc
DIVERSIFIED SERVICES - Business/Management Services
|
$62.78
|
-1.22
-1.91% |
$64.70
|
322,665
49.31% of 50 DAV
50 DAV is 654,400
|
$64.26
-2.30%
|
8/20/2012
|
$55.88
|
PP = $59.32
|
|
MB = $62.29
|
Most Recent Note - 10/2/2012 5:20:55 PM
G - Consolidating above its "max buy" level. Prior highs near $59 define initial support above its 50 DMA line where violations would trigger technical sell signals.
>>> The latest Featured Stock Update with an annotated graph appeared on 9/24/2012. Click here.
View all notes |
Alert me of new notes |
CANSLIM.net Company Profile |
SEC |
Zacks Reports |
StockTalk |
News |
Chart |
Request a new note
C
A N
S L
I M
|
NSM
-
NYSE
Nationstar Mtg Hldgs Inc
FINANCIAL SERVICES - Credit Services
|
$34.08
|
-1.29
-3.65% |
$35.87
|
1,494,099
129.85% of 50 DAV
50 DAV is 1,150,600
|
$37.20
-8.39%
|
8/29/2012
|
$27.96
|
PP = $28.85
|
|
MB = $30.29
|
Most Recent Note - 10/5/2012 5:47:11 PM
G - A steep upward trendline defines a near-term support level above its 50 DMA line. Finished today at the session low with a loss on above average volume. A worrisome "negative reversal" on 10/03/12 after hitting a new 52-week high raised some concerns after repeatedly noted as - "Extended from its prior base."
>>> The latest Featured Stock Update with an annotated graph appeared on 9/7/2012. Click here.
View all notes |
Alert me of new notes |
CANSLIM.net Company Profile |
SEC |
Zacks Reports |
StockTalk |
News |
Chart |
Request a new note
C
A N
S L
I M
|
Symbol/Exchange
Company Name
Industry Group |
PRICE |
CHANGE
(%Change) |
Day High |
Volume
(% DAV)
(% 50 day avg vol) |
52 Wk Hi
% From Hi |
Featured
Date |
Price
Featured |
Pivot Featured |
|
Max Buy |
OSIS
-
NASDAQ
O S I Systems Inc
ELECTRONICS - Semiconductor Equipment and Mate
|
$75.97
|
+0.10
0.13% |
$77.37
|
84,859
64.00% of 50 DAV
50 DAV is 132,600
|
$78.93
-3.75%
|
9/5/2012
|
$74.39
|
PP = $75.10
|
|
MB = $78.86
|
Most Recent Note - 10/2/2012 5:23:44 PM
Y - Consolidating just -3% off its 52-week high today. It remains below its "max buy" level after bullish action recently confirmed a technical buy signal. Near term support is at its 50 DMA line.
>>> The latest Featured Stock Update with an annotated graph appeared on 9/14/2012. Click here.
View all notes |
Alert me of new notes |
CANSLIM.net Company Profile |
SEC |
Zacks Reports |
StockTalk |
News |
Chart |
Request a new note
C
A N
S L
I M
|
RNF
-
NYSE
Rentech Nitrogen Ptnr Lp
CHEMICALS - Agricultural Chemicals
|
$36.09
|
+0.50
1.40% |
$36.35
|
359,515
76.46% of 50 DAV
50 DAV is 470,200
|
$40.05
-9.89%
|
7/27/2012
|
$29.58
|
PP = $30.60
|
|
MB = $32.13
|
Most Recent Note - 10/4/2012 7:18:08 PM
G - Down today for a 3rd consecutive loss with above average volume, sinking toward its 50 DMA line. Its volume-driven loss on the prior session violated a previously noted upward trendline defining near-term chart support in the $37 area which may be considered an early sell signal. See the latest FSU analysis for more details and a new annotated graph.
>>> The latest Featured Stock Update with an annotated graph appeared on 10/4/2012. Click here.
View all notes |
Alert me of new notes |
CANSLIM.net Company Profile |
SEC |
Zacks Reports |
StockTalk |
News |
Chart |
Request a new note
C
A N
S L
I M
|
SWI
-
NYSE
Solarwinds Inc
COMPUTER SOFTWARE and SERVICES - Application Software
|
$56.96
|
-0.32
-0.56% |
$58.57
|
698,715
65.39% of 50 DAV
50 DAV is 1,068,500
|
$60.95
-6.55%
|
7/25/2012
|
$47.82
|
PP = $47.89
|
|
MB = $50.28
|
Most Recent Note - 10/3/2012 6:24:50 PM
Y - Color code is changed to yellow based on the secondary buy point explained in the latest FSU analysis along with a new annotated graph. A subsequent violation of the 9/26/12 low ($53.78) would raise more serious concerns and trigger technical sell signals.
>>> The latest Featured Stock Update with an annotated graph appeared on 10/3/2012. Click here.
View all notes |
Alert me of new notes |
CANSLIM.net Company Profile |
SEC |
Zacks Reports |
StockTalk |
News |
Chart |
Request a new note
C
A N
S L
I M
|
TDG
-
NYSE
Transdigm Group Inc
AEROSPACE/DEFENSE - Aerospace/Defense Products and; Services
|
$150.08
|
+1.11
0.75% |
$152.62
|
754,374
186.45% of 50 DAV
50 DAV is 404,600
|
$149.27
0.54%
|
8/16/2012
|
$132.23
|
PP = $136.44
|
|
MB = $143.26
|
Most Recent Note - 10/4/2012 7:24:04 PM
G - Rallied further above its "max buy" level to another new 52-week high with above average volume behind today's 3rd consecutive gain. Its 50 DMA line and prior highs define near-term support to watch in the $135-136 area on pullbacks.
>>> The latest Featured Stock Update with an annotated graph appeared on 9/20/2012. Click here.
View all notes |
Alert me of new notes |
CANSLIM.net Company Profile |
SEC |
Zacks Reports |
StockTalk |
News |
Chart |
Request a new note
C
A N
S L
I M
|
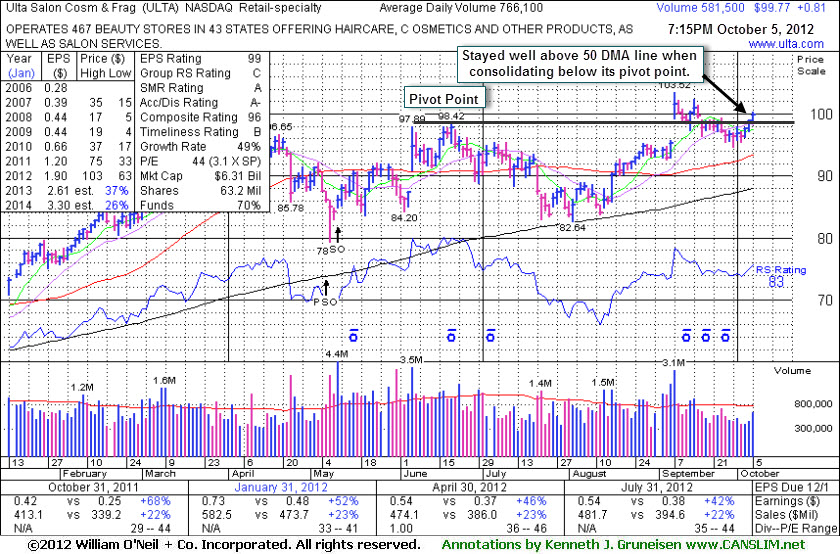
ULTA
-
NASDAQ
Ulta Salon Cosm & Frag
SPECIALTY RETAIL - Specialty Retail, Other
|
$99.77
|
+0.82
0.82% |
$100.37
|
581,556
75.91% of 50 DAV
50 DAV is 766,100
|
$103.52
-3.62%
|
9/4/2012
|
$93.17
|
PP = $98.52
|
|
MB = $103.45
|
Most Recent Note - 10/5/2012 7:58:05 PM
Y - Volume totals have been cooling in recent weeks following its 9/07/12 breakaway gap on earnings news. See the latest FSU analysis for more details and a new annotated graph.
>>> The latest Featured Stock Update with an annotated graph appeared on 10/5/2012. Click here.
View all notes |
Alert me of new notes |
CANSLIM.net Company Profile |
SEC |
Zacks Reports |
StockTalk |
News |
Chart |
Request a new note
C
A N
S L
I M
|
Symbol/Exchange
Company Name
Industry Group |
PRICE |
CHANGE
(%Change) |
Day High |
Volume
(% DAV)
(% 50 day avg vol) |
52 Wk Hi
% From Hi |
Featured
Date |
Price
Featured |
Pivot Featured |
|
Max Buy |
ULTI
-
NASDAQ
Ultimate Software Group
INTERNET - Internet Software and Services
|
$101.82
|
-3.17
-3.02% |
$105.00
|
159,064
95.71% of 50 DAV
50 DAV is 166,200
|
$106.40
-4.30%
|
8/27/2012
|
$98.36
|
PP = $99.19
|
|
MB = $104.15
|
Most Recent Note - 10/5/2012 8:02:08 PM
Y - Erased its prior gain today, closing back below its "max buy" level and its color code is changed to yellow. Recent lows define initial support to watch along with its 50 DMA line in the $96 area where violations would raise concerns and trigger technical sell signals.
>>> The latest Featured Stock Update with an annotated graph appeared on 9/27/2012. Click here.
View all notes |
Alert me of new notes |
CANSLIM.net Company Profile |
SEC |
Zacks Reports |
StockTalk |
News |
Chart |
Request a new note
C
A N
S L
I M
|
VSI
-
NYSE
Vitamin Shoppe Inc
SPECIALTY RETAIL - Specialty Retail, Other
|
$57.59
|
-1.30
-2.21% |
$59.34
|
294,201
80.47% of 50 DAV
50 DAV is 365,600
|
$61.83
-6.85%
|
6/29/2012
|
$54.93
|
PP = $55.03
|
|
MB = $57.78
|
Most Recent Note - 10/3/2012 1:28:13 PM
G - Volume totals have been cooling in recent weeks while consolidating. Prior lows near $52 define important chart support below its 50 DMA line.
>>> The latest Featured Stock Update with an annotated graph appeared on 9/10/2012. Click here.
View all notes |
Alert me of new notes |
CANSLIM.net Company Profile |
SEC |
Zacks Reports |
StockTalk |
News |
Chart |
Request a new note
C
A N
S L
I M
|
WPI
-
NYSE
Watson Pharmaceuticals
DRUGS - Drugs - Generic
|
$87.86
|
+0.67
0.77% |
$88.06
|
1,214,822
118.98% of 50 DAV
50 DAV is 1,021,000
|
$87.59
0.31%
|
8/24/2012
|
$82.90
|
PP = $81.10
|
|
MB = $85.16
|
Most Recent Note - 10/3/2012 1:29:39 PM
G - Hit a new 52-week high with today's small gain on light volume, getting more extended from its prior base. Prior lows and its 50 DMA line in the $82 area define important support to watch on pullbacks.
>>> The latest Featured Stock Update with an annotated graph appeared on 9/28/2012. Click here.
View all notes |
Alert me of new notes |
CANSLIM.net Company Profile |
SEC |
Zacks Reports |
StockTalk |
News |
Chart |
Request a new note
C
A N
S L
I M
|