You are not logged in.
This means you
CAN ONLY VIEW reports that were published prior to Monday, April 14, 2025.
You
MUST UPGRADE YOUR MEMBERSHIP if you want to see any current reports.
AFTER MARKET UPDATE - MONDAY, OCTOBER 5TH, 2009
Previous After Market Report Next After Market Report >>>
|
|
|
|
DOW |
+112.08 |
9,599.75 |
+1.18% |
|
Volume |
1,118,483,510 |
-20% |
|
Volume |
2,242,090,700 |
-11% |
|
NASDAQ |
+20.04 |
2,068.15 |
+0.98% |
|
Advancers |
2,532 |
81% |
|
Advancers |
1,969 |
70% |
|
S&P 500 |
+15.25 |
1,040.46 |
+1.49% |
|
Decliners |
516 |
17% |
|
Decliners |
733 |
26% |
|
Russell 2000 |
+10.91 |
591.11 |
+1.88% |
|
52 Wk Highs |
188 |
|
|
52 Wk Highs |
56 |
|
|
S&P 600 |
+5.33 |
310.41 |
+1.75% |
|
52 Wk Lows |
2 |
|
|
52 Wk Lows |
6 |
|
|
 |
Major Averages' Rise On Quiet Volume Reveals Lack Of Great Buying Demand
Adam Sarhan, Contributing Writer,
The major averages bounced at their respective 50-day moving average (DMA) lines on Monday after the dollar fell and the Institute for Supply Management released a strong service index. Volume was reported below average and below Friday's levels, which was not an encouraging sign, since volume had expanded as the market declined recently. However, it was encouraging to see advancers trump decliners by over a 4-to-1 ratio on the NYSE and by almost a 3-to-1 ratio on the Nasdaq exchange. There were 22 high-ranked companies from the CANSLIM.net Leaders List that made a new 52-week high and appeared on the CANSLIM.net BreakOuts Page, nicely higher than the 4 issues that appeared on the prior session. New 52-week highs still outnumbered new 52-week lows on both exchanges.
The US dollar fell, which helped send a slew of other capital markets higher, mainly helping stocks and precious metals rally. Normally, dollar denominated markets rally when the dollar falls due to the fact that a weaker dollar makes the underlying investment "cheaper" for foreign investors. It is important to note that crude oil continues to lag its peers and is having a very difficult time rallying in recent weeks. This is a negative divergence because crude may be telling us that economic demand, a key bullish component, may be lagging. Time will tell if this is just a short-term anomaly or if other capital markets will follow in crude's bearish footsteps.
The Institute for Supply Management’s released its gauge of non-manufacturing businesses (a.k.a. service index) which was stronger than expected and the first month of "positive growth" in a year. The index rose to 50.9, which was slightly above the boom/bust line of 50 and higher than the 48.4 reading expected on Wall Street. Financial stocks caught a bid after Goldman Sachs (GS +3.81%) upgraded a slew of financial companies and said they believe large banks will outperform regional lenders. The current rally remains under pressure which means caution remains the better part of valor.
PICTURED: The Dow Jones Industrial Average bounced off its 50 DMA line on Monday.
|
|
|
 |
Bank, Retail, and Semiconductor Indexes Bounced At 50 DMA Lines
Kenneth J. Gruneisen - Passed the CAN SLIM® Master's Exam
Commodity-linked areas posted solid gains as the Gold & Silver Index ($XAU +3.28%), Integrated Oil Index ($XOI +1.95%), and Oil Services Index ($OSX +2.61%) rose. The financial group was among Monday's widespread list of solid gainers as the Broker/Dealer Index ($XBD +2.35%) rallied and the Bank Index ($BKX +3.21%) bounced at its 50-day moving average line. The Retail Index ($RLX +1.35%) was another influential group making a stand at its short-term average line. Tech shares unanimously rose as the Networking Index ($NWX +1.96%), Semiconductor Index ($SOX +2.12%), Internet Index ($IIX +1.14%), and Biotechnology Index ($BTK +1.68%) posted gains along with the Healthcare Index ($HMO +1.02%).
Charts courtesy www.stockcharts.com
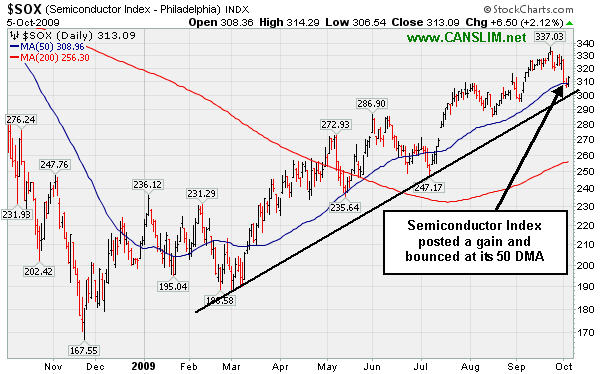
PICTURED: The Semiconductor Index posted a gain and bounced at its 50-day moving average (DMA) line. There were similar bounces at the 50 DMA lines for the Bank Index ($BKX +3.21%) and Retail Index ($RLX +1.35%), and it would be encouraging to see each of these influential indexes make a stand at their respective short-term average lines.
| Oil Services |
$OSX |
187.57 |
+4.77 |
+2.61% |
+54.52% |
| Healthcare |
$HMO |
1,137.77 |
+11.44 |
+1.02% |
+18.50% |
| Integrated Oil |
$XOI |
1,009.25 |
+19.29 |
+1.95% |
+3.02% |
| Semiconductor |
$SOX |
313.09 |
+6.50 |
+2.12% |
+47.57% |
| Networking |
$NWX |
228.93 |
+4.40 |
+1.96% |
+59.10% |
| Internet |
$IIX |
213.61 |
+2.40 |
+1.14% |
+59.68% |
| Broker/Dealer |
$XBD |
119.14 |
+2.74 |
+2.35% |
+53.79% |
| Retail |
$RLX |
372.34 |
+4.95 |
+1.35% |
+33.33% |
| Gold & Silver |
$XAU |
162.33 |
+5.16 |
+3.28% |
+31.07% |
| Bank |
$BKX |
46.26 |
+1.44 |
+3.21% |
+4.38% |
| Biotech |
$BTK |
903.80 |
+14.90 |
+1.68% |
+39.65% |
|
|
|
 |
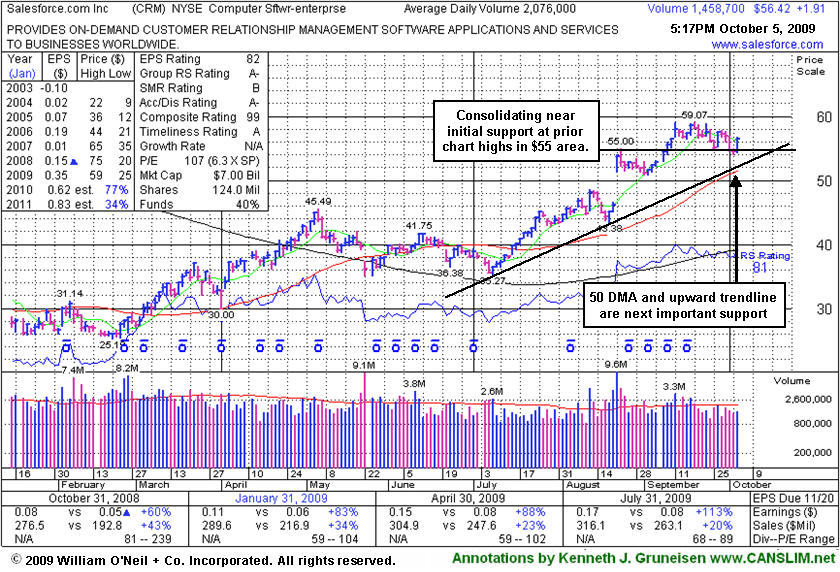
Quiet Consolidation Near An Initial Support Level
Kenneth J. Gruneisen - Passed the CAN SLIM® Master's Exam
Salesforce.com, Inc. (CRM +$1.91 or +3.93% to $56.42) posted a gain today on light volume after 4 consecutive losses on light volume, quietly consolidating above prior highs in the $55 area, an initial support level. More substantial technical support to watch is at its upward trendline and its 50 DMA line now coinciding in the $51 area. It was recently noted as it rose from a "3-weeks tight" type pattern and it stubbornly held its ground since its earlier "breakaway gap" for a considerable gain on 8/21/09 with more than 5 times average volume. The number of top-rated funds owning its shares rose from 272 in Sept '08 to 295 in Jun '09, which is reassuring news concerning the I criteria. It needs more time to form a new sound base before any new or add-on buying efforts might be appropriate under the investment system guidelines.
|
|
|
Color Codes Explained :
Y - Better candidates highlighted by our
staff of experts.
G - Previously featured
in past reports as yellow but may no longer be buyable under the
guidelines.
***Last / Change / Volume quote data in this table corresponds with the timestamp on the note***
Symbol/Exchange
Company Name
Industry Group |
Last |
Chg. |
Vol
% DAV |
Date Featured |
Price Featured |
Latest Pivot Point
Featured |
Status |
| Latest Max Buy Price |
ARO
- NYSE
Aeropostale Inc
RETAIL - Apparel Stores
|
$42.47
|
+0.64
|
1,739,541
66% DAV
2,652,700
|
8/21/2009
(Date
Featured) |
$39.21
(Price
Featured) |
PP = $38.84 |
G |
| MB = $40.78 |
Most Recent Note - 10/5/2009 4:37:02 PM
G - Small gain today on light volume for this high-ranked leader in the Retail - Clothing/shoe group. It is consolidating above support at its 50 DMA line, with the next support to watch at prior highs in the $38 area. It was featured in yellow in the 8/21/09 Mid-Day BreakOuts Report (read here).
>>> The latest Featured Stock Update with an annotated graph appeared on 9/18/2009. click here.
|
|
C
A
S
I |
News |
Chart |
SEC
View all notes Alert
me of new notes
Company
Profile
|
ARST
-
|
$23.00
|
+0.56
|
385,257
57% DAV
671,900
|
9/1/2009
(Date
Featured) |
$19.91
(Price
Featured) |
PP = $20.90 |
G |
| MB = $21.95 |
Most Recent Note - 10/5/2009 4:39:30 PM
G - Small gain today on light volume. On 10/02/09 it traded down near 4-week lows and then positively reversed and closed near the session high amid widespread market weakness. As previously noted, "Recent lows may be considered an initial support level. Prior chart highs and its 50 DMA line, coinciding in the $20 area, define an important technical support level to watch on pullbacks."
>>> The latest Featured Stock Update with an annotated graph appeared on 10/2/2009. click here.
|
|
C
A
S
I |
News |
Chart |
SEC
View all notes Alert
me of new notes
Company
Profile
|
BIDU
- NASDAQ
Baidu Inc Ads
INTERNET - Internet Information Providers
|
$381.89
|
+6.68
|
1,079,489
63% DAV
1,721,100
|
9/8/2009
(Date
Featured) |
$351.80
(Price
Featured) |
PP = $368.59 |
Y |
| MB = $387.02 |
Most Recent Note - 10/5/2009 4:41:39 PM
Y - Small gain on light volume today after a positive reversal on Friday. Consolidating near prior chart highs and near its 50 DMA line after distributional pressure in recent weeks. Color code was changed to yellow, yet deteriorating market conditions (the M criteria) give cause for great caution. BIDU was featured in yellow in the 9/08/09 Mid-Day BreakOuts Report (read here).
>>> The latest Featured Stock Update with an annotated graph appeared on 9/21/2009. click here.
|
|
C
A
S
I |
News |
Chart |
SEC
View all notes Alert
me of new notes
Company
Profile
|
CACC
- NASDAQ
Credit Acceptance Corp
FINANCIAL SERVICES - Credit Services
|
$34.02
|
+1.82
|
73,604
176% DAV
41,900
|
9/29/2009
(Date
Featured) |
$33.48
(Price
Featured) |
PP = $32.60 |
Y |
| MB = $34.23 |
Most Recent Note - 10/5/2009 4:43:09 PM
Y - Gapped up today and rallied with above average volume to a new all-time high near its max buy level. It finished last week rallying after a dose of distributional pressure followed its 9/29/09 breakout from a 6-week base. The Finance - Consumer/Commercial Loans firm has maintained a great track record of annual and quarterly sales revenues and earnings increases. It was featured on 9/29/09 in yellow in the mid-day report (read here).
>>> The latest Featured Stock Update with an annotated graph appeared on 9/29/2009. click here.
|
|
C
A
S
I |
News |
Chart |
SEC
View all notes Alert
me of new notes
Company
Profile
|
CRM
- NYSE
Salesforce.com Inc
INTERNET - Internet Software & Services
|
$56.42
|
+1.91
|
1,468,321
71% DAV
2,076,000
|
8/16/2009
(Date
Featured) |
$47.12
(Price
Featured) |
PP = $45.59 |
G |
| MB = $47.87 |
Most Recent Note - 10/5/2009 4:46:14 PM
G - Gain today on light volume, consolidating above prior highs in the $55 area, an initial support level. More substantial technical support to watch is at its upward trendline and 50 DMA line now coinciding in the $51 area.
>>> The latest Featured Stock Update with an annotated graph appeared on 10/5/2009. click here.
|
|
C
A
S
I |
News |
Chart |
SEC
View all notes Alert
me of new notes
Company
Profile
|
EBIX
- NASDAQ
Ebix Inc
COMPUTER SOFTWARE & SERVICES - Business Software & Services
|
$53.02
|
+0.11
|
176,325
102% DAV
172,400
|
8/28/2009
(Date
Featured) |
$45.86
(Price
Featured) |
PP = $45.35 |
G |
| MB = $47.62 |
Most Recent Note - 10/5/2009 4:47:38 PM
G - Held its ground today after an impressive positive reversal on the prior session closed out a week of big gains on heavy volume. It has not formed a new sound base since heavy distributional pressure led to a pullback near support at early-August chart highs and its 50 DMA line in the $45 area.
>>> The latest Featured Stock Update with an annotated graph appeared on 9/24/2009. click here.
|
|
C
A
S
I |
News |
Chart |
SEC
View all notes Alert
me of new notes
Company
Profile
|
GMCR
- NASDAQ
Green Mtn Coffee Roastrs
FOOD & BEVERAGE - Processed & Packaged Goods
|
$71.11
|
+1.55
|
924,196
62% DAV
1,500,200
|
10/5/2009
(Date
Featured) |
$71.11
(Price
Featured) |
PP = $75.89 |
Y |
| MB = $79.68 |
Most Recent Note - 10/5/2009 4:58:13 PM
Y - Gain today on light volume helped it bounce back for a close above its July-September high closes in the $70 area. It has formed a cup-with-high-handle pattern, and its color code is changed to yellow with new pivot point and max buy levels noted. Disciplined investors will watch for volume-driven gains to trigger a new technical buy signal before making any initial buys or add-on purchases.
>>> The latest Featured Stock Update with an annotated graph appeared on 9/23/2009. click here.
|
|
C
A
S
I |
News |
Chart |
SEC
View all notes Alert
me of new notes
Company
Profile
|
NTES
- NASDAQ
Netease Inc Adr
INTERNET - Internet Information Providers
|
$43.00
|
-0.94
|
2,351,280
120% DAV
1,963,800
|
9/23/2009
(Date
Featured) |
$47.11
(Price
Featured) |
PP = $47.04 |
G |
| MB = $49.39 |
Most Recent Note - 10/5/2009 5:02:15 PM
G- Loss on above average volume today indicated distributional pressure as it closed just under its 50 DMA line and violated an upward trendline. As previously noted, "Deterioration below those levels would raise more serious concerns and trigger technical sell signals." Color code was changed to green based on promptly negating its latest breakout and then trading more than -7% below its pivot point. This may also be considered a riskier late-stage base.
>>> The latest Featured Stock Update with an annotated graph appeared on 9/25/2009. click here.
|
|
C
A
S
I |
News |
Chart |
SEC
View all notes Alert
me of new notes
Company
Profile
|
NVEC
- NASDAQ
N V E Corp
ELECTRONICS - Semiconductor - Specialized
|
$50.77
|
+0.62
|
71,830
83% DAV
86,300
|
8/26/2009
(Date
Featured) |
$55.32
(Price
Featured) |
PP = $57.60 |
G |
| MB = $60.48 |
Most Recent Note - 10/5/2009 5:04:36 PM
G - Small gain today after 4 consecutive losses on light volume. Concerns increase the longer it struggles below its 50 DMA line. Near prior chart lows in the $49 area, where any further deterioration (especially if on heavy volume) may negate its 7/23/09 breakaway gap and raise serious concerns, triggering a more worrisome technical sell signal.
>>> The latest Featured Stock Update with an annotated graph appeared on 9/30/2009. click here.
|
|
C
A
S
I |
News |
Chart |
SEC
View all notes Alert
me of new notes
Company
Profile
|
PEGA
- NASDAQ
Pegasystems Inc
COMPUTER SOFTWARE & SERVICES - Business Software & Services
|
$33.19
|
+1.19
|
219,200
55% DAV
398,400
|
9/9/2009
(Date
Featured) |
$31.14
(Price
Featured) |
PP = $33.35 |
Y |
| MB = $35.02 |
Most Recent Note - 10/5/2009 5:08:30 PM
Y - Gain today on light volume, closing near the session high. This high-ranked Computer Software - Financial firm gapped down on 10/02/09 and traded under its 50 DMA line, then found prompt support and rallied to close near the session high for a loss on average volume. The pullback raised some concerns as it violated an upward trendline connecting its July-September chart lows, an initial support level.
>>> The latest Featured Stock Update with an annotated graph appeared on 9/22/2009. click here.
|
|
C
A
S
I |
News |
Chart |
SEC
View all notes Alert
me of new notes
Company
Profile
|
SWI
- NYSE
Solarwinds Inc
COMPUTER SOFTWARE & SERVICES - Application Software
|
$21.53
|
+0.99
|
359,787
72% DAV
500,500
|
9/30/2029
(Date
Featured) |
$22.03
(Price
Featured) |
PP = $21.72 |
Y |
| MB = $22.81 |
Most Recent Note - 10/5/2009 5:11:31 PM
Y - Gain today on light volume followed 4 consecutive losses on light volume, bouncing right at support offered by its 50 DMA line, and closing back above its 8/04/09 high close. It was featured in the October 2009 issue of CANSLIM.net News (read here).
>>> The latest Featured Stock Update with an annotated graph appeared on 9/30/2009. click here.
|
|
C
A
S
I |
News |
Chart |
SEC
View all notes Alert
me of new notes
Company
Profile
|
WNS
- NYSE
W N S Holdings Ltd Ads
DIVERSIFIED SERVICES - Business/Management Services
|
$15.51
|
-0.24
|
83,179
165% DAV
50,300
|
9/28/2009
(Date
Featured) |
$15.28
(Price
Featured) |
PP = $16.10 |
Y |
| MB = $16.91 |
Most Recent Note - 10/5/2009 5:12:46 PM
Y - Another small loss on above average volume today exemplified the "churning" and lack of meaningful price progress (chart-wise) in recent weeks - action indicative of distributional pressure. Still perched above its 50 DMA line and stubbornly holding its ground, it traded up as high as $16.50 on two sessions last week but encountered stubborn resistance after a considerable 9/29/09 gain for a new 52-week high and new high close with volume 11 times its daily average volume. It formed an orderly flat base for at least 5-weeks, and it was featured in yellow in the 9/28/09 mid-day report (read here). Quarterly earnings have been above the +25% guideline and its annual earnings history has been great, satisfying the C & A criteria. However, sales revenues growth has decelerated.
>>> The latest Featured Stock Update with an annotated graph appeared on 9/28/2009. click here.
|
|
C
A
S
I |
News |
Chart |
SEC
View all notes Alert
me of new notes
Company
Profile
|
|
|
|
THESE ARE NOT BUY RECOMMENDATIONS!
Comments contained in the body of this report are technical
opinions only. The material herein has been obtained
from sources believed to be reliable and accurate, however,
its accuracy and completeness cannot be guaranteed.
This site is not an investment advisor, hence it does
not endorse or recommend any securities or other investments.
Any recommendation contained in this report may not
be suitable for all investors and it is not to be deemed
an offer or solicitation on our part with respect to
the purchase or sale of any securities. All trademarks,
service marks and trade names appearing in this report
are the property of their respective owners, and are
likewise used for identification purposes only.
This report is a service available
only to active Paid Premium Members.
You may opt-out of receiving report notifications
at any time. Questions or comments may be submitted
by writing to Premium Membership Services 665 S.E. 10 Street, Suite 201 Deerfield Beach, FL 33441-5634 or by calling 1-800-965-8307
or 954-785-1121.
|
|
|


